Kopernik Global Investors - 1Q 2019 Conference Call Presented by: David B. Iben, CFA CIO & Lead Portfolio Manager - Kopernik Global ...
←
→
Page content transcription
If your browser does not render page correctly, please read the page content below

Kopernik Global Investors
1Q 2019 Conference Call

Presented by:
David B. Iben, CFA
CIO & Lead Portfolio Manager
Important Information
The information presented herein is proprietary to Kopernik Global Investors, LLC. This material is approved for a presentation to authorized individuals only and, accordingly, this
material is not to be reproduced in whole or in part or used for any purpose except as authorized by Kopernik Global Investors, LLC.

Please consider all risks carefully before investing. The investment strategies managed by Kopernik are subject to certain risks such as market, investment style, interest rate,
deflation, and illiquidity risk. Investments in small and mid-capitalization companies also involve greater risk and portfolio price volatility than investments in larger capitalization
stocks. Investing in non-U.S. markets, including emerging and frontier markets, involves certain additional risks, including potential currency fluctuations and controls, restrictions
on foreign investments, less governmental supervision and regulation, less liquidity, less disclosure, and the potential for market volatility, expropriation, confiscatory taxation, and
social, economic and political instability. Investments in energy and natural resources companies are especially affected by developments in the commodities markets, the supply
of and demand for specific resources, raw materials, products and services, the price of oil and gas, exploration and production spending, government regulation, economic
conditions, international political developments, energy conservation efforts and the success of exploration projects. There can be no assurances that investment objectives will
be achieved.

Kopernik Global Investors, LLC is an investment adviser registered under the Investment Advisers Act of 1940, as amended.

This document, as of April 2019 is descriptive of how the Kopernik team manages the investment strategies offered by Kopernik. There is no guarantee that any strategy’s
investment performance objectives will be achieved. This profile is not legally binding on Kopernik Global Investors, LLC or its affiliates.

© 2019 Kopernik Global Investors, LLC | Two Harbour Place | 302 Knights Run Avenue Suite 1225 | Tampa, Florida 33602 | 813.314.6100 | www.kopernikglobal.com

                                                                                                                                                                            2
Centering on Client Success
                                                                                                                                            Total Firm AUM
Kopernik Global Investors, LLC (“Kopernik”) is a global                                                                                     Breakdown
equity investment management specialist, organized to                                                                     UCITS
ensure a culture centered on client success.                                         Separate Accounts                     18%
                                                                                            36%

       •   Leadership and ownership by investment professionals                                                             Private Funds
                                                                                                                                 7%

       •   100% employee owned                                                                                                                  Collective
                                                                                                           Mutual Funds                     Investment Trusts
       •   Equity participation for all professionals                                                          37%                                 2%

       •   Principals invest alongside clients

       •   Capacity to be limited, enhancing return potential
                                                                  Total Managed and Advisory Only Assets by Type
                                                                  (As of 3/31/2019)

                                                                  Managed Assets
Focused Offerings                                                  Mutual Funds                                                       $1,221.00 MM
                                                                   Private Funds                                                        $229.02 MM
       •   Kopernik Global All-Cap                                 UCITS (Sub-advised)                                                  $607.99 MM
                                                                   Separate Accounts                                                  $1,172.36 MM
       •   Kopernik Global Unconstrained                           Collective Investment Trusts                                          $50.33 MM
                                                                  Total Firm AUM                                                      $3,280.70 MM
       •   Kopernik Global Long-Term Opportunities
           (formerly Kopernik Global Real Asset)                  Advisory Only Assets
                                                                   Separate Accounts                                                    $564.06 MM
       •   Kopernik International
                                                                  Total Managed and Advisory Only Assets:                             $3,844.76 MM
                                                                  Assets as of March 31, 2019 are preliminary.
                                                                                                                                                  3
Achieving Value through Independent Thought
Mikolaj Kopernik, better known by the Latin spelling, Nicolaus Copernicus, proposed the heliocentric model of the universe in the early 1500s. What
interests us is the fact that he trusted his own observations instead of accepting what “everyone” thought to be true. He faced scorn for his “novel and
incomprehensible” theses. Though primarily an astronomer, Kopernik set forth a version of the “quantity theory of money,” a principal concept in
economics to the present day. He also formulated a version of Gresham’s Law, predating Gresham.
As independent thinkers, Kopernik Global Investors honors Mikolaj Kopernik in the contemporary investment world. We believe that accomplished
investors who trust their own analyses and instincts can generate significant excess returns as a result of market inefficiencies driven by erroneous
professional and academic theories and practices.

        Like our namesake, we are dedicated to reasoning over
         convention and to clients’ needs above convenience.

                                                        Our Investment Beliefs

                                                                   Independent thought

                                                              Long-term global perspective

                                                                     Limited capacity

                                                                  Value as a prerequisite

                                                             Bottom-up fundamental analysis

                                                                Industry-tailored valuations

                                                                      Group vetting

                                                                                                                                              4
Q1 in a Nutshell

“The job of the Federal Reserve is to take away the punch bowl just as the party gets going”
                                                                       William McChesney Martin
                                                                     9th   Chairman of the Federal Reserve

                                                                                                      5
The Return of Monetary Profligacy

                                    6
• Mnuchin to convene U.S. 'Plunge Protection Team’
• Fed Chairman Powell reverses course says interest rate hikes are not likely anytime soon
• Get Used to the “Powell Put”
• The Fed committed to stopping “Quantitative Tightening (or Q.T.)” by the end of September
• The ECB took investors mostly by surprise in its decision to announce a new round of
  stimulus
• Kuroda brushes aside that BOJ has run out of tools to ease monetary policy - "There has
  been no change to our stance of buying large amounts of government bonds," Kuroda said
• China’s Credit Growth Surges Back - Aggregate financing was 2.86 trillion yuan ($426
  billion) last month, compared with about 700 billion yuan in February - the People’s Bank of
  China

                                                                                       7
But, Other than Inflate Asset Prices, Has Easy Money
Worked?

                                                       8
We are told that QE worked
We are told that MMT portends Nirvana;
    This seems like an excellent time
    to employ Independent Thought.

                                         9
Is the increase in asset prices due to increasing
fundamentals?

                                                    10
Prices and fundamentals are Diverging
11Synchronized Global Economic Slowdown
12Inequality back to 1929 levels
13Student Loan Troubles
1415
Auto Loan at GFC Delinquency Levels

                                      Source: Bloomberg.com

                                                        16
Potentially a larger problem
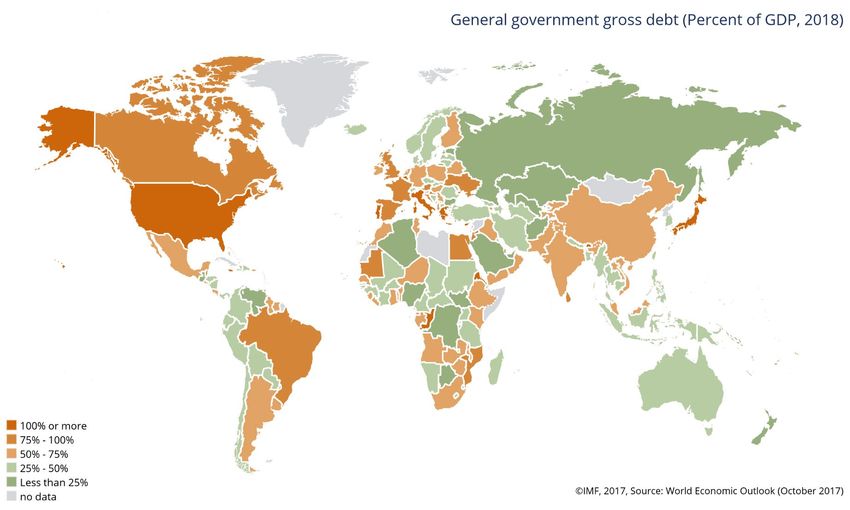
17Sovereign Debt has Become a Major Problem
affecting QE driven economies
such as the U.S., Japan, and China
18Inflationary Symptoms are important areas
And what about asset
inflation?
Stocks?
Bonds?
Real Estate?
Source: BLS
19No Inflation?
Is it a coincidence that
the Federal Reserve was
founded just over 100
years ago?
20Policy of consumption, rather than production
21Do Lax Monetary Standards Lead to Lax Accounting
Standards?
Since 1999, write-offs and write-downs for the companies in the S&P 500 totaled $220.92 per share,
more than $1.84 trillion! Cumulative operating earnings totaled $1,616 per share, or $13.5 trillion, so the
shave was 13.6% of S&P defined operating earnings.
S&P 500 SAI Accounting Adjustments 2018 Dollar Adjustment Per Share Adjustment
Write-offs and Write-downs ($195 B) ($23.55)
Pensions ($70 B) ($8.35)
Amortization of Intangibles $30 B $3.53
Total ($235 B) ($28.37)
Source: Semper Augustus, 13D Global Strategy & Research - Feb 28 2019
22Does mindless monetary standards lead to mindless
investments?
23Does careless monetary standards lead to careless
investment?
24Does ill advised monetary policy lead to mal-investment?
25Is it a coincidence that the flows into assets roughly
match the amount printed by the Fed?
26How much higher can the U.S. Markets go?
27Investment Strategy
• Is It Possible For Bureaucrats to Conjure Wealth Out of Thin Air?
• Can Governments Borrow Their Way to Prosperity?
• Is the Best Way to Invest Sans Analysis? Really?
• Does a Government’s Weak Financial Position Truly Justify Lower Rates of Interest?
• Is Supply No Longer a Determinant of Price; Only Demand Matters Now?
• Are Good Stories Really More Valuable than Good Economics?
Inquiring Minds Want to Know!
We Believe that this will be a Stock-Pickers
Market; A Thinking Person’s Market!
28“Hit em where they ain’t” – Wee Willie Keeler
29Where they Ain’t is outside of the United States
30Which is a great opportunity, because that’s where the
growth & the Production is (especially in EM)
Source: Ed Yardeni, www.yardeni.com
31Notice the diverging productivity trends
32In their rush to buy FAANG, they left a lot of resources
behind.
Emerging Markets vs NASDAQ vs Gold Miners vs RTSI Index
July 2013 – April 2019
$250
$200
$150
$100
$50
$-
Jul-13 Jul-14 Jul-15 Jul-16 Jul-17 Jul-18
iShares MSCI Emerging Markets Indx (EEM US) VanEck Vectors Gold Miners ETF (GDX US)
NASDAQ Composite Index (CCMP Index) Russian Trading System Cash Index (RTSI Index)
Source: Bloomberg.com
33Commodities are arguably the cheapest ever
34They especially don’t like precious metals
Gold vs Copper vs Silver
Jan 2019 – April 2019
$113
$111
$109
$107
$105
$103
$101
$99
$97
$95
Dec-18 Jan-19 Feb-19 Mar-19
Gold Copper Silver
Source: Bloomberg.com
35They don’t like clean energy anymore
Uranium vs Crude Oil vs Natural Gas
Jan 2019 – April 2019
40
30
20
10
-
(10)
(20)
Dec-18 Jan-19 Feb-19 Mar-19
Uranium (UXA1) Crude Oil (CLA) Natural Gas (NGA)
Source: Bloomberg.com
36They don’t like volatility!
Security Changes in Global All-Cap Rep Account
12/1/18 - 2/28/19
New Net Added to Net Reduced Eliminated
Astarta Holding NV Centrais Eletricas Brasileiras China Yurun Food Group Ltd
Draegerwerk AG & Co KGaA China Mobile Ltd Diebold Nixdorf Inc
Hankook Tire Worldwide Co Ltd General Electric Co Goldcorp Inc
Hemas Holdings PLC Mitsubishi Corp Kinross Gold Corp
Northern Dynasty Minerals Ltd West Japan Railway Co Korea Electric Power Corp
Range Resources Corp Wheaton Precious Metals Corp
Turquoise Hill Resources Ltd
37Security Changes in International Rep Account
12/1/18 - 2/28/19
New Net Added to Net Reduced Eliminated
Turquoise Hill Resources Ltd Centrais Eletricas Brasileiras Kinross Gold Corp
China Mobile Ltd Korea Electric Power Corp
LUKOIL PJSC
38And they sure don’t like Value!
“It’s not enough to be different – you also need to be correct. The problem is that
extraordinary performance comes only from correct nonconsensual forecasts, but
nonconsensual forecasts are hard to make, hard to make correctly, and hard to act on. ”
- Howard Marks
As of March 31, 2019
Trailing P/B Ratio Trailing P/TBV Ratio Trailing EV/S Ratio Trailing P/CF Ratio
(Price to Book) (Price to Tangible Book Value) (Enterprise Value to Sale) (Price to Cash Flow)
Global Global
0.62 0.64 Global All-Cap 1.07 Global All-Cap 4.57
All-Cap All-Cap
MSCI ACWI 2.24 MSCI ACWI 2.40 MSCI ACWI 1.89 MSCI ACWI 10.70
International 0.66 International 0.68 International 0.97 International 4.11
MSCI ACWI ex USA 1.59 MSCI ACWI ex USA 1.84 MSCI ACWI ex USA 1.49 MSCI ACWI ex USA 9.03
Weighted Average Market Cap Median Market Cap Trailing P/E Ratio Yield TTM
($USD, Millions) ($USD, Millions) (Price to Earnings) (Trailing Twelve Months)
$12,578 G $1,472 Global All-Cap 10.07 Global All-Cap 2.31
G
MSCI ACWI $152,257 MSCI ACWI $10,166 MSCI ACWI 16.76 MSCI ACWI 2.53
I $15,005 International $3,757 International 7.65 International 2.32
MSCI ACWI ex USA $70,735 MSCI ACWI ex USA $8,441 MSCI ACWI ex USA 14.64 MSCI ACWI ex USA 3.27
Characteristics above are based on the holdings of a model portfolio as of March 31, 2019 and are calculated using data from Bloomberg. Harmonic weighted average is a method of calculating an average value that lessens
the impact of large outliers. The MSCI All Country World Index is a broad-based securities market index that captures over two thousand primarily large- and mid-cap companies across 23 developed and 24 emerging market
countries. The MSCI All Country World ex U.S. Index is a broad-based securities market index that captures over two thousand primarily large- and mid-cap companies across 22 developed and 24 emerging market countries.
The MSCI All Country World Index and the MSCI All Country World ex U.S. Index are different from the strategy in a number of material respects, including being much more diversified among companies and countries,
having less exposure to emerging market and small-cap companies, having no exposure to frontier markets and having no ability to invest in fixed income or derivative securities.
39Global All-Cap – Model Portfolio Characteristics (as of 3/31/2019)
Portfolio Sector Weights* Top Ten Holdings
30
Name Country Port Weight %
25 Cameco Corp Canada 4.50
Newcrest Mining Ltd Australia 4.50
20 KT Corp South Korea 4.25
Range Resources Corp United States 4.00
15 Gazprom PJSC Russia 4.00
Turquoise Hill Resources Ltd Canada 3.75
10
RusHydro PJSC Russia 3.25
5
Electricite de France SA France 3.00
Centerra Gold Inc Canada 3.00
0 Golden Agri-Resources Ltd Singapore 3.00
Comm. Cons. Cons. Energy Financials Health Industrials Info. Materials Real Utilities
Services Disc. Staples Care Tech. Estate
Portfolio Region Weights* Portfolio Characteristics
60
Portfolio % MSCI ACWI %
50 Large-Cap** 27.5 90.0
40 Mid-Cap** 33.9 9.9
Small-Cap** 31.4 0.1
30
20 Developed Markets 56.5 88.3
10
Emerging Markets 37.3 11.7
0 U.S. 5.8 55.0
Canada Emerging Markets Europe Japan Pacific ex Japan US
Non U.S. 88.0 45.0
*Does not include Options, which were approximately 1.00% of the portfolio as of March 31, 2019. Excludes non-equity securities
**Small-Cap = less than $2 billion, Mid-Cap = $2 billion - $10 billion, Large-Cap = greater than $10 billion
Portfolio weights and characteristics above are based on the holdings of a model portfolio as of March 31, 2019. Portfolio characteristics, sector and country designations are calculated using data from Bloomberg. The MSCI
All Country World Index is a broad-based securities market index that captures over two thousand primarily large- and mid-cap companies across 23 developed and 24 emerging market countries. The MSCI All Country World
Index is different from the strategy in a number of material respects, including being much more diversified among companies and countries, having less exposure to emerging market and small-cap companies, having no
exposure to frontier markets and having no ability to invest in fixed income or derivative securities.
40International – Model Portfolio Characteristics (as of 3/31/2019)
Portfolio Sector Weights* Top Ten Holdings
30
Name Country Port Weight %
25 Cameco Corp Canada 4.50
Newcrest Mining Ltd Australia 4.50
20 Wheaton Precious Metals Corp Canada 4.25
Gazprom PJSC Russia 4.00
15 Turquoise Hill Resources Ltd Canada 3.50
KT Corp South Korea 2.50
10
Sberbank of Russia PJSC Russia 2.50
5
Golden Agri-Resources Ltd Singapore 2.25
Lenta Ltd Russia 2.25
0 Polyus PJSC Russia 2.25
Comm. Cons. Cons. Energy Financials Health Industrials Info. Materials Real Utilities
Services Disc. Staples Care Tech. Estate
Portfolio Region Weights* Portfolio Characteristics
60
Portfolio % MSCI ACWI ex US %
50 Large-Cap** 24.6 82.4
40 Mid-Cap** 27.8 17.3
Small-Cap** 13.9 0.3
30
20 Developed Markets 33.5 73.9
10
Emerging Markets 32.8 26.1
0 U.S. 2.3 -
Canada Emerging Markets Europe Japan Pacific ex Japan US
Non U.S. 64.0 100.0
*Does not include Options, which were less than 1.00% of the portfolio as of March 31, 2019. Excludes non-equity securities
**Small-Cap = less than $2 billion, Mid-Cap = $2 billion - $10 billion, Large-Cap = greater than $10 billion
Portfolio weights and characteristics above are based on the holdings of a model portfolio as of March 31, 2019. Portfolio characteristics, sector and country designations are calculated using data from Bloomberg. Harmonic
weighted average is a method of calculating an average value that lessens the impact of large outliers. The MSCI All Country World ex U.S. Index is a broad-based securities market index that captures over two thousand
primarily large- and mid-cap companies across 22 developed and 24 emerging market countries. The MSCI All Country World Index ex U.S. is different from the strategy in a number of material respects, including being much
more diversified among companies and countries, having less exposure to emerging market and small-cap companies, having no exposure to frontier markets and having no ability to invest in fixed income or derivative securities.
41This “Return on patience”
should prove unusually high
Potential Upside
Year 50.0% 100.0% 150.0%
1 50.0% 100.0% 150.0%
2 22.5% 41.2% 58.1%
3 14.5% 26.0% 35.7%
Internal Rate of Return
4 10.7% 18.9% 25.7%
5 8.5% 14.9% 20.1%
6 7.0% 12.3% 16.5%
7 6.0% 10.4% 14.0%
8 5.2% 9.1% 12.1%
9 4.6% 8.0% 10.7%
10 4.1% 7.2% 9.6%THANK YOU
The “Return on Patience” Appears Exceptionally High!
“In the short run, the market is a voting machine but in the long “I think the record shows the advantage of a peculiar mind-set –
run, it is a weighing machine.” not seeking action for its own sake, but instead combining
-Benjamin Graham extreme patience with extreme decisiveness”
“Patient opportunism – waiting for bargains – is often your best -Charlie Munger
strategy”
–Howard Marks
“The big profits go to the intelligent, careful and patient investor,
"[There] is the need for patience if big profits are to be made from not to the reckless and overeager speculator”
investment. Put another way, it is often easier to tell what will -J. Paul Getty
happen to the price of a stock than how much time will elapse
before it happens" “Patience can produce uncommon profits”
-Phil Fisher -Philip L. Carret
“Why is it that it takes a real bear market to get analysts interested in the value approach?”
-Benjamin Graham
Q&A SessionYou can also read