OCBC October Trading Spotlight - 4 October 2017 - Manulife US REIT
←
→
Page content transcription
If your browser does not render page correctly, please read the page content below
OCBC October Trading Spotlight
         4 October 2017
Important Notice
This presentation is for information purposes only and does not constitute or form part of an offer, invitation or solicitation of any offer
to purchase or subscribe for any securities of Manulife US REIT in Singapore or any other jurisdiction nor should it or any part of it
form the basis of, or be relied upon in connection with, any contract or commitment whatsoever. The value of units in Manulife US
REIT (“Units”) and the income derived from them may fall as well as rise. The Units are not obligations of, deposits in, or guaranteed
by the Manager, DBS Trustee Limited (as trustee of Manulife US REIT) or any of their respective affiliates. The past performance of
Manulife US REIT is not necessarily indicative of the future performance of Manulife US REIT.

This presentation may contain forward-looking statements that involve risks and uncertainties. Actual future performance, outcomes
and results may differ materially from those expressed in forward-looking statements as a result of a number of risks, uncertainties
and assumptions. These forward-looking statements speak only as at the date of this presentation. No assurance can be given that
future events will occur, that projections will be achieved, or that assumptions are correct. Representative examples of these factors
include (without limitation) general industry and economic conditions, interest rate trends, cost of capital and capital availability,
competition from similar developments, shifts in expected levels of office rental revenue, changes in operating expenses, property
expenses, governmental and public policy changes and the continued availability of financing in the amounts and the terms
necessary to support future business.

Investors are cautioned not to place undue reliance on these forward-looking statements, which are based on current view of
management on future events.

Holders of Units (“Unitholders”) have no right to request that the Manager redeem or purchase their Units while the Units are listed.
It is intended that Unitholders may only deal in their Units through trading on Singapore Exchange Securities Trading Limited (the
“SGX-ST”). Listing of the Units on the SGX-ST does not guarantee a liquid market for the Units.

DBS Bank Ltd. was the Sole Financial Adviser and Issue Manager for the initial public offering of Manulife US Real Estate
Investment Trust (“Offering”). DBS Bank Ltd., China International Capital Corporation (Singapore) Pte. Limited, Credit Suisse
(Singapore) Limited and Deutsche Bank AG, Singapore Branch were the Joint Bookrunners and Underwriters for the Offering.

                                                                                                                                               2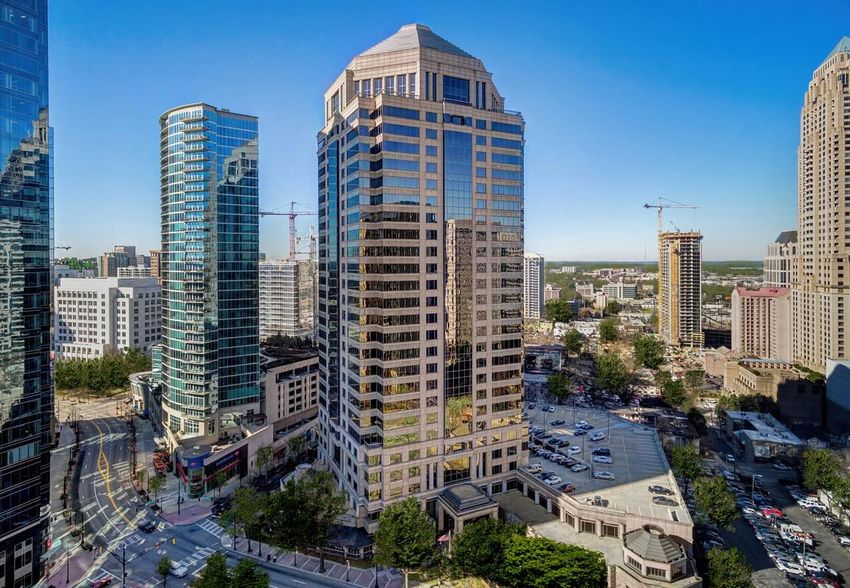
Contents

 1   Overview and Key Highlights

 2   Portfolio Performance

 3   Financial Highlights

 4   Moving Forward

                                   3
Peachtree, Atlanta, Georgia

Overview and Key Highlights

Reputable Sponsor
   Proven Property Management Track Record
             Vertically-Integrated Real Estate Platform: Global Real Estate AUM of US$16.6b
                                                      Vancouver
Sponsor                                                  Calgary           Kitchener/Waterloo

                                                           Edmonton
                                                                            Toronto            Canada
                                                                                 Ottawa        US$6.7B
                                                                                  Montreal
                                                                                                  AUM

             AUM                                                                     Halifax             74% of Real Estate in Office
            US$780B                                          U.S.                                                                                 Asia
                                                         US$8.2B                                                  Others Retail                  US$1.7B
                                                              AUM                                                  4%                              AUM
                                                                                                                          5%
                                                                                                                              Residential
      Manulife Asset Mgt                                                                                                         7%                                    Tokyo, Japan
       Private Markets
                                                                                                                                 Industrial              Hong Kong, China
                                                                                  Boston
                                                         San Diego                                                                 10%
                                                        Los Angeles              New York Metro                                                                           Singapore1
                AUM
                                                       San Francisco        Washington D.C.             Office
              US$87.9B                                                                                  74%                                           Ho Chi Minh City, Vietnam
                                                                         Orlando
                                                                                                                                                    Kuala Lumpur, Malaysia
                                                                        Atlanta
                                                                                                                                                   Bangkok, Thailand
                                                                       Chicago
      Global Real Estate
                                                              More than 80                                     Over 600                       John Hancock AUM of
          AUMAUM                                                years of                                      real estate                      US$8.2b and strong
         US$15B
           US$16.6B                                           experience in                              professionals in 23                    leasing network of
                                                               real estate                                 offices globally                       >1,000 tenants
Note: All AUM in fair value basis as at 30 Jun 2017
  (1) Acquired 8 Cross Street on 11 Apr 2017

                                                                                                                                                                                       5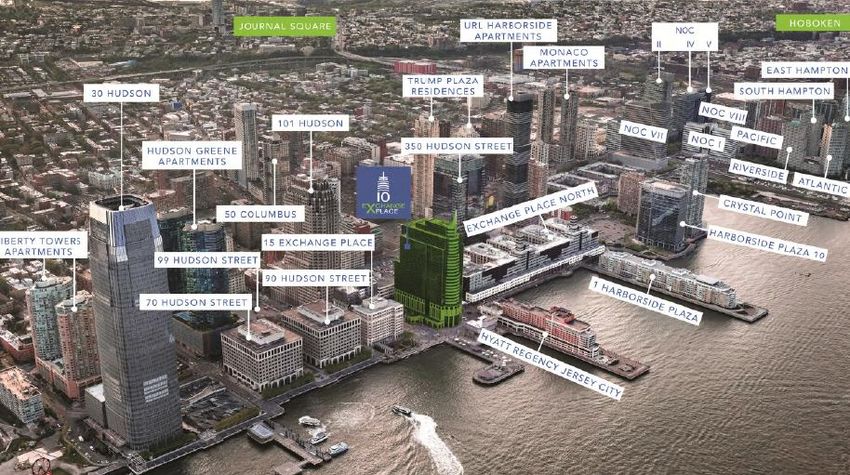
Expand Manulife US REIT’s Footprint in U.S.

                                                                                                                              Jersey City,
                                                                                                                              New Jersey

                                                                                                                                             Secaucus

                                                                                                        Exchange
           Figueroa                                                                                                                                     Plaza
                                                                Los Angeles                             NLA: 730,598 sq ft
           NLA: 699,372 sq ft                                                                                                                           NLA: 461,725 sq ft
                                                                                                        Value3: US$333.0m
           Value1: US$325.0m                                             Irvine                                                                         Value2: US$116.0m
                                                                                                                                  Atlanta

                                                                                              Enlarged Portfolio4
                                                                                  Total NLA            : 2,980,220 sq ft
                                                                                  Valuation            : US$1,306.5 million
           Michelson                                                                                                                                    Peachtree
           NLA: 532,603 sq ft                                                     WALE (by NLA)        : 5.9 years                                      NLA: 555,922 sq ft
           Value1: US$342.0m                                                      Occupancy            : 95.8%                                          Value1: US$190.5m

(1)   Based on 30 Jun 2017 appraised values                                       Land Tenure          : 100% freehold
(2)   Based on independent valuation by Cushman & Wakefield as at 2 Jun 2017
(3)   Based on the average of the independent valuations by RERC and Colliers
      as at 11 Jul 2017 and 18 Jul 2017 respectively                              No. of Tenants       : 102
(4)   As at 31 Jul 2017, assuming acquisition of Exchange has been completed

                                                                                                                                                                             6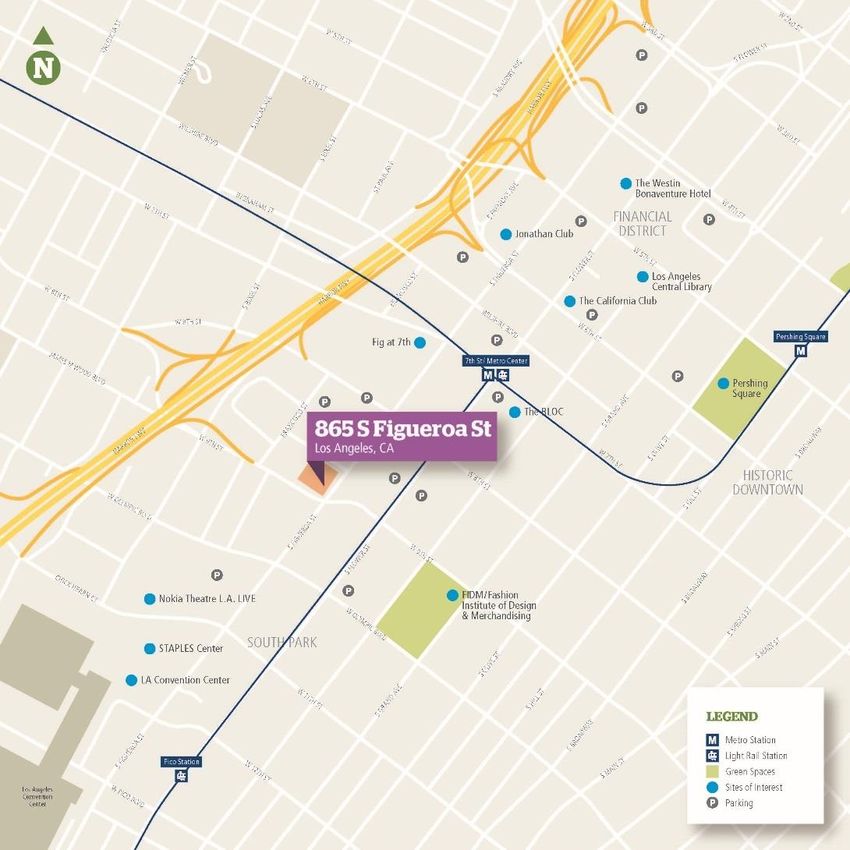
Peachtree,Jersey
Exchange, Atlanta,City,
                   Georgia
                        New Jersey

 Portfolio Performance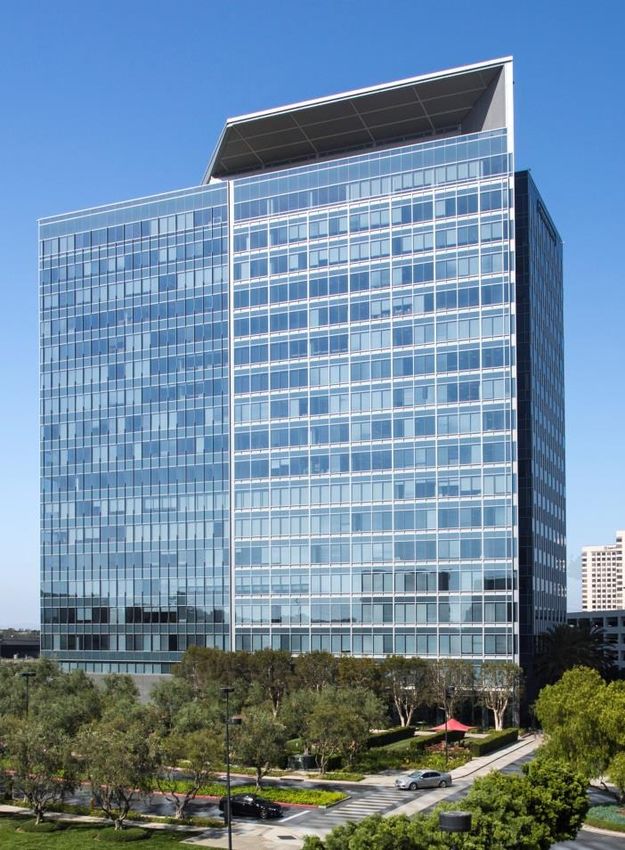
Strategically Located in Key U.S. Cities
                                                                      Portfolio Markets Progressing Steadily

Rental Cycle, CBD U.S. Markets 1                                                                            Rental Cycle, Suburban U.S. Markets 1

(1)   Source: JLL as at 2Q 2017. Retrieved from http://www.us.jll.com/united-states/en-us/research/office

                                                                                                                                                    8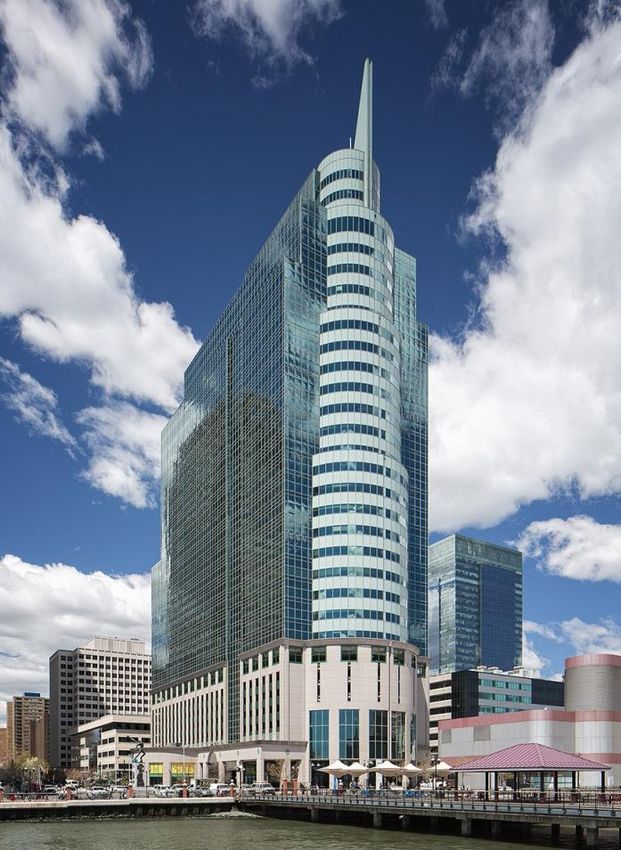
Occupancy and WALE
                            WALE of 5.9 years by NLA and Committed Occupancy of 95.8%

Lease Expiry Profile of the Portfolio1,2 (%)

                                                                                                                                           68.5%
                                                                                                                                   66.2%

                                                                            12.1%                      10.5% 10.5%
                                                                                       9.4%
                                                                                                                     6.8%   7.1%
      3.3%      3.3%
                                          1.2% 1.2%
           2017                                2018                                  2019                   2020        2021       2022 and beyond

                                                        Cash Rental Income                    Net Lettable Area

(1)   As at 31 July 2017, assuming that acquisition of Exchange has been completed
(2)   Includes committed lease space and rental income

                                                                                                                                                     9
Expand Tenant Base
IPO Portfolio Cash Rental Income by Trade Sector1 Enlarged Portfolio Cash Rental Income by Trade Sector1
Transportation
Business
Services, 2.7% Administrative
&
Administrative Services, 2.3% warehousing,
Engineers/Archite 2.3%
Business Engineers/Architec
Services, 2.7% cts, 2.5%
Services, 2.5% ts, 1.6%
Advertising & Advertising
Public Relations, & Public Relations,
3.9% Law Firms, 44.0% 3.2%
Real Estate, 3.5%
Law Firms, 27.8%
Real Estate, 5.6% Medical &
Diagnostics,
4.0%
Arts &
Others, 6.4% Entertainment,
4.2%
Arts & Others, 6.3%
Entertainment,
6.6%
Professional &
technical
services, 9.4%
Financial
Institutions, 22.9%
Financial Retail Trade,
Institutions, 25.6%
10.0%
Improve tenant diversification since IPO Portfolio
Four new trade sectors added: (1) Transportation & Warehousing (2) Professional &
Technical Services (3) Retail Trade (4) Medical & Diagnostics
Percentage of law firms decreased from 44.0% to 27.8%
(1) As at 31 Jul 2017, assuming that acquisition of Exchange has been completed
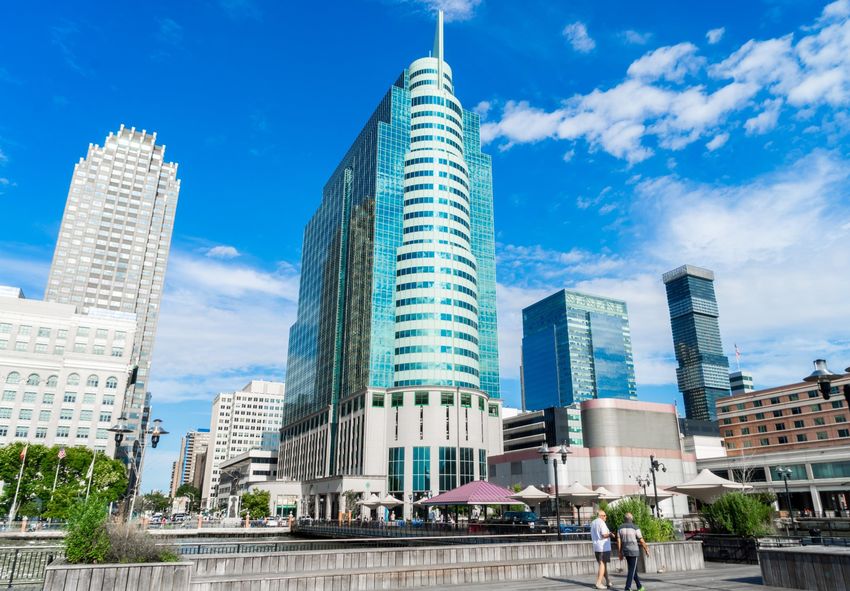
10Figueroa: Located in the Heart of Downtown LA (DTLA)
Influx of Millennials has Transformed DTLA into a Live, Work, Play Destination
As at 31 Jul 2017
NLA 699,372 sq ft
Property Value US$325.0 m1
Occupancy Rate 95.3%
WALE (by NLA) 5.2 years
(1) Based on 30 Jun 2017 appraised values
11Figueroa: No New Class A Office Space in Past 23 Years and
None Until 2017
Excellent Location and Amenities
Located in the South Park submarket
Excellent access to the LA freeway system
Close proximity to 7th Street Metro Station
Free shuttle to surrounding areas of Downtown
LA
Entertainment venues: Staples Center, the Figueroa
LA Convention Center and LA Live
High parking ratio of 1.22 spaces per 1,000 sq Nokia Theatre
ft compared to market average of 1.0 space per L.A. LIVE
Staples
1,000 sq ft Center
LA Convention
Center
12Michelson: State-of-the-Art Trophy Building
Irvine – Abundant Amenities Available in the Vicinity
As at 31 Jul 2017
NLA 532,603 sq ft
Property Value US$342.0 m1
Occupancy Rate 98.4%
WALE (by NLA) 4.8 years
(1) Based on 30 Jun 2017 appraised values
13Michelson: Best Building in a Highly Amenitised Office Park
Excellent Location and Amenities
Near the 405 San Diego freeway
4 km away from international airport, John Wayne Airport
Surrounded by hotel developments, high-end condominiums and
apartments, restaurants and a wide range of retail offerings
Above average parking ratio of 5.1 spaces per 1,000 sq ft
Michelson
John Wayne
Airport Park Place -
World Class Mixed-Use
Office Campus
14Peachtree: Prominent Building in International Gateway
Market
Atlanta – Headquarters for 18 Fortune 500 firms including
Coca Cola, Delta Air Lines, Home Depot and UPS
As at 31 Jul 2017
NLA 555,922 sq ft
Property Value US$190.5 m1
Occupancy Rate 95.1%
WALE (by NLA) 5.8 Years
(1) Based on 30 Jun 2017 appraised values
15Peachtree: Located in Atlanta; World’s Busiest Airport
(Hartsfield-Jackson International)
Excellent Location and Amenities
Easily accessible to business district
via two freeways – Interstate 75 and
Interstate 85
Close proximity to Midtown and
Arts Center Metro Stations
20 minutes from Atlanta Hartsfield-
Jackson International Airport –
the busiest airport in the world
Located along “Midtown Mile” – stretch of
mixed-used office, retail and multi-family
properties
Surrounded by high-end condominiums,
luxury apartments and numerous dining
options
16Plaza: Best-In-Class Asset Located in Secaucus
Excellent Regional Connectivity via Public Transportation and Interstate Highways
As at 31 Jul 2017
NLA 461,725 sq ft
Property Value US$116.0 m1
Occupancy Rate 98.9%
WALE (by NLA) 8.7 years
(1) Based on independent valuation by Cushman & Wakefield as at 2 Jun 2017
17Plaza: “Live, Work and Play” Amenities Rich Neighbourhood
Located within 550-acre Mixed-Use Amenity Base of Harmon Meadow in Secaucus
Excellent Location and Amenities
Located in Secaucus, Northern New Jersey within
Hudson County office market and Meadowlands office
submarket
3 miles from Manhattan, New York City via Lincoln
Tunnel with easy accessibility to the interstate highways
Less than 10 miles from Newark Liberty International
Airport
Direct connectivity to Midtown Manhattan via New
Jersey Transit bus and shuttle service to Secaucus
Junction Train Station
Surrounded by 1 million sq ft of retail space –
25 restaurants, 7 hotels, leisure and sports facilities, a
cinema, with a hotel and residential apartments under
construction
High parking ratio of 3.2 spaces per 1,000 sq ft
18Exchange: High-Quality Waterfront Property Located in
Jersey City
Excellent Transport Connectivity to New York City
As at 31 Jul 2017
NLA 730,598 sq ft
Property Value US$ 333.0 m1
Occupancy Rate 93.1%
WALE (by NLA) 5.7 years
(1) Based on the average of the independent valuations by Colliers and RERC as at 18 Jul 2017 and 11 Jul 2017 respectively
19Exchange: Exposure to Prime Office Submarket Minutes
from NYC
10 minutes by Train and Ferry, 20 minutes by Car to NYC
Excellent Location and Amenities
Spectacular view of Manhattan, NYC skyline
Highly desirable for residential environment - “Live, work,
play”
Strategically located with outstanding transportation links
through interstate highways and three major airports,
Newark, LaGuardia and John F. Kennedy
Cheap alternative to Manhattan, attracting global
institutions: Goldman Sachs, JPMorgan Chase, UBS,
Bank of America Merrill Lynch
24 hour round-the-clock amenities
20Office Market Overview
Limited New Supply and Strong Rental Growth in 2017
New
12 Month
RBA1 Gross Net Properties
Vacancy1 Rent Property Delivery
Market (mil sq Asking Absorption1 Under
(%) Growth2 Name Year
ft) Rent1 (‘000 sq ft) Construction
(%)
(‘000 sq ft)
Downtown Los Office Plaza at
39.6 15.6 US$42.89 (146) 6.1 370 2017
Angeles Wilshire Grand
Irvine,
13.7 12.7 US$34.25 (5) 3.6 537 The Boardwalk 2017
Orange County
NCR Corp
485 2018
Headquarters
Midtown Atlanta 17.8 10.7 US$32.95 152 4.7
760 Coda 2019
500 Building 54 2018
Meadowlands3 3.7 22.54 US$31.82 (66) (0.7)
250 Building 100 2018
Hudson
19.4 11.2 US$41.22 154 0.5 0 N/A N/A
Waterfront5
(1) Rentable building area- Class A inventory
(2) All building classes
(3) Secaucus is within the Meadowlands submarket
(4) Vacancy and availability include old and uncomparable buildings. Plaza’s competitive set has vacancy rate of only 6%. New construction is not comparative to Plaza
(5) Jersey City is within the Hudson Waterfront submarket
Source: CoStar Market Analysis & Forecast – Q2 2017
21Plaza, Secaucus, New Jersey Financial Highlights
Debt Maturity Profile post Acquisitions
                                                 100% Fixed Rate Loans with No Near-term Refinancing

    US$ m
200.0                                                                                                                                                           Enlarged Portfolio2

                                                                                               161.6

150.0
                                                                   121.0
                                                                                                                                          Gearing Ratio3                                              34.5%
                  108.0                                          Michelson
                Figueroa

                                                                                                           121.6
100.0
                                                                                                           Exchange1
                                          67.0                                                                                            Weighted Average
                                        Peachtree                                                                                                                                                     2.84% p.a.
                                                                                                                                          Interest Rate
 50.0

                                                                                                            40.0
                                                                                                            Plaza                         Weighted Average
                                                                                                                                                                                                      3.9 years
  0.0                                                                                                                                     Debt Maturity4
                   2019                     2020                      2021                      2022
  (1)   Assuming debt funding of US$121.6 million to part finance the acquisition of Exchange. The final decision regarding the amount of financing to be employed for the purpose of financing the Acquisition will be made by the
        Manager at the appropriate time, taking into account the then prevailing market conditions and interest rate environment, availability of alternative funding options, the impact of Manulife US REIT’s capital structure DPU
        and debt expiry profile and the covenants and requirements associated with each financing option
  (2)   As at 30 Jun 2017, assuming acquisitions of Plaza and Exchange have been completed
  (3)   Based on gross borrowings as percentage of total assets post 10 Exchange acquisition
  (4)   Based on total facility debt maturity

                                                                                                                                                                                                                                        23
Exchange, Jersey City, New Jersey Moving Forward
Key Milestones since IPO

                                 3Q2016                                FY2016                     1Q2017                                    1H2017
                                                                                                                     Announced                 Results       Announced
                                   Results                               Results                    Results
                                                                                                                       maiden                                acquisition
Listed on SGX on                   7 Nov 2016                          13 Feb 2017                 2 May 2017       acquisition of          8 Aug 2017           of
   20 May 2016                   DPU exceeded                         DPU exceeded               DPU exceeded           Plaza             DPU exceeded        Exchange
                                forecast by 5.8%                     forecast by 4.8%          projection by 8.6%    US$115.0m           projection by 8%    US$313.2m

                                2016                                                                                 2017
   May            Sep                 Nov             Dec                    Feb         Mar              May         Jun                Jul          Aug       Sep

     Awarded runner-up in the New  Awarded Best REIT Deal of      Included in the      Included in the          Ranked 11th among    Awarded Best Annual
      Issues Category of the Most   the Year and Best IPO for    MSCI Singapore          GPR/APREA                 43 REITs and      Report for First-Year
    Transparent Company Award at Retail Investors in Southeast   Small Cap Index    Investable REIT 100         Business Trusts in   Listed Companies at
      SIAS’ 17th Investors’ Choice   Asia by Alpha Southeast                                Index                the Governance         the Singapore
                 Awards               Asia’s Deal & Solution                                                     Index for Trusts     Corporate Awards
                                           Awards 2016                                                                 2017                  2017

                                                                                                                                                                      25
Peachtree, Atlanta, Georgia
Market Cap Increased by 81.4% since IPO
Increase in Free Float Trading Liquidity
81.4% 33.7%
Free Float
US$519.2m1 US$704.4m2 US$941.8m3
(S$704.9m)4 (S$956.3 m)4 (S$1,278.6 m)4 Sponsor Stake
Market Cap Market Cap Market Cap
During IPO Pre-Acquisition Post-Acquisition
(1) Based on 625.5 million Units in issue and the issue price of US$0.83 per Unit during IPO
(2) Based on 730.0 million Units in issue and unit price of US$0.965 per Unit as at 31 Aug 2017
(3) Based on 730.0 million Units in issue and approximately 299.3 million new Units to be issued in connection with the Acquisition and unit price of US$0.915 per Unit as at 29 Sep 2017
(4) Based on an exchange rate of 1 USD : 1.3576 SGD as at 29 Sep 2017
26Moving Forward
Consistent with Manulife US REIT’s Long Term Strategy
• Inorganic: Grow through yield-accretive
acquisitions
Growth
• Organic: Increase Gross Revenue and NPI
while maintaining optimal occupancy levels
Long Term
Strategy: Sponsor • Ability to tap Sponsor’s pipeline
Sustainable Commitment
Growth
Capital • Appropriate mix of debt and equity optimising
Management risk-adjusted returns to Unitholders
27Hudson River
Thank You
For enquiries, please contact: Ms Caroline Fong, Head of Investor Relations
Direct: (65) 6801 1066 / Email: carol_fong@manulifeusreit.sg
http://www.manulifeusreit.sgPortfolio Overview
Figueroa Michelson Peachtree Plaza Exchange
Location Los Angeles Irvine Atlanta Secaucus Jersey City
Property Type Class A Trophy Class A Class A Class A
Completion Date 1991 2007 1991 1985 1988
Last Refurbishment 2015 - 2015 2016 -
Property Value 325.01 342.01 190.51 116.02 333.03
Occupancy4 (%) 95.3% 98.4% 95.1% 98.9 93.1
NLA (sq ft) 699,372 532,603 555,922 461,725 730,598
WALE4 (by NLA) 5.2 years 4.8 years 5.8 years 8.7 years 5.7 years
Land Tenure Freehold Freehold Freehold Freehold Freehold
No. of Tenants4 30 15 25 7 25
(1) Based on 30 Jun 2017 appraised values
(2) Based on independent valuation by Cushman & Wakefield as at 2 Jun 2017
(3) Based on the average of the independent valuations by Colliers and RERC as at 18 Jul 2017 and 11 Jul 2017 respectively
(4) As at 31 Jul 2017
291H 2017 DPU Exceeded Projection1 by 8.0%
2Q 2017 2Q 2017 2Q 2017 1H 2017 1H 2017 1H 2017
Actual Projection1 Change Actual Projection1 Change
(US$’000) (US$’000) (%) (US$’000) (US$’000) (%)
Gross Revenue2 19,906 19,970 (0.3) 39,739 40,060 (0.8)
• Rental and Other Income 14,721 14,459 1.8 29,384 28,972 1.4
• Recovery Revenue 5,185 5,511 (5.9) 10,355 11,088 (6.6)
Property Operating
(7,117) (7,633) (6.8) (14,187) (15,292) (7.2)
Expenses
Net Property Income 12,789 12,337 3.7 25,552 24,768 3.2
Net Income3 21,245 7,434 >100 29,750 15,191 95.8
Distributable Income 9,987 9,346 6.9 20,400 19,049 7.1
Distribution per Unit
1.58 1.47 7.5 3.23 2.99 8.0
(cents)
(1) The Prospectus disclosed a profit forecast for 2017. Forecast results for the financial period from 1 Apr 2017 to 30 Jun 2017 (2Q 2017) and from 1 Jan 2017 to 30 Jun 2017 (1H 2017) were derived by pro-rating the
forecast figures for 2017 as disclosed in the Prospectus
(2) The gross revenue was below forecast due to lower recovery revenues. Recovery revenues from tenants are recognised when applicable recoverable property operating expenses are incurred. Since the recoverable
property operating expenses were lower than forecast, the recovery revenues were also lower
(3) Net Income is higher than forecast largely due to fair value gains of US$20.2 million for 2Q 2017 and US$19.6 million for 1H 2017 recognised in income
30
30Financial Effects of Rights Issue
Accretive Acquisition of Exchange Improves DPU Yield
Pro Forma FY2016
After acquisition of Plaza
FY2016 Audited After acquisition of Plaza
(and 2017 Private
(and 2017 Private
Placement), the Rights
Placement)
Issue and the Acquisition
Distributable Income
22.3 26.4 35.1
(US$ m)
DPU Yield (%) 5.961 6.10 1 6.23 2
NAV (US$ m) 547.0 624.0 827.5
NAV per Unit (US$) 0.87 0.86 0.80
(1) Based on Closing price of US$0.965 as at 31 Aug 2017
(2) Based on TERP of US$0.886
Refer to the announcement dated 2 Sep 2017 for details of the pro forma financial effects of the Acquisition and the Rights Issue
31Tax Efficient Structure of Manulife US REIT
Sponsor
Unitholders
No 30%1 withholding tax on interest and principal on Manulife
shareholder’s loan - US Portfolio Interest
Exemption Rule 0% Tax
Zero tax in Singapore - Foreign sourced income
not subject to tax
Distribution from US to Singapore through 100% 100% 100%
combination of dividends, and/or interest payments
Singapore Sub 1 Singapore Sub 2 Singapore Sub 3
and principal repayments on shareholder loans
Singapore
100% voting Shareholder Shareholder U.S.
shares loan loan
No single investor to hold more than 9.8% (including Dividends3 Interest & Principal (0% Tax)
the sponsor) - ‘Widely Held2’ rule for REITs in US Parent U.S. REIT
Manager will actively manage to minimise or pay no
dividends from Parent U.S. REIT to Singapore Sub 1 Sub-U.S. Sub-U.S. Sub-U.S. Sub-U.S.
REIT 1 REIT 2 REIT 3 REIT 4
(Figueroa) (Michelson) (Peachtree) (Plaza)
(1) For U.S. and non U.S. persons filing valid tax forms
(2) No less than 5 persons holding 50% of company
(3) Subject to 30% withholding tax
32You can also read