SPH Corporate Presentation - March 2020 - SGX
←
→
Page content transcription
If your browser does not render page correctly, please read the page content below
SPH Corporate
Presentation

March 2020
Disclaimer
This presentation is for information only and does not constitute an invitation or offer to acquire, purchase or
subscribe for shares in SPH (“Shares”). The value of shares and the income derived from them may fall as
well as rise. Shares are not obligations of, deposits in, or guaranteed by, SPH or any of its affiliates. An
investment in Shares is subject to investment risks, including the possible loss of the principal amount
invested. The past performance of SPH is not necessarily indicative of its future performance. This
presentation may also contain forward-looking statements that involve risks and uncertainties. Actual future
performance, outcomes and results may differ materially from those expressed in forward-looking statements
as a result of a number of risks, uncertainties and assumptions. Representative examples of these factors
include (without limitation) general industry and economic conditions, interest rate trends, cost of capital and
capital availability, competition from similar developments, shifts in expected levels of property rental income,
changes in operating expenses, including employee wages, benefits and training, property expenses and
governmental and public policy changes and the continued availability of financing in the amounts and the
terms necessary to support future business. You are cautioned not to place undue reliance on these forward-
looking statements, which are based on current view of management on future events. This presentation
shall be read in conjunction with SPH’s financial results for the quarter ended 30 November 2019 in the
SGXNET announcement.

                                                                                                                    2
Introduction
1Q FY2020 Key Highlights
1Q FY2020 Financial Highlights
Business Review
Media, Telecommunications, Technology
Property, Aged Care
Summary
Annexe
3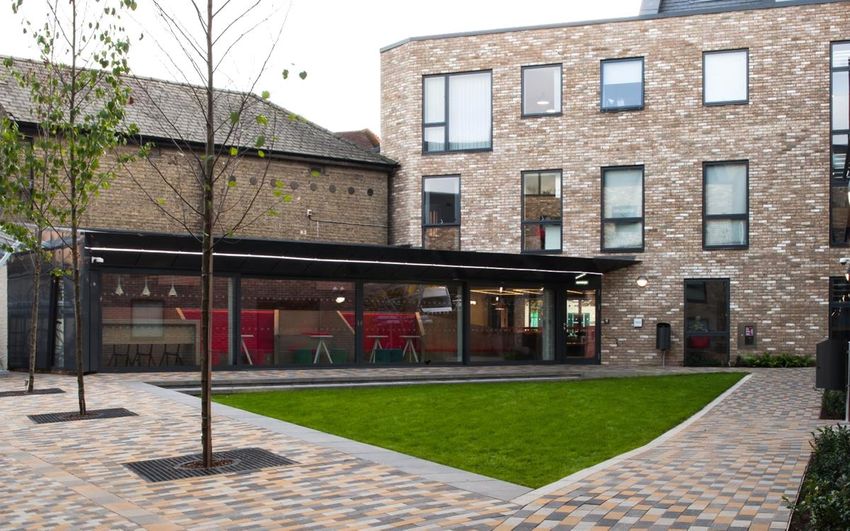
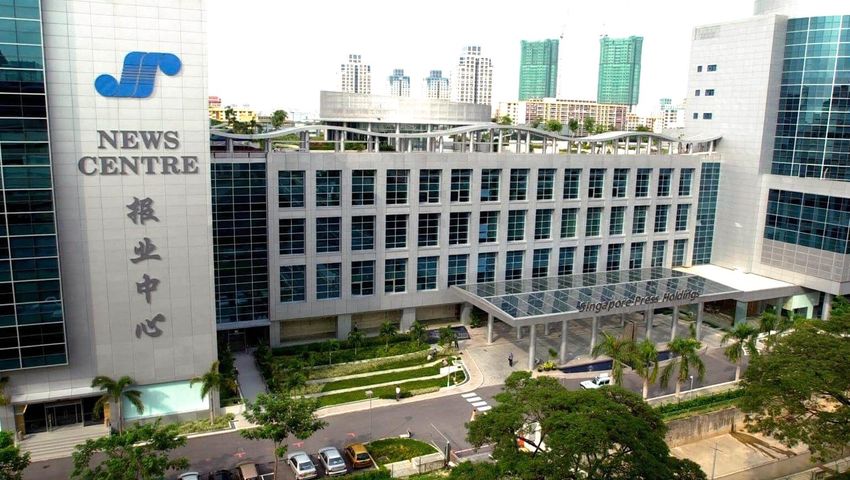
• Asia’s leading media organisation
Engaging minds and enriching lives across multiple languages and
platforms since 1984
Publishes newspapers, magazines and books in print and digital
editions; also has online classifieds, radio stations and outdoor
Investing in quality, award-winning journalism
Innovating digitally to transform media business to meet readers
and advertisers’ changing needs; including platforms such as
FastJobs, sgCarMart
Together with Keppel Corp, acquired M1 Limited in April 2019 to
leverage on synergies and explore new areas of growth
Using technology to transform newsrooms, print efficiently and
develop more digital content
4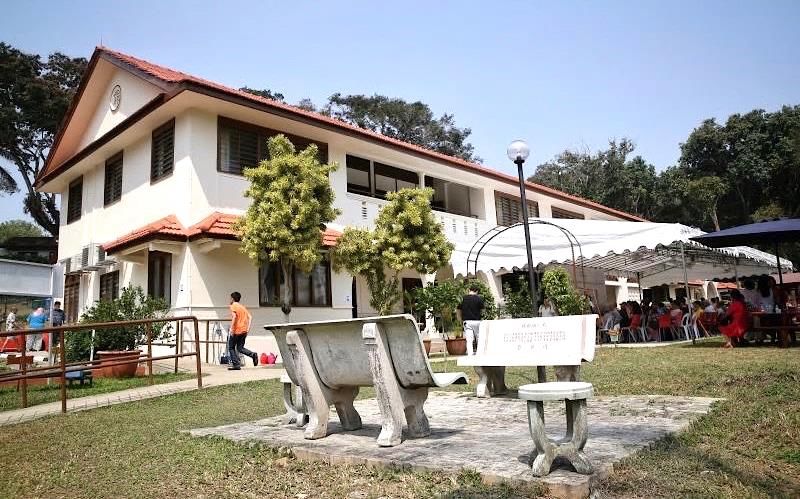
• Expanding PBSA portfolio and retail assets
Investing in defensive, cash yielding assets to grow recurring income
S$1.5 billion Purpose Built Student Accommodation (PBSA) portfolio, comprising
7,726 beds in 28 assets across 18 Cities in UK and Germany
65.9% stake in SPH REIT
70% stake and operator of Seletar Mall
Developing The Woodleigh Residences and The Woodleigh Mall together with
Kajima Development
• Leading player in Singapore’s aged care market with
overseas expansion
Orange Valley (OV) Nursing Homes, Singapore's largest private elderly nursing
operator with five nursing homes, over 900 beds
Partnership with Bridge C Capital to expand Aged Care business in Japan
5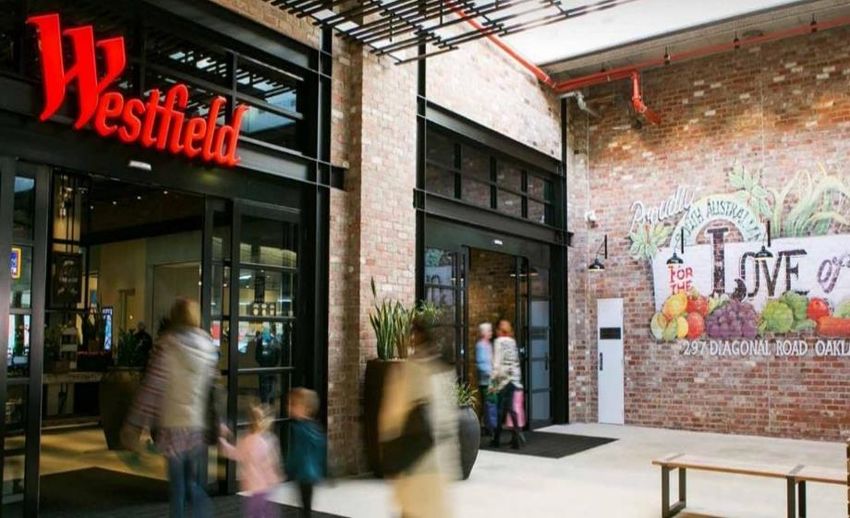
• Media: Digital transformation underway
8.1% rise in circulation volume with digital subscription
Post 1Q: ST News Tablet campaign gained 5.2k+ subscribers
• Property: Recurring income grew 10.1%
Post 1Q: SPH REIT added second mall in Australia, with 50%
stake in Westfield Marion Shopping Centre for A$670m
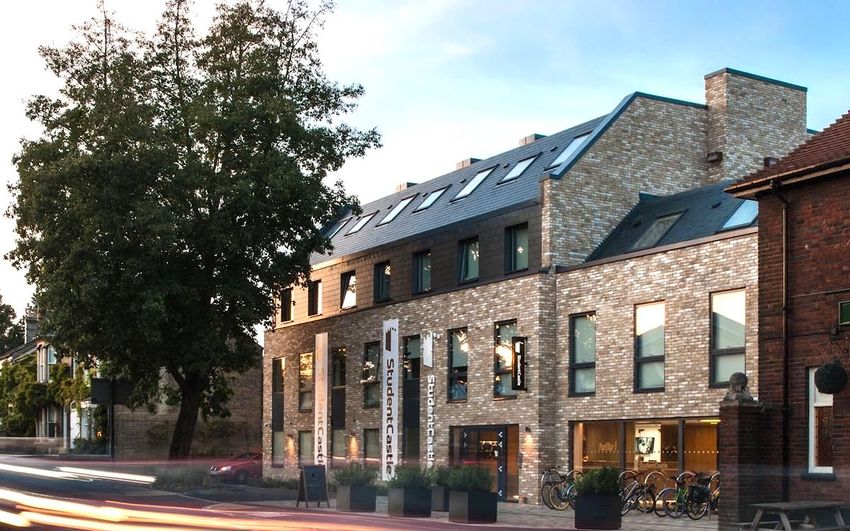
Post 1Q: Scaled student housing to S$1.5b with £448m UK deal,
acquiring 2,383 beds and premium Student Castle brand
• Capital: Strengthening the balance sheet
Boosted by S$300m perpetuals issuance & SPH REIT placement
proceeds of S$164.5m
6
1Q FY20 1Q FY19 Change Operating revenue down due to
S$’000 S$’000 % media decline, mitigated by higher
Operating revenue 243,983 254,316 (4.1)
revenue from property
Total Costs up 6.1%
Total Costs 195,073 183,914 6.1
Higher operating expenses from
enlarged PBSA portfolio and SPH REIT
Operating profit# 53,944 74,841 (27.9)
One-off retrenchment costs at the
FV change on investment prop. 10,527 - NM Media Segment of S$7.2m
Share of results of associates, JVs (762) (2,435) (68.7) S$10.5m FV gain on investment
property due to Mayflower student
Investment income 4,549 3,182 43.0 housing portfolio price adjustment
Share of results of associates boosted
Profit before taxation 68,258 75,588 (9.7)
by M1 contribution
Net profit attributable to
46,333 55,929 (17.2) Operating profit increasingly supported
shareholders
by recurring income from Property
# This represents the recurring earnings of the media, property and other businesses.
NM: Not Meaningful
7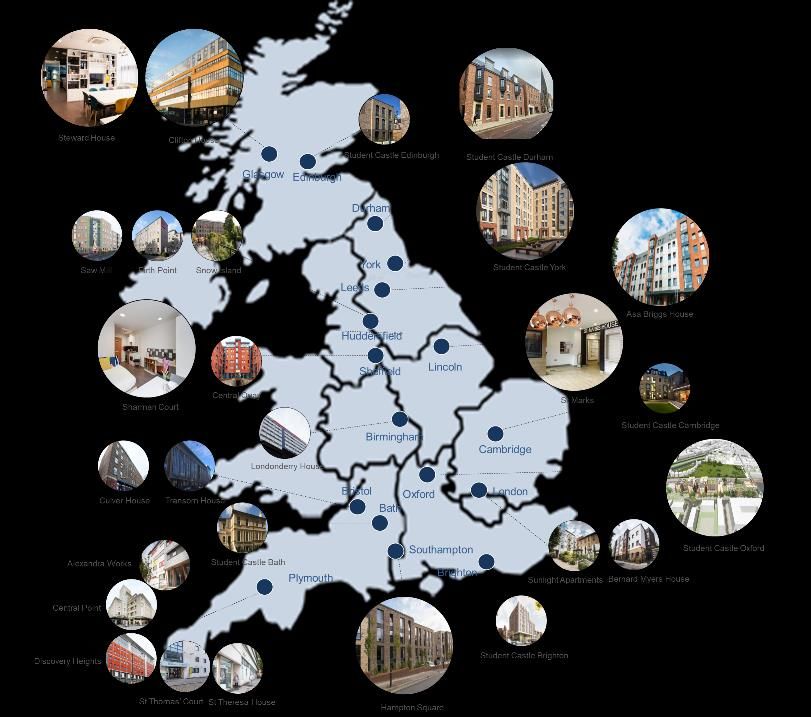
Property-related revenue set to rise with SPH REIT, Student Castle additions
 S$’m

         24.2                                                         23.0
         68.0
                                                                      80.9

         162.1                                                       140.1

        1Q FY19         Media         Property   Others incl. Aged   1Q FY20
                                                 Care, Exhibitions             8
S$’m

              3.5
                                     -17.6                                   5.8
                                     -7.2*
             39.8

                                                                            55.0

             32.3
                                                                             7.5
         1Q FY19                     Media   Property   Others incl Aged   1Q FY20
       *One-off retrenchment costs
                                                           Care, M1
                                                                                     9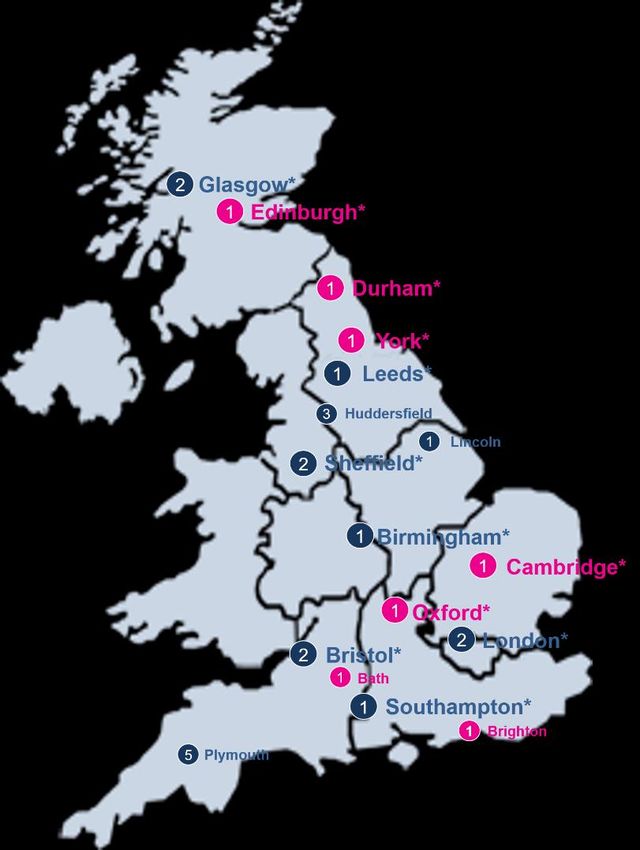
Media
Telecommunications
Technology

10 8.1% circulation growth, the first increase after 4 quarters The Straits Times News Tablet latest
Rise due to schools promotion, News Tablet campaign to launch on 18 Dec 2019
5.2k+ units snapped up as at 7 Jan
Daily Average Newspaper Circulation ’000 Follows on from success of Zaobao and
Berita Harian
800 450 160
1Q FY20 (Digital) • 12.2k subscribers for ZB news tablets by 7
700 400 140 1Q FY20 (Print)
1Q FY19 (Digital) Jan, 75% are new
350 1Q FY19 (Print)
600 120 • 1.3k subscribers for BH news tablets by 7
300
500 100 Jan, 86% are new
250
400 80
200
300 60
150
200 40
100
100 50 20
0 0 0
Total The Straits The Lianhe Lianhe Shin Min Berita Tamil
Times/ The Business Zaobao Wanbao Harian/ Murasu/
Times Berita Tamil
Sunday
Minggu Murasu
Times Sunday
11S$’m Quarterly Digital Ad Revenue* Digital ad revenue shows an 11.6%
17 11.6% CAGR CAGR since 1Q FY2018
15
Newspaper digital ad revenue growing
13
steadily at 8.8% y-o-y
11
16.2
9 13.0
14.6 1Q FY20 5.9% growth q-o-q
7
5
1Q FY18 1Q FY19 1Q FY20
S$’m Annual Digital Ad Revenue*
16 Total: S$55.9m Total: S$58.4m
14
12
10
8
14.8 15.3 16.2
14.3 13.8 14.6 14.5 14.0
6 13.0
4
2
0
1Q FY18 2Q FY18 3Q FY18 4Q FY18 1Q FY19 2Q FY19 3Q FY19 4Q FY19 1Q FY20
*Total digital ad revenue from ads, online classifieds, magazines and other digital
portals (excluding ShareInvestor) 12S$’m Quarterly Digital Revenue* Faster digital revenue growth at
13.6% CAGR
30 13.6% CAGR
1Q FY20’s digital revenue grew 18.9% vs
1Q FY19
20
29.6
24.9
10 20.2 21.3
0
1Q FY17 1Q FY18 1Q FY19 1QFY20
*Total digital revenue from circulation, ads, online classifieds, magazines and other
digital portals (excluding Shareinvestor)
13Leveraging Zaobao Radio listenership up* Quality Journalism
brand to build
Total listenership up 10% 7 awards at Asian Digital
overseas audience
Media Awards 2019
Singapore-China forum in Share of audience up 13%
Nov 2019, first time held
overseas, in Shanghai
(*Based on half yearly Nielsen Radio Diary Survey)
145.0%
% Y-o-Y Change in Print Ad Revenue Revamped ZB Classified
0.0%
Expanded options for advertisers
e.g. editorial
-5.0%
Display Overall Classified decline slowed to
Classified* 15.4% y-o-y
Newspaper
-10.0% Ad
-11.1%
Expanding outdoor business
-15.0% -14.5%
Latest screen One Raffles Place
-14.9%
-15.8%
-15.4% offers largest digital ad inventory in
-17.5% Raffles Place
-18.4%
-19.0%
-20.0% -19.8%
-20.4%
-21.5%
Innovative campaign for Fiji Tourism
-22.6% Board at Ocean Financial Centre with
-25.0% ‘happiness meter’ to draw eyeballs
2Q FY19 3Q FY19 4Q FY19 1Q FY20
* Classified includes Recruitment and Notices
15Qoo10 merged with India’s Target Media seals key HDB tender
ShopClues in Nov 2019
Won tender to supply 6k digital display
Access to fast-growing Indian market via screens to HDB estates by June 2020
ShopClues platform
75% increase in number of screens to 14k
ShopClues is major online player, selling
electronics and lifestyle items across India
16Property
17SPH REIT SPH REIT
Sustained expansion
Explore opportunities in
Asia-Pacific
PBSA
Growth of portfolio
Paragon Clementi Mall The Rail Mall Figtree Grove Westfield Marion Gained premium brand
S$2.75b S$597m S$63.8m (85%) (50%)
A$175m A$670m Developing operating
capabilities
Continue seeking out
cash-yielding
investments in
defensive sectors to
grow recurring income
base
The Seletar Mall Woodleigh Mall and German Student UK Student
(70%) Residences Accommodation Accommodation
S$347m (50%) (100%) (100%)
S$400m S$23.4m >S$1.5b 18£448m Student Castle deal to add S$22.6m PBT (proforma)
Nov 2019
Feb 2019
116 beds | 1 asset
284 beds | 1 asset PBSA to date:
Bremen (Germany)
Lincoln
>S$1.5b portfolio
7,726 Beds
28 assets
18 Cities
2 Countries
Mayflower Portfolio Mar 2019 Apr 2019 Student Castle
Sep 2018 264 beds | 2 assets 1,243 beds | 3 assets
3,436 beds | 14 assets Dec 2019
Glasgow Southampton
Bristol, Birmingham 2,383 beds | 7 assets
Sheffield
London, Sheffield Leeds York, Cambridge
Huddersfield Bath, Edinburgh
Plymouth Durham
Brighton, Oxford (in dev.) 19Oxford: Oxford and Cambridge ranked globally No. 1 and No. 2 *
Oxford, Cambridge, Durham, Edinburgh, York in UK’s top-
515 beds ranked Russell Group of universities
SBR: 1.4 All freehold assets, with 100% occupancy rate
@
Rank: 1 Healthy student-bed ratio
Cambridge: Edinburgh: Bath:
212 beds 146 beds 183 beds
SBR: 2.6 SBR: 2.6
SBR: 1.3 National
Rank: 121
Rank: 2 Rank: 332
Durham: York: Brighton:
473 beds 648 beds 206 beds
SBR: 2.1 SBR: 2.0 SBR: 3.8
Rank: 51 Rank: 211 National
Rank: 612
* The Times Higher Education World University Rankings
1 The Complete University Guide, University League Tables, Russell Group
2 CWUR World University Rankings
@ Oxford and Brighton are under development 20Top of the range student brand
a competitive advantage
Premium features including ultra-fast
wifi, 24/7 security, fully-equipped gym,
bike storage
Offering more options, to attract
international and domestic students
Full-suite operational
capabilities for better efficiency
and economies of scale
21Extends UK network significantly
84% of Student Castle beds are in top
university cities, including Oxford and
Cambridge
Total portfolio has 62% of beds in towns
with Russell Group universities
7,442 Beds, 27 assets across 17 UK cities
1 Figure within the circle represents the number of assets in each city
* Represents cities where Russell Group universities are located; Russell Group is a ranking of the top 24 UK universities
Student Castle Portfolio
Capitol Students Portfolio 22Diversifying into Bremen,
Germany with S$23.4m freehold
asset in Nov 2019
Added 284 rooms
Galileo Residenz at near-full occupancy
over past 9 years
Geographical diversification; Germany
has one of largest student populations
in Europe with >30% increase over the
past decade
231. Demand growth to outstrip supply1 2. Strong demographic fundamentals 3. Quality of UK education
• Student numbers outweigh PBSA • Positive secular trends in the • UK has the 2nd highest number
bed supply 3:11 domestic population of top ranked universities globally
• Shortfall in supply despite more o UK 18-year-old population with 33 in the Top 2504
than 30,000 PBSA beds delivered predicted to grow by 25% between
every year from 2015 to 2018 2020 and 20302
627,000
PBSA bed supply
for AY18/19
1.8m
• Rise in international students’
Full time students
applications from China and India 4. Supportive government policies
to a record high for AY20/21 >30%3
• Attractive work visas – eligible
1 Knight
Frank analysis, based on UK’s 18-year-old population projections (sourced from UK Office of National Statistics) and international graduates will be able
UCAS entry rates to work or seek work for 2 years
2 Being 18 in 2018, UK Office of National Statistics, 2018 from 2020/2021
3 2020 cycle applicant figures – 15 January deadline, UCAS, 2020
4 Knight Frank Global Student Report 2019 and European Student Accommodation Guide, Cushman & Wakefield, 2019 24Acquired 50% interest in
Westfield Marion Shopping
Centre in Adelaide for A$670m
Largest shopping centre in Adelaide and
South Australia
99.3% occupancy, WALE of 6.7 years,
attracts 13.5 million visitors annually
Deal completed in Dec 2019
Continue to seek opportunities in
Asia-Pacific retail properties
25Aged
Care
26Improving operational efficiency
Higher revenue and income from higher average bill size
and ancillary services; lower manpower costs
Steady bed occupancy rate of around 80%*
Quality-focused with no notable care
Ramping up re-opened Changi Care Village incidents reported
Expanding at home and overseas
Participating in Build-Own-Lease tenders in Singapore
Evaluating overseas expansion opportunities
Outdoor area for rehabilitation
* Excluding Changi Care Village which recently re-opened 27Elderly population in Japan forecasted to rise
Senior living assets are cash-
yielding, defensive in nature:
Japan
Partnered Japanese asset manager Bridge
C Capital in Oct 2019 as on-ground partner
Fund structure offers potential for fee
income
Other developed markets
Low interest rates
• CIO/CFO of Developer • Background in real Relatively lower regulatory risk
Group Pte Ltd estate investment and
• Ex-Vice President of
financing from Attractive market fundamentals
Accenture, ORIX
Carlyle Group (Buyout
Corporation, LaSalle
Team) at Carlyle Japan
Investment
LLC
Management Co.
Limited and Shinsei
Bank Limited
28Part of strategy to grow recurring income base
Acquisition of five high quality assets in Hokkaido, Nara
(Osaka Metropolitan region) and Tokyo for JPY5.26 billion
(S$65.8 million), announced Feb 2020
365 beds; providing quality independent living services
Operators on long leases averaging 23.4 years
Result of partnership with Bridge C Capital
Asset management fees to add to recurring income stream
Attractive demographics in Japan
Elderly (≥65 years) to rise to 30% of total population by 20251
Senior care offerings, including home, facility and the elderly
care market are estimated to be worth JPY15 trillion
(approximately S$188 billion) in 20252
1“IPSS Research Report No. 85 “Population and Social Security in Japan”, National Institute of Population and Social Security Research, July 2019.
2“Demographics Asia: Opportunity in adversity”, IPE Real Assets, March 2018.
29Part of strategy to acquire cash-yielding assets
in defensive sectors
Acquisition of six freehold assets; five in Ontario, one in
Saskatchewan for Can$232.9 million (S$244.5 million),
announced Feb 2020, subject to satisfactory due diligence
Total 717 suites, average age of around 7 years
Occupancy rates in excess of 90% over the past three years
Experienced Canadian operator Hawthorn Senior Living
Enters attractive North American market
Canada has one of the highest average life expectancies
globally at 82.3 years1, number of people 75 years and above
growing by 52.6% over the next decade2
Demand for independent living and assisted living services
projected to rise with additional 199,000 beds required by
2035, up from 263,000 beds currently
1Average life expectancy, World Bank.
2U.S. Census Bureau, 2018, World Development Indicators 30Summary
31Media, Telco & Tech Property Aged Care
• Boosting digital circulation • Doubled PBSA portfolio • Improving operational
with targeted campaigns to >S$1.5b efficiency
• Disciplined cost • Expanded SPH REIT to • Seeking opportunities
management grow recurring income overseas
• Focused on quality base
journalism and innovation
Leveraging on Balance Sheet Strength; Improving Recurring Income
32Thank You Visit www.sph.com.sg for more information
Annexe
Operating Revenue Composition (S$244.0m)      Media Advertisement Revenue
                                              Composition (S$94.4m)
          14.5%

                                                24.2%
                                      38.6%

                                                                                              53.5%
33.2%

                                              22.3%

                          13.7%

 Advertisements (Media)    Circulation          Display       Classified*       Magazines & Others
 Rental & Services         Other revenue
                                              * Classified includes Recruitment and Notices
                                                                                                      35
1Q FY20 Operating Expenditure* Cost Composition (S$194.5m) S$’ m
6.7% 4.3% Newsprint 2.8
12.2% Newsprint
Other Production costs 1.8
18.6% Other Materials, Production
& Distribution Cost
Staff Cost Staff Costs 2.1
Premises Cost
Premises Costs 0.7
5.1% Depreciation
Depreciation 3.4
Other Operating Expenses
9.7%
Finance Cost Other Operating Expenses 12.1
43.4%
Finance costs 2.4
* Excluding impairment charges
36Group Investible Fund (S$879m) as at 30 Nov 2019
Cash, deposits and receivables
include part of the proceeds from
18.8%
Equities
S$300m 4% Perpetual Securities
issued in Nov 2019
Bonds
37.4% Investment Funds
Bonds increased partly due to the
Cash, deposits and
receivables*
purchase of short-term treasury
bills using the proceeds from the
19.0% Perpetual Securities
24.8%
37Average Newsprint Charge-Out Price & Monthly Consumption
US$ / MT MT
4,500
675 669 665
4,341 4,400
650
4,300
625 618 621 4,200
4,057
4,100
600
583 4,000
575 3,877
3,900
550 3,855 3,800
3,700
525 3,553
3,600
500 3,500
1Q FY19 2Q FY19 3Q FY19 4Q FY19 1Q FY20
LHS - Prices / MT RHS - Avg Mthly Consumption
38% Change % Change
1Q FY20 1Q FY19 1Q FY18 (1Q FY20 vs (1Q FY20 vs
1Q FY19) 1Q FY18)
Headcount as at end Nov 3,990 4,084 4,302 (2.3) (7.3)
Staff Costs (S$’000) 84,405 86,489 85,794 (2.4) (1.6)
39S$'m
Operating Profit and Operating Margin (%) *
50%
99
100 45%
40%
80 75
71 35%
70
33.4% 30%
60 54
29.4% 25%
26.9%
25.4% 20%
40 22.1%
15%
20 10%
5%
0 0%
1Q 2016 1Q 2017 1Q 2018 1Q 2019 1Q 2020
Operating Profit Operating Margin
* Excluding impairment charges on goodwill and intangibles, and property, plant and equipment
40You can also read