Investor Presentation Citi Global REIT CEO Conference 2020 - Flamingo Point Miami Beach, FL
←
→
Page content transcription
If your browser does not render page correctly, please read the page content below
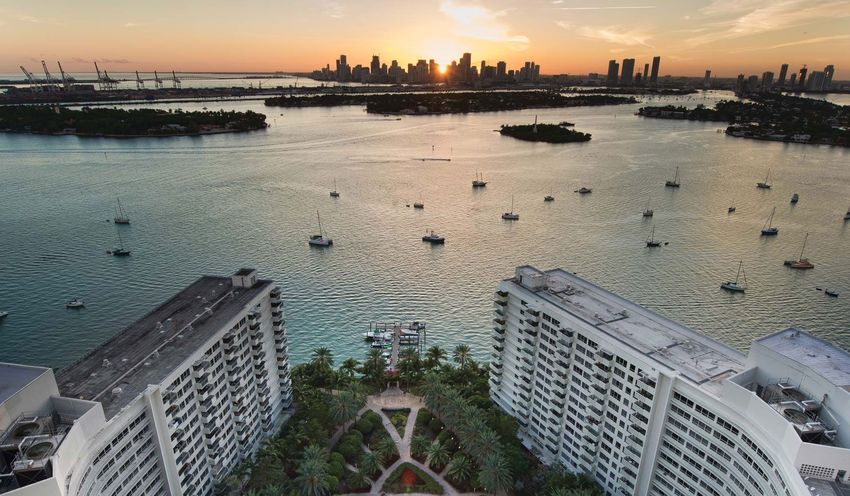
Flamingo Point
Miami Beach, FL

 Investor Presentation
 Citi Global REIT CEO Conference 2020
 March 2-4

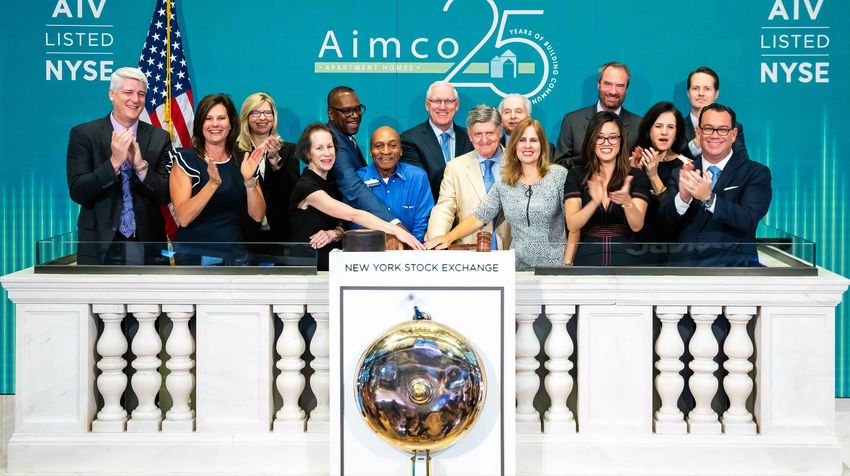
FINANCIAL PERFORMANCE

Last July Aimco celebrated 25 Years as a public company.
Over its first 25 years, compounded annually:
• Aimco Total Shareholder Return was 11.6%; MSCI US REIT index was 10.2%; S&P 500 was 9.9%.
• Aimco Economic Income(1) was 14%.
• 190 of the current S&P 500 companies have been public for 25 years. Aimco has outperformed two-thirds of these companies with a
  total return ~50% above the median.
Over the five years ended December 31, 2019, compounded annually:
• Aimco Total Shareholder Return was 10.4%; MSCI US REIT index was 7.0%; S&P 500 was 11.7%.
• Aimco Economic Income(2) was 10%.
In 2020, Aimco expects Economic Income of approximately 8% to 11%.
(1)   Economic Income is calculated as the per share change in Net Asset Value (NAV) plus Cash Dividends paid, Aimco uses share price at IPO as a proxy for NAV.
(2)   Represents Aimco’s estimated Net Asset Value of $59/sh at 12/31/2019.                                                                                        2
STRATEGIC FOCUS
Aimco Economic Income is the result of performance in five key business areas.
                                  • Increase revenue based on high levels of resident retention, through superior customer selection and
Operations                          satisfaction, coupled with disciplined innovation resulting in sustained cost control, to further improve
                                    NOI margins.

Redevelopment and                 • Create value and future earnings growth by the renovation and repositioning of apartment communities
Development                         through “short-cycle” and “long-cycle” redevelopments.

                                  • Own an apartment portfolio diversified by geography and price point with a focus on properties with
                                    high land value located in submarkets with outsized future growth prospects.
Portfolio Management/             • Diversify the portfolio further by maintaining an allocation to both “income” properties, high quality
Capital Allocation                  properties with predictable, “low beta” AFFO returns, and “growth” properties, usually with B or C+
                                    rents, where we expect appreciation of the substantial land value will create opportunities for “high
                                    alpha” value creation through profitable redevelopment.

                                  • Utilize safe property debt that is low-cost, long-dated, amortizing, and non-recourse; limiting entity and
Balance Sheet
                                    refunding risk while maintaining flexibility to sell or redevelop properties.

                                  • Emphasize an intentional culture that is collaborative and productive, based on respect for others and
                                    personal responsibility…strengthened by a preference for promotion from within and an explicit talent
Team
                                    development and succession planning to produce the strong, stable team that is the enduring
                                    foundation of Aimco success.

To further these goals, over the intermediate term, Aimco expects to:
• In Operations, to strengthen relationships among residents that reinforce low resident turnover that is already peer leading;
• In Redevelopment, to increase annual investment, while maintaining a balance between “short-cycle” and “long-cycle” spending;
• In Portfolio Management, to adjust the current ~50:50 balance between “A” and “B/C+” properties to a greater % of “B” properties with
  potential for above-average value creation;
• In Balance Sheet, to seek a lower blended cost of capital while reducing leverage to ~6x EBITDA; and
• In Team, to increase the devolution of decision-making to local “hubs” closer to the properties and their local communities.

                                                                                                                                                 3
STRONG EARNINGS GROWTH POTENTIAL
For the next five years, Aimco expects:
1. Same Store NOI growth to be above peer average due to:
   • Sustained excellence in operations with world class measured customer satisfaction (4.32 out of 5 in 2019);

      • Peer-leading average daily occupancy (97.1% in 2019);

      • Disciplined cost control based on innovation,
         o Aimco Same Store COE(1) growth was 1.0% over the last five years, 110 bps below the peer average(2), 0.1% over
           the last ten years, and negative over the last twelve years(3); and

                                                                                                                                              CAGR

                                                                                                                                              2.1% Peer
                                                                                                                                              Avg

                                                                                                                                              1.0% Aimco

      • Improving operating margins (73.7% in 2019 and peer leading for the past ten quarters).

(1)   COE refers to Controllable Operating Expenses, defined by Aimco as property level expenses before taxes, insurance, and utilities.
(2)   Peer group consists of AVB, CPT, EQR, ESS, MAA, and UDR. Peer average COE is calculated, per Aimco’s COE definition, as the CAGR of peer averages.
(3)   Due to inadequate public Same Store COE disclosure from peers a ten-year or longer comparison is not available.                                      4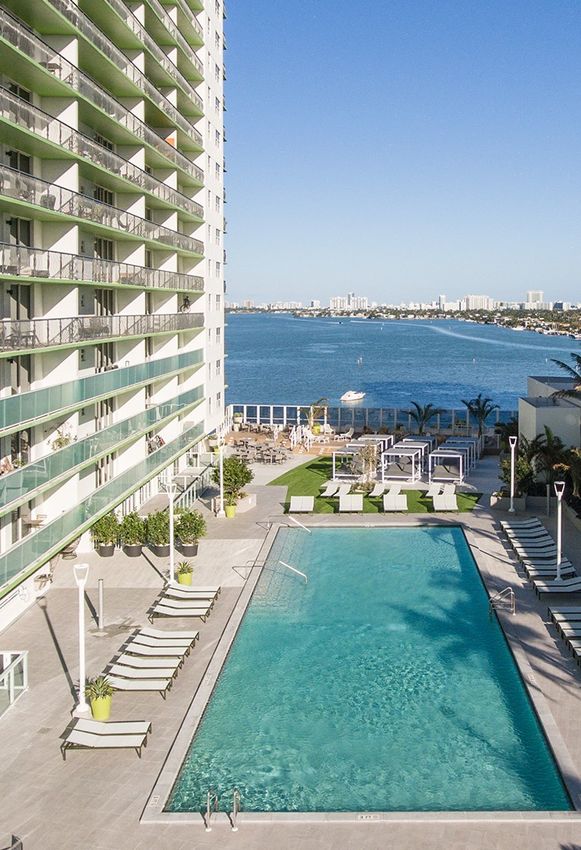
STRONG EARNINGS GROWTH POTENTIAL
2. Increased contribution from completion of current projects that are expected to add a cumulative $27M annually, or
   $0.18 per share, net of capital costs, roughly:
   • In 2021, ~$5M, or $0.03 per share;
   • In 2022, ~$7M, or $0.05 per share;
   • In 2023, ~$6M, or $0.04 per share;
   • In 2024, ~$5M, or $0.03 per share; and
   • In 2025, ~$4M, or $0.03 per share.

      • With further contributions from the planned increase in the amount of annual spending for Redevelopment.

3. Increased contribution from opportunistic transactions.
   • For example, in 2019, Aimco completed two opportunistic investments, both of which were accretive to earnings.

4. A lower cost of capital due to refinancing and recapitalizing activities.

(1)   $247M of property debt is payable at par in 2020 but does not mature until 2021; Aimco intends to repay the majority of this debt in 2020.
                                                                                                                                                   5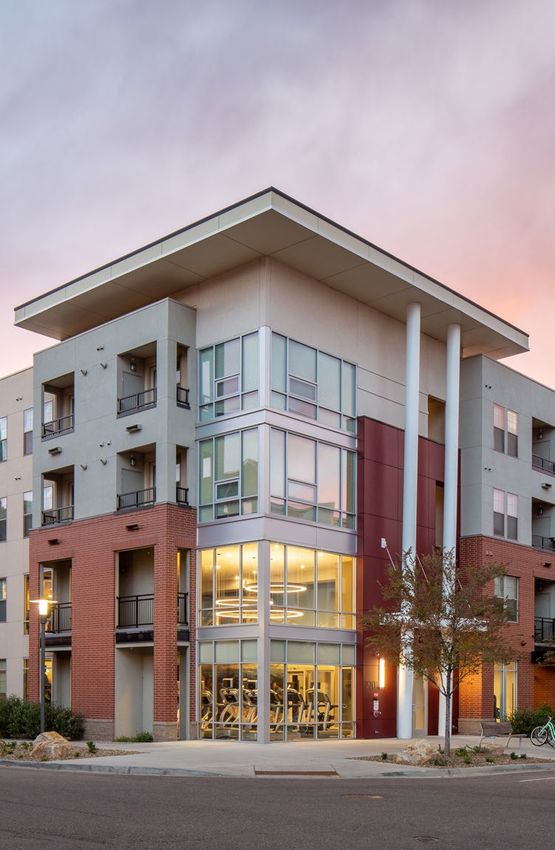
PORTFOLIO MANAGEMENT
A well-diversified portfolio with above average revenue growth and less volatility.
• Over the last five years, Aimco Same Store revenue growth was 3RD HIGHEST amongst peers, 70 bps better than peer
  average, and also the LEAST VOLATILE, ~50% less volatile than the peer average(1).

Aimco’s portfolio is diversified by:
• GEOGRAPHY – located in 12 of the largest markets in the nation, and
• PRICE POINT – allocated now ~50% to properties at the “A” price point and ~50% at the “B/C+” price point.

Adjusting the mix between Aimco “Income” properties with predictable growth and forecasted unlevered FCF IRRs
of 6% to 7% to favor “Growth” properties with similar growth from operations and also episodic value creation from
redevelopment where land is a high percentage of the total value of the property.

      Flamingo Point
      Miami Beach, FL
(1)   Peer group consists of AVB, CPT, EQR, ESS, MAA, and UDR. Volatility measured as the standard deviation of reported full year Same Store revenue growth for the five years ending 12/31/2019.   6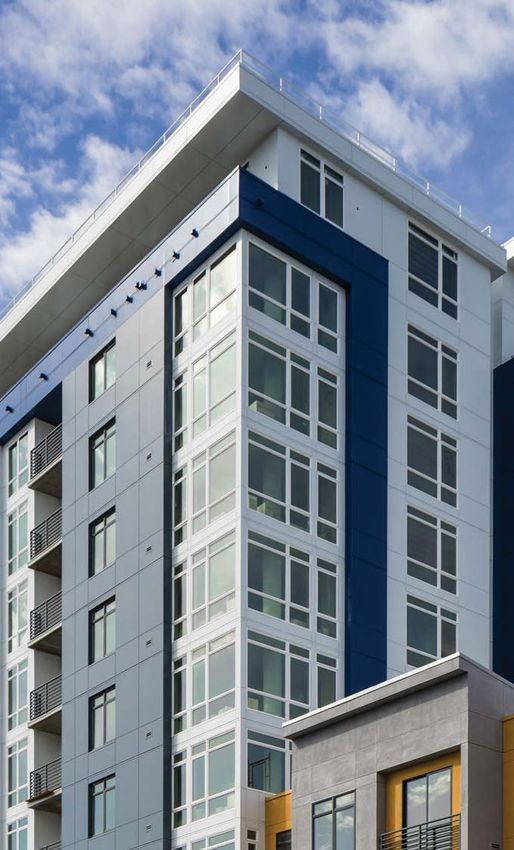
TEAM, CULTURE, & ESG
Aimco benefits from a cohesive, long-tenured management team and a culture that promotes integrity, collaboration, and
innovation.
TEAM ENGAGEMENT
•   Out of hundreds of participating companies, Aimco is one of seven recognized as a
    "Top Place to Work" in Colorado for each of the past seven years. In 2019, Aimco
    was also recognized as a “Top Place to Work” in the Bay Area.
•   For the past five years, Aimco team engagement scores, on a 1 to 5 scale, have
    averaged better than 4.

Aimco has a long record of Corporate Responsibility. For example:
ENVIRONMENTAL
• Aimco creates a POSITIVE ENVIRONMENTAL IMPACT through efficient utilization and redevelopment of existing assets, and by
  INVESTING SYSTEMATICALLY in building systems that use energy and water MORE EFFECTIVELY and MORE EFFICIENTLY.
SOCIAL
• Aimco has always worked to be a Good Neighbor, for example, AIMCO CARES provides Aimco team members 15 hours annually of PAID
  TIME OFF TO VOLUNTEER in the communities where they live and work, and where Aimco does business.
• In 2019, Aimco team members volunteered over 5,000 HOURS, serving 101 NONPROFITS at 125 VOLUNTEER EVENTS.
• Aimco also RAISED MORE THAN $500,000 through its annual charity golf tournament to raise money for MILITARY FAMILIES and
  SCHOLARSHIPS FOR STUDENTS in affordable housing.
GOVERNANCE
• Aimco has always been governed by a HIGHLY ENGAGED and INDEPENDENT Board of Directors who sit on each committee so that
  there are no silos to block transparency. Aimco has been honored for BOARD COMPOSITION, for the last three years, by the Women’s
  Forum of New York, and, in 2019, by BoardBound for having three or more board seats held by women.
• Aimco has a systematic program for BOARD REFRESHMENT balancing the perspective of long-serving directors with the FRESH
  INSIGHTS of new directors.

                                                                                                                                     7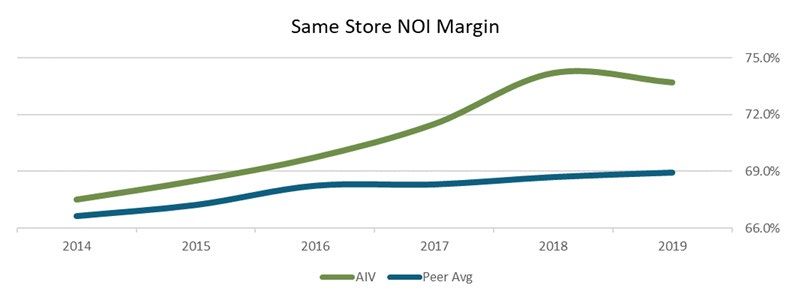
WHY INVEST IN AIMCO?
                           •       Best-in-Class Operations: Lower resident turnover through
                                   intentional focus on customer selection and satisfaction drives
                                   peer-leading margins.
                           •       Paired-Trade Capital Allocation Discipline: Aimco
                                   adheres to a disciplined paired-trade strategy comparing
                                   expected unlevered returns on each of its capital allocation
                                   uses to the expected unlevered costs of capital.
                           •       Favorable Risk Adjustment: Aimco’s risk adjustment is
                                   more favorable due to its portfolio diversified by:
                               •      Geography: targeting 12 of the largest markets in the
                                      nation;
                               •      Price Point: balanced with ~50% “A” communities and
                                      ~50% “B/C+” communities; and
                               •      Opportunity: of Aimco’s portfolio, ~60% is allocated to
                                      “income” properties, those with predictable AFFO returns,
                                      ~35% is allocated to “growth” properties, those with
                                      opportunity for outsized shareholder value creation, and
                                      ~5% are other properties, the majority of which we expect
                                      to sell in 2020.
                           •       Safe and Flexible Balance Sheet: Aimco is the only REIT
                                   in its peer group that uses primarily non-recourse, property
                                   level financing while maintaining an investment grade rating as
                                   confirmation of the safety of its balance sheet.

Bay Parc
Miami, FL

                                                                                                     8
APPENDIX
9APPENDIX A - OPERATIONS UPDATE
Indigo
Redwood City, CA
STRONG SAME STORE OPERATIONS
2020 Same Store guidance midpoints:
• Revenue growth of 3.4%, 30 bps better than peer average;
• Expense growth of 2.0%, 100 bps better than peer average;
and
• Net operating income (NOI) growth of 3.9%, 80 bps better
than peer average … and 40 bps better than any peer.
Over the last three years, Aimco Same Store NOI has grown at
3.9%, 70 bps better than peer average … and 20 bps better than
any peer.
EARLY 2020 UPDATE
• Aimco is ON-TRACK through February 2020, maintaining high
ADO, up 70 bps year-over-year, with blended lease rates up
3.0% year-over-year.
CHANGES IN SAME STORE Jan Feb YTD
RENTAL RATES(1) 2019 2019(1) Leases
RENEWALS 5.5% 5.2% 5.3%
NEW LEASES 1.0% 2.4% 1.7%
WT. AVG. 2.6% 3.5% 3.0%
AVERAGE DAILY OCCUPANCY
97.9% 97.5% 97.7%
(“ADO”)
(1) February leasing data is updated as of 2/24/2020, and is considered preliminary, actual results published with the 1Q 2020 Earnings Release may differ.
10APPENDIX B - SUPPLY OUTLOOK
• Aimco considers competitive new supply to be significant primarily to “A” price point communities in submarkets where completions are
projected to be more than 2.0% of existing stock.
• Even where markets face elevated new supply, the quality of the Aimco offering or its location, or an increase in local demand (for
example from job growth), can reduce or offset the impact of new supply.
• Third party experts forecast two submarkets with material investment by Aimco where 2020 increases in supply are expected to be >2%:
Mid-Wilshire in Los Angeles; and Center City Philadelphia.
% Aimco GAV 2020
Invested in "A" Completions
Submarket Graded as a % of
Market Submarket Communities Stock(1) Aimco Specific Mitigating Factors
Deliveries delayed from 2019 cause this submarket to screen at our elevated
Los Angeles Mid-Wilshire 9.0% 2.6% supply threshold in 2020, if further delays are experienced the impact will be
muted in 2020.
The continuing new supply is easing from 2018 and 2019 when Aimco enjoyed
Philadelphia Center City 6.8% 3.5% robust demand for its apartment homes in Center City and University City.
• Third parties also forecast three submarkets with lesser investments by Aimco, totaling ~6% of GAV, where 2020 increases in supply are
forecast to be >2%: One Canal in Boston; Calhoun Beach Club in Minneapolis; Indigo and 707 Leahy in Redwood City, CA.
• On balance, although the mix of submarkets are somewhat different, Aimco expects properties representing about one-fifth of Aimco GAV
will be subject to significant new supply in 2020, similar to Aimco expectations entering 2017, 2018, and 2019.
(1) Based on submarket data for deliveries in 2020 as a percentage of 4Q19 forecasted stock as of 4Q 2019, available from Axio/MPF Research.
11APPENDIX C - 2020 GUIDANCE
($ Amounts represent Aimco Share) FULL YEAR 2020 FULL YEAR 2019
Net Income per share $3.07 to $3.59 $3.15
Pro forma FFO per share $2.62 to $2.72 $2.50
AFFO per share $2.34 to $2.44 $2.20
Select Components of Nareit FFO
Same Store Operating Measures
Revenue change compared to prior year 3.00% to 3.80% 3.8%
Expense change compared to prior year 1.60% to 2.40% 2.4%
NOI change compared to prior year 3.20% to 4.60% 4.3%
Other Earnings
Tax Benefit $9M to $11M $13M
Offsite Costs
Property management expenses [1] $19M $20M
General and administrative expenses $44M $44M
Investment management expenses [2] $6M $7M
Capital Investments
Redevelopment/Development $250M to $300M $230M
Capital Enhancements $50M to $70M $88M
Transactions
Property dispositions $900M to $1,000M $696M
Property acquisitions [3] — $223M
Balance Sheet
Proportionate Debt to Adjusted EBITDAre [4] ~6.4x 7.4x
Proportionate Debt and Preferred Equity to Adjusted EBITDAre [4] ~6.5x 7.6x
1. Property management expenses for the year ended December 31, 2019, are presented net of approximately $1.0 million of restructuring
costs that Aimco incurred for the relocation of its administrative functions from its Indianapolis office to Denver, which have been excluded
from Pro forma FFO.
2. Investment management expenses includes costs related to transactions and new business pursuits. Costs for the year ended December
31, 2019, previously included in multiple line items in the statements of operations, are included in investment management expenses
above for comparability.
3. Aimco does not predict or guide to acquisitions. Aimco monitors potential transactions and funds acquisitions pursuant to its strict paired
trade discipline.
4. Aimco delayed $300 million of year-end and January sales. The sales delay increased Aimco leverage to EBITDAre ratios by 0.3x at year
end 2019. Aimco expects a gradual decline in leverage to EBITDAre ratios throughout 2020, reaching approximately 6.4x and 6.5x,
respectively, at year-end. In future years, earnings growth from completed redevelopments will increase EBITDAre and further reduce
Aimco leverage ratios.
12APPENDIX D - 2020 NAV OUTLOOK
2020 NAV & ECONOMIC INCOME OUTLOOK
• Aimco publishes semi-annually its estimate of Net Asset Value. As of 3Q
2019, Aimco estimated its NAV at $58 per share, up $2 from 3Q 2018.
• Aimco estimates its YE 2019 NAV at $59 per share.
• Given the Aimco forecasted results and assuming unchanged market
pricing, Aimco NAV at YE 2020 will be ~$62 to $64 per share.
• Assuming the NAV increase described above and 2020 cash dividends
equal to the 1Q 2020 dividend, Economic Income is expected to provide an
~8% to 11% return in 2020.
2020
2019(1) Outlook
NAV Growth 5% ~5% to 8%
Dividends 3% 3%
Economic Income 8% ~8% to 11%
21 Fitzsimons
Aurora, CO
(1) 2019 NAV growth is calculated as the % change from Aimco’s published NAV at YE 2018 ($56 per share) to the Aimco estimate at YE 2019 ($59 per share).
13FORWARD LOOKING STATEMENTS & OTHER INFORMATION
This presentation contains forward-looking statements within the meaning of the federal securities laws, including, without limitation, statements regarding projected
results and specifically forecasts of 2020 and future expectations, including but not limited to: AFFO and selected components thereof; Aimco redevelopment and
development investments and projected value creation from such investments; Aimco refinancing activities; and Aimco liquidity and leverage metrics.
These forward-looking statements are based on management’s judgment as of this date, which is subject to risks and uncertainties. Risks and uncertainties include, but
are not limited to: Aimco’s ability to maintain current or meet projected occupancy, rental rate and property operating results; the effect of acquisitions, dispositions,
redevelopments and developments; Aimco’s ability to meet budgeted costs and timelines, and achieve budgeted rental rates related to Aimco redevelopments and
developments; and Aimco’s ability to comply with debt covenants, including financial coverage ratios. Actual results may differ materially from those described in these
forward-looking statements and, in addition, will be affected by a variety of risks and factors, some of which are beyond Aimco’s control, including, without
limitation:
• Real estate and operating risks, including fluctuations in real estate values and the general economic climate in the markets in which Aimco operates and
competition for residents in such markets; national and local economic conditions, including the pace of job growth and the level of unemployment; the amount,
location and quality of competitive new housing supply; the timing of acquisitions, dispositions, redevelopments and developments; and changes in operating costs,
including energy costs;
• Financing risks, including the availability and cost of capital markets’ financing; the risk that cash flows from operations may be insufficient to meet required
payments of principal and interest; and the risk that earnings may not be sufficient to maintain compliance with debt covenants;
• Insurance risks, including the cost of insurance, and natural disasters and severe weather such as hurricanes; and
• Legal and regulatory risks, including costs associated with prosecuting or defending claims and any adverse outcomes; the terms of governmental regulations that
affect Aimco and interpretations of those regulations; and possible environmental liabilities, including costs, fines or penalties that may be incurred due to necessary
remediation of contamination of apartment communities presently or previously owned by Aimco.
In addition, Aimco’s current and continuing qualification as a real estate investment trust involves the application of highly technical and complex provisions of the
Internal Revenue Code and depends on Aimco’s ability to meet the various requirements imposed by the Internal Revenue Code, through actual operating results,
distribution levels and diversity of stock ownership.
Pursuant to its existing authority to repurchase up to an additional 10.6M shares, Aimco may make repurchases from time to time in the open market or in privately
negotiated transactions at the Aimco’s discretion and in accordance with the requirements of the SEC. The timing and amount of repurchases, if at all, will depend on
market pricing as well as other conditions.
Readers should carefully review Aimco’s financial statements and the notes thereto, as well as the section entitled “Risk Factors” in Item 1A of Aimco’s Annual Report
on Form 10-K for the year ended December 31, 2019, and the other documents Aimco files from time to time with the Securities and Exchange Commission.
These forward-looking statements reflect management’s judgment as of this date, and Aimco assumes no obligation to revise or update them to reflect future events or
circumstances. This presentation does not constitute an offer of securities for sale.
Glossary & Reconciliations of Non-GAAP Financial and Operating Measures
Financial and operating measures discussed in this document include certain financial measures used by Aimco management, that are measures not defined under
accounting principles generally accepted in the United States, or GAAP. Certain Aimco terms and Non-GAAP measures are defined in the Glossary and Reconciliations
of Non-GAAP Financial and Operating Measures included in Aimco’s Fourth Quarter 2019 Earnings Release dated January 30, 2020.
14You can also read