Nexans Transforming Nexans' value delivery model - Strategic update, Nov. 9th 2018
←
→
Page content transcription
If your browser does not render page correctly, please read the page content below

Nexans
Transforming Nexans’
value delivery model

            2018
                       Strategic update, Nov. 9th 2018
This presentation contains forward-looking statements which are subject to various expected or unexpected risks and uncertainties that could have a material impact on the Company's future performance.
The uncertainty in the economic and political environment in Europe including the possible consequences of Brexit which could lead to lower growth ;
The impact of protectionist trade policies triggered notably by the current US government as well as growing pressures to increase local content requirements ;
Geopolitical instability including embargoes of Qatar and Iran, political instability in Libya and Ivory Coast, as well as persistent tensions in Lebanon, the Persian/Arabian Gulf and the Korean peninsula ;
The continued uncertain political and economic situation in South America, particularly in Brazil, which is affecting the building market and major infrastructure projects in the region as well as creating
exchange rate volatility and an increased risk of customer default ;
Abrupt changes in non-ferrous metal costs that can impact short term customers’ purchasing patterns;
A significant drop in metal prices leading to core exposure reevaluation and a direct impact on net income, though without impact on cash or operational margin;
The impact of rising inflationary pressures, notably on raw material costs (resins, steel etc.) and labor costs which may impact competitiveness depending on the ability to pass them through into the selling
prices to our customers;
The impact of changes in exchange rates on the conversion of the financial statements of the Group’s subsidiaries located outside the euro zone.
The sustainability of the high rates of growth and/or Nexans’ market penetration in the segments related to renewable energy development (wind and solar farms, interconnections etc.);
The speed and magnitude of recovery in the LAN cabling markets in North America and the Group’s ability to take advantage of the strong growth in large data centers;
The risk that the expected sustained growth in the automotive markets in North America and in the electric vehicle market worldwide does not materialize;
The Group’s ability to adapt to changes in O&G customers’ investments in exploration and production in reaction to oil and gas price fluctuations;
The risk that certain programs designed to improve the Group’s competitiveness such as programs of design to cost, fixed cost reductions, R&D and innovation programs, or certain business development
plans targeting new markets, experience delays which can result from the speed in technology transfer on obtaining customer qualifications, or which otherwise do not fully meet their objectives;
The risk in particular that the time and cost foreseen to return Land High Voltage activities to profitability will not be met;
The risk that the timing of expected contract awards or entering into force of contracts in submarine cables are delayed, or accelerated, which can result in unused capacity, otherwise disrupt planning, or
exceptional capacity utilization in any given year;
The inherent risks related to carrying out major turnkey projects for submarine high-voltage cables. Those might be exacerbated in the coming years as this business becomes increasingly concentrated and
centered on a small number of large scale projects (Beatrice, Nordlink, NSL, East Anglia One and DolWin6, which will be the first contract to supply and install HVDC extruded insulation cables), leading to
a high capacity utilization rates of the plants involved;
The inherent risks associated with major capex projects, particularly the risk of completion delays. These risks notably concern the construction of a new submarine cable laying ship and the extension of the
Goose Creek plant in North America to add production of submarine high-voltage cables, two projects that will be instrumental to 2021 objectives.
All figures presented in this document are not taking into account future application of IFRS/16
INVESTOR RELATIONS:
Michel GÉDÉON +33 1 78 15 05 41 michel.gedeon@nexans.com
Marième DIOP +33 1 78 15 05 40 marieme.diop@nexans.com
2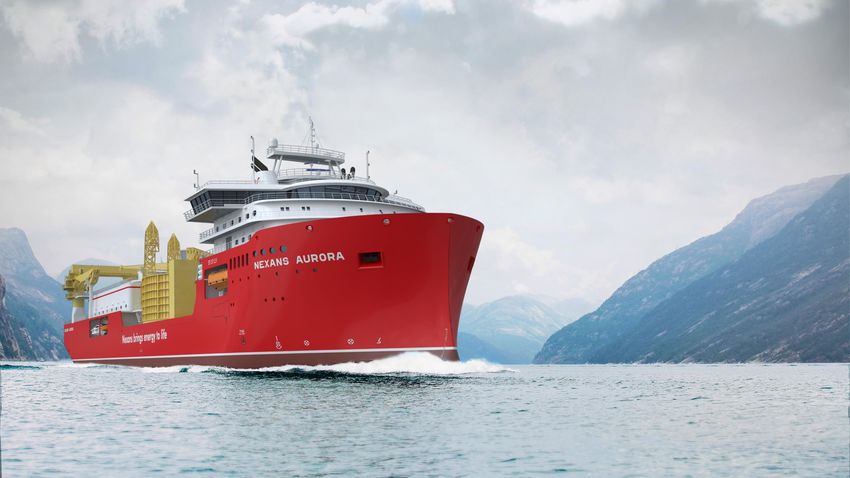
We h a v e c h a l l e n ge s …

                                                                   1        Undertake further transformation
                                                                             ▪ The potential of turnaround remains high
                                                                             ▪ Manage for growth the 50% of the Group that generates a very good return
                                                                             ▪ Transform the remaining 50% to unlock value

                                                                   2       Mindset change from volume to value growth
                                                                             ▪ More volume does not mean more profit, we need to scale more than to grow
                                                                             ▪ Move up the value chain rather than focus on growth at all cost
                                                                             ▪ Grow value by positioning Nexans as a service provider and conquer new white
                                                                               spaces

                                                                   3        Adjust organization structure to introduce more accountability and agility
                                                                              ▪ Higher discipline in execution
                                                                              ▪ Stronger focus on Return on Capital Employed and Free Cash Flow generation
                                                                              ▪ Simplified, leaner and more agile organization

The current strategic plan and the initiatives it describes are based on assumptions and scenarios used as hypothesis upon which the attached document is based. These assumptions and scenarios are exposed to all risk factors and main uncertainties
described in the 2017 Registration document and in the 2018 Half-year financial report of the Group. Moreover, certain scenarios considered in the current strategic plan will be further analyzed prior to deciding their implementation, and projects
resulting from those studies will be submitted to relevant legal bodies including to employee representatives bodies if applicable and when needed.
                                                                                                                                                                                                                                                          3
… a n d a g r e at p o t e n tial t o u n l oc k

                                                                   1     A turnaround method already proven and scalable
                                                                            ▪ Europe and Middle East Africa Areas, have succeeded their transformation
                                                                            ▪ A methodology called SHIFT has been designed by Nexans
                                                                            ▪ Our teams are already starting to deploy it in underperforming units

                                                                   2      A differentiation DNA
                                                                            ▪ Demonstrated capabilities to differentiate through deployment of services and use of
                                                                               marketing, creating value in very competitive markets such as Building & Territories
                                                                            ▪ Successfully managed to develop systems in segments such as wind turbines
                                                                            ▪ Our service team is being reinforced to scale this up

                                                                   3      Megatrends support our value chain move
                                                                            ▪ Capturing new services, building modules & systems to escape commodity traps
                                                                              and future intermediation risks
                                                                            ▪ Address the €120Bn market services with new offerings and strategic partnerships

The current strategic plan and the initiatives it describes are based on assumptions and scenarios used as hypothesis upon which the attached document is based. These assumptions and scenarios are exposed to all risk factors and main uncertainties
described in the 2017 Registration document and in the 2018 Half-year financial report of the Group. Moreover, certain scenarios considered in the current strategic plan will be further analyzed prior to deciding their implementation, and projects
resulting from those studies will be submitted to relevant legal bodies including to employee representatives bodies if applicable and when needed.
                                                                                                                                                                                                                                                          4
L E A D T H E V A L U E G R O W T H ( I N N O VAT I O N & S E R V I C E S )

      2030                                                                                       Long term perspectives are excellent and require a move alongside the value chain
                                                                                                 leading to value growth more than volume growth.
                                                                                                 By capturing new services, building modules and systems Nexans will:
              The World population will increase                                                 1- Deliver the best value for money for its clients
              by +20%, and urbanization by                                                       2- Escape the commodity traps and future intermediation risks.
              +40%                                                                               3- Address the €120Bn market services with new offerings and strategic partnerships

              Energy consumption will jump by
              +40%                                                                                                                                Big picture view of the Energy & data management market                                         Total ~€2,700Bn
                                                                                                                                                  Focus on Transmission & Distribution (power & data out of scope)                                First estimate

                                                                                                                                                    System management                                                                                 ~€20-25Bn
              Renewable energy will
                                                                                                                             +                                                                                                                        (fast growing)
              double
                                                                                                                                                   Operations                                                                   ~€1,100-1,400Bn

                                                                                                                    From basic to sophisticated
                                                                                                    Customer need
                                                                                                                                                   Asset management
              Energy transition bringing huge                                                                                                      (design, build and maintain equipment & infrastructures)
                                                                                                                                                                                                              ~€1,000-1,100Bn
              needs in Infrastructures and
              Networks                                                                                                                             Cable Services                                     ~€120Bn

              Cable & connectivity production will
                                                                                                                                                   Cable production                         €220Bn
              grow 3.9% per year to 2030                                                                                                           (Incl. accessories and cable assembly)
              System management will grow up to
              9.2% per year to 2030.

                                                                                                                               -
      2018

 All third party trademarks (including logos and icons) referenced here remain the property of their respective owners. Unless specifically identified as such, Nexans’ use of third party trademarks does not indicate any relationship, sponsorship,
 or endorsement between Nexans and the owners of these trademarks.                                                                                                                                                                                                     5
D e l i v e r o n t r an s for m at io n t o b ui l d o u r f u ture
                      2018                                  2019                                                            2020                                                           2021

                                                                                                                                                 TRANSFORM OUR POSITIONING
                                                                                                                                                 Change Playfield to grow value
   Management focus

                                                                                                                                                                                                                                Scale up the new
                                                                                                                                                                                                                                     model
                             TRANSFORM OUR OPERATIONAL MODEL
                             Pay our performance Debt

                                 FOCUS                           SIMPLIFY                                   ADAPT                                  CONNECT                                  DIGITALIZE                                  DISRUPT

                        Reduce operation              Reduce organization                      Optimize operations &                     Develop new customers’                    Digital transformation to                Penetrate new white
                        complexity, be more           complexity, increase                     Shift the portfolio                       offering with partners                    capture higher returns                   spaces with less capital
                        selective                     efficiency                                                                                                                                                            intensity

                                                                           Agile organization, Talent Management, Corporate Social Responsibility

The current strategic plan and the initiatives it describes are based on assumptions and scenarios used as hypothesis upon which the attached document is based. These assumptions and scenarios are exposed to all risk factors and main uncertainties
described in the 2017 Registration document and in the 2018 Half-year financial report of the Group. Moreover, certain scenarios considered in the current strategic plan will be further analyzed prior to deciding their implementation, and projects
resulting from those studies will be submitted to relevant legal bodies including to employee representatives bodies if applicable and when needed.
                                                                                                                                                                                                                                                          6
O u r 2 0 2 1 o b j e cti ve s
Based on the current market conditions

 In Millions Euros                                                                          In % (Before taxes)                                                               In Millions Euros (Before M&A and dividends)

                       +175M€
                                                                                                                     +7.0 pts
                                    500 M€                                                                                                                                                                       > 200M€
                                                                                                                                   15.5 %
        ~ 325 M€
                                                                                                      ~ 8.5 %

                                                                                                                                                                                        -190 M€

           2018E                      2021P
                                                                                                           2018E                   2021P                                             2016-2018E               2019E-2021P

                    EBITDA                                                                                         ROCE                                                             FREE CASH FLOW
                                                                                                                                                                                                C U M U L A T E D

    •     Transform underperforming units towards greater profitability
    •     Focus profitable units on growth for value via differentiation and innovation
    •     Restore competitiveness through ambitious cost reduction plan
    •     Enforce more discipline in CAPEX management and ROI monitoring

EBITDA: Operating Margin (OM) before depreciations ROCE: 12months on end-of-period capital employed restated for antitrust provisions. Yearly depreciation amounting to approximately
140M€ in 2018 and 150M€ beyond, Operating Margin can be computed accordingly.
The current strategic plan and the initiatives it describes are based on assumptions and scenarios used as hypothesis upon which the attached document is based. These assumptions and scenarios are exposed to all risk factors and main
uncertainties described in the 2017 Registration document and in the 2018 Half-year financial report of the Group. Moreover, certain scenarios considered in the current strategic plan will be further analyzed prior to deciding their
implementation, and projects resulting from those studies will be submitted to relevant legal bodies including to employee representatives bodies if applicable and when needed.                                                            7
Transforming Nexans’ Value Delivery Model
 A new roadmap

                                            8
Strategic scorecard : 2 Sequences, 6 Management streams

                                    2018                           2019                                                      2020                                                          2021
Management focus

                                                                                                                                                             TRANSFORM OUR POSITIONING
                                                                                                                                                             Change Playfield to grow value
                                      TRANSFORM OUR OPERATIONAL MODEL                                                                                                                                                      Scale up the new model
                                      Pay our performance Debt

                                             FOCUS                      SIMPLIFY                              ADAPT                                 CONNECT                                  DIGITALIZE                                DISRUPT

                                      Business Unit portfolio
                                                                    Cost reduction
                                      management – p10 to
     Zoom on selected initiatives

                                                                   initiatives – p11
                                               p11

                                             Transformation plan – p12 to p13

                                                                                                  KPI & Routines – p14                                Dedicated presentation in 2019

                                                                                                                          CSR priorities – p15

     The current strategic plan and the initiatives it describes are based on assumptions and scenarios used as hypothesis upon which the attached document is based. These assumptions and scenarios are exposed to all risk factors and main uncertainties
     described in the 2017 Registration document and in the 2018 Half-year financial report of the Group. Moreover, certain scenarios considered in the current strategic plan will be further analyzed prior to deciding their implementation, and projects
     resulting from those studies will be submitted to relevant legal bodies including to employee representatives bodies if applicable and when needed.                                                                                                       9
FOCUS Strong business unit portfolio management
NEXANS BUSINESS UNIT PORTFOLIO ANALYSIS BY 2021 WE TARGET A COMPLETE TURNAROUND OF
A granular view VALUE BURNERS, ONE THIRD OF THE COMPANY WILL
STILL BE IN TRANSFORMATION PHASE
Split of the estimated 2018 turnover per Business Unit
segment (Simplified and at iso-volume)
EBIT
% of Net 2018E
Building &
Constant Profitable
1 Profit drivers Territories 2021P
sales cash tanks Milk
2018E
High Voltage &
Projects 2021P
Transformation
Cash tanks 2 candidates
2018E
Telecom & Data
2021P
3
ValueRestructure
burners
2018E
Industry &
Solutions 2021P
Net Constant sales 1 Profit drivers and Profitable Cash tanks
% of OWC 2 Transformation candidates and Cash tanks
3 Value Burners
The current strategic plan and the initiatives it describes are based on assumptions and scenarios used as hypothesis upon which the attached document is based. These assumptions and scenarios are exposed to all risk factors and main uncertainties
described in the 2017 Registration document and in the 2018 Half-year financial report of the Group. Moreover, certain scenarios considered in the current strategic plan will be further analyzed prior to deciding their implementation, and projects
resulting from those studies will be submitted to relevant legal bodies including to employee representatives bodies if applicable and when needed. 10FOCUS Strong business unit portfolio management
ALL UNITS
Our Turnaround Restructure
1 Manage for Value Growth 2 3 Offset Price cost squeeze & labor
Strategy Manage for 2cash Manage for cash
inflation
Our Differentiate Allocate Freeze Sales
Initiatives Grow Value Transform Cost reduction initiatives
& Innovate CAPEX CAPEX Attrition
Seed for
400M€
value growth
focused on a No volume
New Incremental 100M€ EBITDA CAPEX freeze 210M€ fixed and variable cost reduction
Our limited growth or
offerings, Focused & profitable growth run rate by 2021 Except run rate by 2021
targets number of attrition to
Smart targeting 55M€ EBITDA run Reduction of 190M€ OWC maintenance To offset the Price cost squeeze & Labor
initiative of target
products rate by 2021 through SHIFT and other safety and inflation, estimated at ~190M€ over the
which Aurora margin ratios
Turnkey, new initiatives environment period
new HV increase
capabilities
subsea boat
▪ Deploy Service & Innovation task forces ▪ Deploy transformation task force ▪ Industrial Footprint optimization
▪ Carry out Differentiated offers methods ▪ Focus KPIs on cost control and free cash flow ▪ Indirect spend reductions
Status
▪ Focus KPIs on growth and free cash flow ▪ Favor attrition of the activities to target margin ratios increase ▪ LEAN manufacturing implementation
▪ Boost value growth ▪ Optimize Industrial footprint ▪ Support functions optimization
The current strategic plan and the initiatives it describes are based on assumptions and scenarios used as hypothesis upon which the attached document is based. These assumptions and scenarios are exposed to all risk factors and main
uncertainties described in the 2017 Registration document and in the 2018 Half-year financial report of the Group. Moreover, certain scenarios considered in the current strategic plan will be further analyzed prior to deciding their
implementation, and projects resulting from those studies will be submitted to relevant legal bodies including to employee representatives bodies if applicable and when needed. 11
11FOCUS &
ADAPT Transformation plan
Squad turnaround forces transforming Data into Actions and Actions into Results.
CASE STUDY – European Activities – 2014-2016
€ The transformation project is split into Business Units that correspond to
existing profit centers.
Make KPIs simple: EBITDA, OWC, FCF What has been done?
Rethink business portfolio
Reduce complexity, enhance density
The mission is organized in project mode for 12 to18 months with a weekly Break silos, become systemic, and holistic
tempo under direct supervision Nexans top management.
Results
A task force fully dedicated to support and drive the transformation is 10 Business Units have been covered between
being deployed on sites. Composed of consultants & Nexans leaders. December 2014 and December 2016 on a Sales
perimeter of 0,9Bn€ (Constant metal prices) :
• An additional 20M€ EBITDA has been generated in
2016 vs. 2014.
More than 30 transformation levers have been codified and adapted to • The OWC decreased of 70M€ on the period.
the cable industry covering sales, logistics and operations into a holistic
approach.
The current strategic plan and the initiatives it describes are based on assumptions and scenarios used as hypothesis upon which the attached document is based. These assumptions and scenarios are exposed to all risk factors and main uncertainties
described in the 2017 Registration document and in the 2018 Half-year financial report of the Group. Moreover, certain scenarios considered in the current strategic plan will be further analyzed prior to deciding their implementation, and projects
resulting from those studies will be submitted to relevant legal bodies including to employee representatives bodies if applicable and when needed.
12
12FOCUS &
ADAPT Transformation plan
We will stick with a time-tested approach that generates big returns from dramatic improvements
in operations.
Since 2014 HY 2018 2019 2020
Building & Deployed on 5 6 Business Units 14 Business Units 6 Business Units
Territories Business Units covered covered covered The full
transformation
program targets a
contribution of
Deployed on 2 100M€ EBITDA
Telecom & Data 1 Business Units 1 Business Units
Business Units covered covered and 190M€ OWC
reduction by 2021
Estimate is based
Industry & on the results of
Deployed on 3 2 Business Units 2 Business Units
Solutions Business Units covered covered our ‘financial
stress test’ ran in
Q3 2018, and
our past
The Land HV business unit is currently going through a special experiences.
High Voltage &
Projects transformation plan, covering sales, OWC and industrial
performance
The current strategic plan and the initiatives it describes are based on assumptions and scenarios used as hypothesis upon which the attached document is based. These assumptions and scenarios are exposed to all risk factors and main uncertainties
described in the 2017 Registration document and in the 2018 Half-year financial report of the Group. Moreover, certain scenarios considered in the current strategic plan will be further analyzed prior to deciding their implementation, and projects
resulting from those studies will be submitted to relevant legal bodies including to employee representatives bodies if applicable and when needed.
13
13ADAPT New management routines, new kpi, Central control tower
Accountability for results
Switch the culture from Understanding to Acting
Foster a results-oriented mindset by creating repeatable processes that
spur performance improvements again and again.
Develop managers hard skills on turnaround practices
Indicators & targets
Stronger weighting of ROCE & Free cash flow
Adapt KPIs to the business cluster (Growth vs. Turnaround)
Align management variable remuneration
Pace & routines
Increase the pace: from quarterly routines to monthly & weekly ones
Actions & projects linked to financial result
Increase routine frequency when results deviate from target
Central control tower to lead and monitor weekly all initiatives
The current strategic plan and the initiatives it describes are based on assumptions and scenarios used as hypothesis upon which the attached document is based. These assumptions and scenarios are exposed to all risk factors and main uncertainties
described in the 2017 Registration document and in the 2018 Half-year financial report of the Group. Moreover, certain scenarios considered in the current strategic plan will be further analyzed prior to deciding their implementation, and projects 14
14
resulting from those studies will be submitted to relevant legal bodies including to employee representatives bodies if applicable and when needed.CSR as a value creation lever
Our TOP 4 priorities
Safety
Ensure health and safety at sites CSR ranking 2014 2017
C+
Leverage safety rules enforcement to reinforce our discipline in execution D
‘Prime’
D B
Trainings
63/100 2017: 72/100
Build people who build business
Reinforce Nexans employees hard skills (finance, sales & marketing, lean manufacturing)
KPI Target 2021
Energy transition Safety
Engage with customers to contribute to a more sustainable economy Workplace accident frequency rateTransforming Nexans’ Value Delivery Model
A financial New Deal
162 0 1 8 - 2 0 2 1 B r i dge
Overall Trajectory – Waterfall from Baseline to 2021 EBITDA
EBITDA
In million €
500
55
100
~ 325
190 210
2018E Price cost squeeze Cost reduction Transformation Plan Organic Growth 2021P
& labor inflation initiatives & Value Growth
Initiatives
EBITDA: Operating Margin (OM) before depreciations ROCE: 12months on end-of-period capital employed restated for antitrust provisions. Yearly depreciation amounting to approximately
140M€ in 2018 and 150M€ beyond, Operating Margin can be computed accordingly.
The current strategic plan and the initiatives it describes are based on assumptions and scenarios used as hypothesis upon which the attached document is based. These assumptions and scenarios are exposed to all risk factors and main uncertainties
described in the 2017 Registration document and in the 2018 Half-year financial report of the Group. Moreover, certain scenarios considered in the current strategic plan will be further analyzed prior to deciding their implementation, and projects 17
resulting from those studies will be submitted to relevant legal bodies including to employee representatives bodies if applicable and when needed.2 0 1 8 - 2 0 2 1 t r aj e ct o r y
EBITDA 500
In million €
350 to 390
~ 325
FY18E FY19P FY20P FY21P
Transformation Plan 20-30% 60-70% 100%
Actions
financial Organic growth & value growth init. 5-15% 55-65% 100%
impact
(Cumulated
% of 2021 Cost reduction init. 30-40% 60-70% 100%
Run Rate)
Price cost squeeze & labor inflation 33% 66% 100%
EBITDA: Operating Margin (OM) before depreciations ROCE: 12months on end-of-period capital employed restated for antitrust provisions. Yearly depreciation amounting to approximately 140M€ in
2018 and 150M€ beyond, Operating Margin can be computed accordingly.
The current strategic plan and the initiatives it describes are based on assumptions and scenarios used as hypothesis upon which the attached document is based. These assumptions and scenarios are exposed to all risk factors and main uncertainties
described in the 2017 Registration document and in the 2018 Half-year financial report of the Group. Moreover, certain scenarios considered in the current strategic plan will be further analyzed prior to deciding their implementation, and projects
resulting from those studies will be submitted to relevant legal bodies including to employee representatives bodies if applicable and when needed. 182 0 1 8 - 2 0 2 1 t r aj e cto ry
ROCE 15.5%
Before taxes
9% to 11%
8.5%
FY18E FY19P FY20P FY21P
Sales ~3% CAGR
Constant metal prices 4.4 Bn€
FY18E FY19P FY20P FY21P
EBITDA: Operating Margin (OM) before depreciations ROCE: 12months on end-of-period capital employed restated for antitrust provisions. Yearly depreciation amounting to approximately 140M€ in
2018 and 150M€ beyond, Operating Margin can be computed accordingly.
The current strategic plan and the initiatives it describes are based on assumptions and scenarios used as hypothesis upon which the attached document is based. These assumptions and scenarios are exposed to all risk factors and main uncertainties
described in the 2017 Registration document and in the 2018 Half-year financial report of the Group. Moreover, certain scenarios considered in the current strategic plan will be further analyzed prior to deciding their implementation, and projects
resulting from those studies will be submitted to relevant legal bodies including to employee representatives bodies if applicable and when needed.
192 0 1 8 - 2 0 2 1 t r aj e cto ry
Cumulated Free Cash Flow 2019P-2021P
Before dividends and M&A
1.3 to 1.4Bn€
>200M€
EBITDA CAPEX Delta OWC Delta OWC Cost reduction CF Before Taxes Cash Debt interest Cumulative CF2
(Growth) (Transf.) One-offs & Interest Taxes & pensions1
• Cost reduction one-offs estimated at ~250M€ on the period will be self financed within 2 years.
• CAPEX : Includes 400M€ focused on a limited number of Profit Drivers segment initiative such as Aurora new HV subsea boat and North
America
EBITDA: Operating Margin (OM) before depreciations ROCE: 12months on end-of-period capital employed restated for antitrust provisions. Yearly depreciation amounting to approximately 140M€ in
2018 and 150M€ beyond, Operating Margin can be computed accordingly.
The current strategic plan and the initiatives it describes are based on assumptions and scenarios used as hypothesis upon which the attached document is based. These assumptions and scenarios are exposed to all risk factors and main uncertainties
described in the 2017 Registration document and in the 2018 Half-year financial report of the Group. Moreover, certain scenarios considered in the current strategic plan will be further analyzed prior to deciding their implementation, and projects
resulting from those studies will be submitted to relevant legal bodies including to employee representatives bodies if applicable and when needed.
20Conclusion 21
Wa l k t h e t a l k
The communication agenda on our initiatives

                                                                                                                                                                           TRANSFORM OUR POSITIONING

    TRANSFORM OUR OPERATIONAL MODEL

Full Year 2018 results                                     Half Year 2019 results                                    Full Year 2019 results                                     Half Year 2020 results

   New group operational organization

                                                              Cost reduction initiatives – Follow up and results

                                                             SHIFT– Status and results

                                                                                                                       Transform Our Positioning – Strategic update

The current strategic plan and the initiatives it describes are based on assumptions and scenarios used as hypothesis upon which the attached document is based. These assumptions and scenarios are exposed to all risk factors and main
uncertainties described in the 2017 Registration document and in the 2018 Half-year financial report of the Group. Moreover, certain scenarios considered in the current strategic plan will be further analyzed prior to deciding their
implementation, and projects resulting from those studies will be submitted to relevant legal bodies including to employee representatives bodies if applicable and when needed.                                                            22
Transforming Nexans’ value delivery model
Fact based Comprehensive review
Snapshot We have gone deeper than ever before to understand our strengths and weaknesses
building a view of the Nexans’ future based on a clear understanding of where we can
succeed and how we must change to get there.
Sequential Continued Transformation Focus
Transformation We have a clear, concise and actionable plan forward rooted on the past success of SHIFT. The
turnaround we proved for 50% of Nexans’ will now be the focus for the rest of the company as
we ramp up our value drivers delivering cash and building our future potential. Changing the
company culture and structure from one of understanding to acting.
Future proof Future based on customer success
Delivering on a future not based on wishful thinking but on the fundamental market trends
Positioning driving our customers of today and those of tomorrow. Constructed on the market megatrends
that spell out the future growth cycles, Nexans’ after its transformation will be uniquely
positioned to drive customer and shareholder value.
The current strategic plan and the initiatives it describes are based on assumptions and scenarios used as hypothesis upon which the attached document is based. These assumptions and scenarios are exposed to all risk factors and main uncertainties
described in the 2017 Registration document and in the 2018 Half-year financial report of the Group. Moreover, certain scenarios considered in the current strategic plan will be further analyzed prior to deciding their implementation, and projects 23
resulting from those studies will be submitted to relevant legal bodies including to employee representatives bodies if applicable and when needed.You can also read