Sustainable Thematic Investing - Institutional Money
←
→
Page content transcription
If your browser does not render page correctly, please read the page content below

Sustainable Thematic Investing
Giles Money
Lead Portfolio Manager

For institutional investors only

Germany
February 2019

This presentation is not intended for private investors or end clients and may not be passed
on to third parties without the consent of J. Safra Sarasin (Deutschland) GmbH.

                                                                                          1
Global Growth Rates will not be as high as in the
past!

   We forecast a slowdown of Global Growth from 7.5% to 3.5%

                                     GDP growth
                                     (annual rate)

                                                                          GDP growth
                                                                          (10 year moving
                                                                          average)

                                                                                                                                    Average           7.5%
                                                                                                                                                      3.5%
    0

     1960      1965      1970      1975      1980      1985      1990      1995      2000       2005      2010      2015      2020e 2025e 2030e

Source: Macrobond, Sarasin & Partners LLP, November 2018. Information containing forecasts are intended for information purpose only and are neither
projections nor guarantees for future results and could differ significantly for various reasons from actual performance. Past GDP growth rates are no indication
of current or future GDP growth rates.
                                                                                                                                                                    2
As Average Company Profits Growth Slows, a Greater
Proportion of Companies Face Growth Challenges
 Historic distribution                                                              Future returns
Company profits growth                                                             More companies with falling profits
5 Year Profits Growth, Annualised – Global Average 7.6%                            5 Year Profits Growth, Annualised – Estimated Global
since 19701                                                                        Average 3.5%2
                                                                                                                                    The distribution
                    250                                                                                      250                    moves left as
                                                                                                                                    global growth
                                                                                                                                    slows – more
                    200                                                                                      200
                                                                                                                                    companies with
                                                                                                                                    falling profits or
                                                                                                                                    growth challenges
                    150                                                                                      150

   17% of                                                                               28% of
 companies          100                                                                companies             100
 with falling                                                                          with falling
   profits                                                                               profits
                     50                                                                                       50

                   0                                                                                         0
   -25 -20 -15 -10 -5       0    5   10 15 20 25 30 35 40 45                             -30 -25 -20 -15 -10 -5      0   5 10 15 20 25 30 35 40 45

Sarasin & Partners LLP, November 2018 – Model uses data from US S&P 500, all 5 year periods since 2004. Past performance is no indication of current or
future performance. Information containing forecasts are intended for information purpose only and are neither projections nor guarantees for future results and
could differ significantly for various reasons from actual performance 1) Bloomberg/MSCI ACWI Data 2) Assumes future global profits growth in line with global
GDP growth forecast, as of November 2018
                                                                                                                                                                   3
Investors Underestimate Compounding Returns
Company A is on 20x PE “Compound interest is
and grows earnings 15% for the eighth wonder of
10 years. After those 10 the world. He who
years we value it at 10x PE understands it, earns
it ... he who doesn't ...
Company B is on 10x PE pays it.”
and grows its earnings 5%
for 10 years. After those 10 Albert Einstein
years we value it at 10x PE
Which has given you the
best return?
Picture: Bing.com, royalty free picture for commercial use
4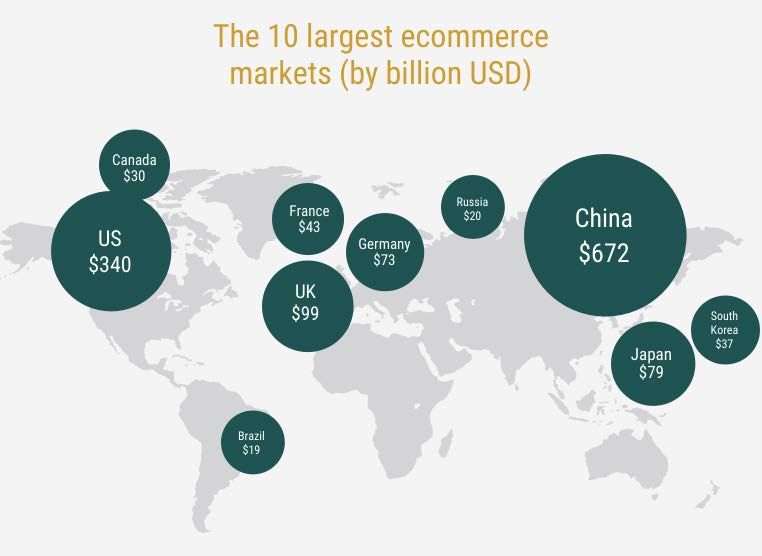
We are Assessing Growth Potentials

                                                                                                                                 Electric Vehicles

                                                                                                                                 Mobile Data

                                                                                                                                 Cloud - Remote computing & Storage (Infrastructure as a
                                                                                                                                 Service)
                                                                                                                                 Fixed Internet

                                                                                                                                 Ecommerce Sales

                                                                                                                                 Cloud - (Software as a Service)

                                                                                                                                 Digital Advertising

                                                                                                                                 Healthcare IT Spend

                                                                                                                                 Surgical Operations

                                                                                                                                 Electronic Payment Volumes

                                                                                                                                 Generic Drugs EM

                                                                                                                                 Generic Drugs DM

                                                                                                                                 Healthcare Spending Non OECD

                                                                                                                                 Health Insurance

                                                                                                                                 Total Air Passengers

                                                                                                                                 Smartphone handset shipments

                                                                                                                                 Spectacles/ Hearing Aids/Teeth

                                                                                                                                 Healthcare Spending OECD

                                                                                                   3.5% p.a.                     Renewable Energy Share of EU power generation

                                                                                                                                 Over 65 World Population

                                                                                                                                 Combustion-Engine Light Vehicle Sales

                                                                                                                                 Wildlife Population

                                                                                                                                 Software on-premises

                                                                                                                                 Computer Hardware ex-Devices

     2016       2017       2018       2019      2020       2021       2022       2023       2024       2025       2026           Newspaper & Magazine Advertising

Source: Sarasin & Partners LLP. Forecasts and multiple industry sources, November 2018, further details available upon request. Information containing
forecasts are intended for information purpose only and are neither projections nor guarantees for future results and could differ significantly for various reasons
from actual performance. Past performance is no indication of current or future performance.
                                                                                                                                                                                      5
We are Assessing Growth Potentials

                                                                                 Electric Vehicles

                                                                                 Mobile Data

                                                                                 Cloud - Remote computing & Storage (Infrastructure as a
                                                                                 Service)
                                                                                 Fixed Internet

                                                                                 Ecommerce Sales

                                                                                 Cloud - (Software as a Service)

                                                                                 Digital Advertising

                                                                                 Healthcare IT Spend

                                                                                 Surgical Operations

                                                                                 Electronic Payment Volumes

                                                                                 Generic Drugs EM

                                                                                 Generic Drugs DM

                E-Commerce!                                                      Healthcare Spending Non OECD

                                                                                 Health Insurance

                                                                                 Total Air Passengers

                                                                                 Smartphone handset shipments

                                                                                 Spectacles/ Hearing Aids/Teeth

                                                                                 Healthcare Spending OECD

                                                                 3.5% p.a.       Renewable Energy Share of EU power generation

                                                                                 Over 65 World Population

                                                                                 Combustion-Engine Light Vehicle Sales

                                                                                 Wildlife Population

                                                                                 Software on-premises

                                                                                 Computer Hardware ex-Devices

  2016   2017   2018   2019   2020   2021   2022   2023   2024     2025   2026   Newspaper & Magazine Advertising

                                                                                                                                      6
Global E-Commerce Sales Are Growing…

  Retail E-Commerce Sales (in USD trillion)
 $6

 $5

 $4

 $3

 $2

 $1

 $0
               2015                 2016                 2017                 2018*                2019*                 2020*                2021*

Source: Emarketer, Survey March 2018, *Forecast. Information containing forecasts are intended for information purpose only and are neither projections nor
guarantees for future results and could differ significantly for various reasons from actual performance.
                                                                                                                                                              7
…They Are Replacing Traditional Retail Sales…

 Estimated Annual U.S. 2016                                                      E-commerce share of total
 Retail Trade Sales1                                                             global retail sales (2015 – 2021)2

                                                                                                                                                      17,5%

                                                                                                                                           15,5%
                                                                                                                               13,7%
                                                                                                                    11,9%
                                                                                                        10,2%
        Motor vehicle and parts dealers
        Furniture and home furnishings stores                                                 8,6%
        Electronics and appliance stores                                           7,4%
        Building mat. and garden equip. and supplies dealers
        Food and beverage stores
        Health and personal care stores
        Gasoline stations
        Clothing and clothing access. Stores
        Sporting goods, hobby, musical instrument, and book stores
        General merchandise stores
        Miscellaneous store retailers
        Nonstore retailers                                                        2015 2016 2017 2018* 2019* 2020* 2021*
        Ecommerce
1) US Census Bureau, Annual Retail Trade Survey: 2016, 21 March 2018
2) Source: Emarketer, Worldwide Retail and Ecommerce Sales, January 2018
 *Forecast. Information containing forecasts are intended for information purpose only and are neither projections nor guarantees for future results and could
differ significantly for various reasons from actual performance.
                                                                                                                                                                 8
….Globally and Consistently

                                                                                           E-commerce sales CAGR forecast in
                                                                                           selected countries from 2018 to 20222
                                                                                                       India                                  19,9%
                                                                                                  Indonesia                                17,7%
                                                                1
                                                                                               South Africa                           13,7%
                                                                                                     Mexico                          12,6%
                                                                                                     Turkey                         12,0%
                                                                                                      China                         12,0%
                                                                                                  Argentina                        11,4%
                                                                                              Saudi Arabia                         11,3%
                                                                                                      Brazil                      10,7%
                                                                                                     Global                      9,6%
                                                                                                      Spain                     9,1%
                                                                                                   Australia                    8,8%
                                                                                                     France                    8,5%
                                                                                              United States                    8,3%
                                                                                                    Canada                    7,9%
                                                                                               South Korea                   7,0%
                                                                                                   Germany                  6,5%
                                                                                                      Japan                6,2%
                                                                                                         UK                5,8%

1) Business.com, https://www.business.com/articles/10-of-the-largest-ecommerce-markets-in-the-world-b/, 22 February 2017
2) Statista Digital Market Outlook, April 2018. CAGR: Compound Annual Growth Rate.

                                                                                                                                                  9
Amazon’s impressive E-Commerce Platform

Increasing market share could reach 50% by 2021!

      60%

                                                                                                                                            50%
      50%                                                                                                           47%
                                                                                             45%
                                                                     41%
      40%                                     37%
                       34%
      30%

      20%

      10%

        0%
                       2016                    2017                  2018*                   2019*                  2020*                  2021*

Source: Furtune Magazin, April 2017, Survey by Needham & Company. *Forecast. Information containing forecasts are intended for information purpose only
and are neither projections nor guarantees for future results and could differ significantly for various reasons from actual performance.
                                                                                                                                                          10
Amazon’s impressive E-Commerce Platform
Web Business
Big Data
Applications Applications
Source: https://aws.amazon.com/economics/learn-more/, retrieved 18.01.2019
11Amazon’s impressive E-Commerce Platform
Net sales revenue of Amazon from 2004 to 2017 (in billion U.S. dollars)
$180
$160
$140
$120
$100
$80
$60
$40
$20
$0
2008 2009 2010 2011 2012 2013 2014 2015 2016 2017
Source: Amazon.com Annual Report, February 2018
12We are Assessing Growth Potentials
Electric Vehicles
Mobile Data
Cloud - Remote computing & Storage (Infrastructure as a
Service)
Fixed Internet
Ecommerce Sales
Cloud - (Software as a Service)
Digital Advertising
Healthcare IT Spend
Surgical Operations
Electronic Payment Volumes
Generic Drugs EM
Generic Drugs DM
Surgeries! Healthcare Spending Non OECD
Health Insurance
Total Air Passengers
Smartphone handset shipments
Spectacles/ Hearing Aids/Teeth
Healthcare Spending OECD
3.5% p.a. Renewable Energy Share of EU power generation
Over 65 World Population
Combustion-Engine Light Vehicle Sales
Wildlife Population
Software on-premises
Computer Hardware ex-Devices
2016 2017 2018 2019 2020 2021 2022 2023 2024 2025 2026 Newspaper & Magazine Advertising
13Demographics are changing…
Global Fertility Rate and Median Global Age (1990 – 2100)
45 3,1
2,9
40
2,7
35 2,5
2,3
30 2,1
1,9
25
1,7
20 1,5
1990 1995 2000 2005 2010 2015 2020* 2025* 2050* 2075* 2100*
Median Global Age Global Fertility
Source: United Nations, World Population Prospects: The 2017 Revision, as of June 2017. *Forecast. Information containing forecasts are intended for
information purpose only and are neither projections nor guarantees for future results and could differ significantly for various reasons from the actual.
14More People undergo Surgeries!
Total Knee Replacement
Surgeries in the US:
673% 3.5m
increase procedures
by 2030 p.a.
Source: Cisternas MG, MGC Data Svcs, Murphy L, Croft JB, Helmick CG. Racial Disparities in Total Knee Replacement among Medicare Enrollees — United
States, 2000–2006. MMWR 2009;58(6):134-8
*Forecast. Information containing forecasts are intended for information purpose only and are neither projections nor guarantees for future results and could
differ significantly for various reasons from the actual
15Investment Analysis: Smith & Nephew
Hips and Knees
Sources : Company Data, Bank J. Safra Sarasin Ltd., Jan 2019.
The company presented is provided for illustrative purposes only as an example. The example given does not take into account the individual circumstances of any
individual investor and thus does not constitute a request or offer, solicitation or recommendation to buy or sell shares or other financial instruments issued by or related
to the companies mentioned. The example should not be considered as a substitute for individual advice and risk disclosure by a qualified financial, legal or tax advisor.
16Key to Success: combining Sustainability with
Thematic Investing
Sustainable We look for quality!
8000 2000 Bank J. Safra Sarasin Sustainability
Matrix®
Universe Creation
Thematic We look for growth
2000 300 Long-term trends and opportunities
Idea Generation
Active Quality Growth
300 40 Companies with strong quality growth
deliver compounding returns
Portfolio construction
17The Team
Global Thematic Equity Analysts/Portfolio Managers
Neil Denman Alex Hunter Julian Bishop Josh Sambrook Rolando Rodrigues Jeneiv Shah Alex Cobbold Alex Bibani
(17) (28) (22) Smith (11) (21) (12) (30) (15)
Stewardship Analysts Strategy
Lead Portfolio Manager
Natasha Landell- Dominic Burke Guy Monson Subitha Subramaniam
Mills (23) (6) (34), CIO (20), Chief Economist
Giles Money Jerry Thomas
(14), OekoSar Fund Manager (21), Head of Global Equities
Sustainability Research
Kwai San Wong Henry Boucher
(8) (34), Head of ISG
Dr. Jan Poser Agnes Neher, Andrea Weber Guillaume Alexandros Sebastian Wiesel Sasha Nikolaus
(20) PhD (6) (5) Krepper (5) Gratsias (7) (6) Cisar (9)
(overall business experience in years), as of 2018
18Typical Characteristics of a Sustainable and
Thematic Equity Strategy
Comparison vs. MSCI World Sustainability: Carbon Footprint
140
Others
120 Financials
Information Technology
100
tCO2 / $M Invested
Ratio* Portfolio MSCI World Telecommunication
Services
Return on Common Health Care
15.1% 13.3% 80
Equity
Consumer Staples
EBITDA Growth 27.2% 17.5% 60
Consumer Discretionary
Real Estate
Total Debt to Common 86.4% 142.1%
Equity 40 Industrials
*All figures refer to the trailing 12 months. Energy
20 Materials
Utilities
0
Oekosar MSCI World
Source: Bank J. Safra Sarasin Ltd as at 22.01.2019, Bloomberg; Past information is intended for information purpose only and is neither a projection nor a
guarantee for future results, and could differ significantly for various reasons from actual performance.
19How do We Differentiate?
We build a portfolio that has exposure to 3 distinct styles (risk buckets)
High Quality Growers Opportunistically Special Situations
50-100% weight Contrarian 0-25% weight
0-25% weight
20Solid and Sustainable Portfolio
Gross performance since inception1) Portfolio construction
300 Concentrated portfolio
– 40-60 positions
250
– Long only
– Low risk budget on top-down decisions
200
All Cap company focus
Expected Tracking Error 3-5%
150
Distinctive strategy
100
Multi-disciplined approach to finding thematic
opportunities globally
50
We focus on high due diligence stock picking
with significant in-house research and fully
0 integrated ESG2) analysis
Target companies with strong management
JSS OekoSar Equity - Global (gross) EUR dist teams and quality business models at
MSCI World NR attractive prices
1) Source: Bank J. Safra Sarasin Ltd., as of 31.12.2018. Gross performance figures before all fees, expenses and taxes. The value of the investments can fall as well as rise
and investors many not get back the amount originally invested. Past performance is not a guide to future returns and may not be repeated. The performance data do not
take account of the commissions and costs incurred on the issue and redemption of units.
2) Environment, Social and Governance
21Strong Historical Performance Compared to Peers
Comparison of fund relative to eVestment Global All Cap Core Equity peer group
25,00
Top Quartile
20,00
2rd Quartile
15,00
3rd Quartile
Return (%)
10,00
Bottom Quartile
5,00
0,00
JSS OekoSar
Equity - Global (P
-5,00 EUR Dist in USD,
gross return)
YTD 1Y 2Y 3Y 4Y 5Y
Source: eVestment Global All Cap Core Equity as at 30.09.2018 (updated quarterly). Peer group shows 5%-95% percentile. Past Performance is no indicator or
guarantee for current or future performance.
22The Power of Thematic Sustainable Investing!
Low Carbon Future
Demographics Innovation
Source: Bing.com, royalty free pictures for commercial use. Brands shown are for illustrative purpose only and the companies shown may or may not be part of
an investment portfolio.
23Thank you for your attention
24Important Information (Germany) I/II
This marketing publication/information has been prepared by J. Safra Sarasin (Deutschland) GmbH, Kirchnerstraße 6-8, 60311
Frankfurt am Main, for information purposes only and does not lodge claim to completeness of product characteristics. It does not
constitute an offer or a recommendation to buy or sell financial instruments and does not replace the essential step of seeking advice
and information from your personal advisor about the risks involved – which we recommend you do before making any investment
decision. To the extent that future performances are depicted in this presentation, these and/or related recommendations are based,
among other things, on forecasts of the future financial market trend and corresponding simulations. These forecasts and simulations
are in turn based primarily on experience and specific past performance data. We would therefore like to point out explicitly that
historic performance data, forecast calculations and other simulations are not a reliable indicator of future performance. We can
therefore not provide any guarantee that the values forecast in the model calculations will materialize. Commissions, costs and taxes
borne by client have an adverse impact on the performance of this financial instrument. Investments in foreign currencies do have an
additional exposure to currency risk by what the return in the investor's reference currency may increase or decrease due to currency
fluctuations.
The prospectus, the key investor information and the annual and semi-annual reports of JSS Investmentfonds SICAV are available
on request free of charge from J. Safra Sarasin (Deutschland) GmbH, Kirchnerstraße 6-8, 60311 Frankfurt am Main in English and
German language.
To the extent that indicative investment options or portfolio structures are included, the following applies:
The indicative investment options or portfolio structures presented in these documents and the underlying model calculations are
based on the information and data provided to us in the context of the asset advisory discussion, and we have not checked them for
accuracy or completeness. The indicative investment option/portfolio structure described here is thus intended as a guide and does
not make any claim to comprehensive suitability but aims to inform you about the general possibilities that an investment entails. In
order to provide you with a final investment recommendation that is tailored to your specific situation, we need further information, in
particular on your investment goals, risk tolerance, experience and knowledge of financial services and products and your financial
situation.
The products recommended in our action plan are always based on the latest prices and terms, although these may change daily.
This also applies to the investment proposals and specimen portfolios included in this presentation, which may become null and void
at short notice as a result of market developments and are thus of a short-lived nature only. For a complete description of the
characteristics of the products mentioned in this presentation and a comprehensive description of the advantages and disadvantages
as well as chances and risks associated with them, please see the prospectuses on which said products are based. We will be
pleased to send you them upon request.
25Important Information (Deutschland) II/II
These documents and the indicative investment options or portfolio structures they contain were prepared on the basis of the
currently valid (tax) laws. The validity of the information is thus limited to the time at which this presentation was drawn up. Changes
in the law, economic conditions or other factors may affect future performance in a way that is not in line with the representations we
make (especially as regards returns or taxes). Please consult a tax expert or lawyer if you have specific questions about taxes or
legislation
Even if this document was produced with the greatest of care, from data sources that we rate as reliable and to the best of our
knowledge and belief we and the related companies provide no guarantee with regard to its content and completeness. Liability as a
result of willful intent and gross negligence is not affected. If nothing is indicated to the contrary, all figures are not audited.
The information provided in this publication for clients domiciled or having their registered office in Germany is directed exclusively at
institutional clients who intend to conclude investment business exclusively as entrepreneurs for commercial purposes. This clientele
is limited to credit and financial services institutions, capital management companies and insurance companies, provided that they
have the necessary permission for the business operation and are subject to supervision, as well as medium and large corporations
within the meaning of the German Commercial Code (section 267 (2) and (3) HGB).
Persons domiciled or nationalized in the USA are not permitted to purchase and/or hold units of JSS Investmentfonds SICAV funds
and it is prohibited to publicly offer, issue or sell them to persons with nationality or domicile USA. This publication is intended for
investors in Germany only.
The entire content of these documents is protected by copyright (all rights reserved). The use, modification or reproduction of parts or
all of the documents is permitted for private, non-commercial use only. However, any notes relating to the copyright or brand names
may not be changed or removed. Any other use requires the prior written consent of Bank Sarasin AG. This is also valid for the
transmission of this publication. Furthermore, our General Terms and Conditions apply. You may obtain these at any branch or have
them sent to you upon request.
© Bank J. Safra Sarasin (Deutschland) GmbH, Kirchnerstraße 6-8, 60311 Frankfurt
26You can also read