1Q2021 Results Presentation - Capturing Strategic Development Opportunities Continuing to Enhance Lean Operations

Page created by Maurice Day
 
CONTINUE READING
1Q2021 Results Presentation - Capturing Strategic Development Opportunities Continuing to Enhance Lean Operations
1Q2021
Results Presentation

Capturing Strategic Development Opportunities
Continuing to Enhance Lean Operations

 April 27, 2021
1Q2021 Results Presentation - Capturing Strategic Development Opportunities Continuing to Enhance Lean Operations
Agenda

         1   Recovery & Stable Dividend Policy

         2    Financial Highlights

         3    Operational Review

         4    Strategy & Outlook

         5    Appendix
1Q2021 Results Presentation - Capturing Strategic Development Opportunities Continuing to Enhance Lean Operations
Agenda

         1   Recovery & Stable Dividend Policy

         2    Financial Highlights

         3    Operational Review

         4    Strategy & Outlook

         5    Appendix
1Q2021 Results Presentation - Capturing Strategic Development Opportunities Continuing to Enhance Lean Operations
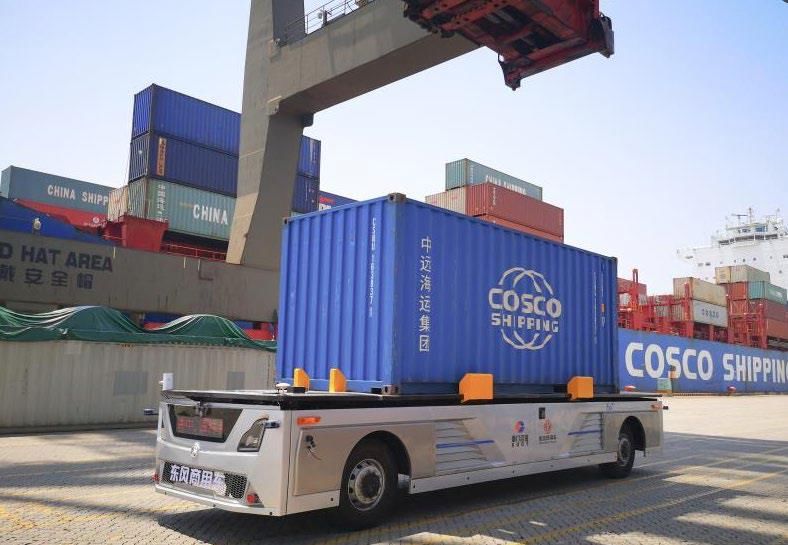
Outstanding 1Q2021 Performance with Strong YoY Growth Momentum

  ➢ 1Q21 equity throughput recorded a YoY increase of 7.2% to 9.3 million TEU, maintaining recovery momentum
  ➢ 1Q21 terminal profit posted a robust YoY growth of 76.2% to USD 93.9 million, the strongest quarterly YoY
    growth since 1Q2020

                   Equity Throughput(in TEU)                                       Terminal Profit(USD)
                                                                 100.0
   10.5                      10.3M                      30.0%                              93.7M             93.9M
                                      10.1M                                                                           105.0%
                                                        25.0%     90.0            82.4M                      +76.2%
   10.0                                                                                             80.1M     YoY     85.0%
                                                        20.0%     80.0
                    9.4M                                                                            +35.2%            65.0%
    9.5                                        9.3M     15.0%                                        YoY
                                                                  70.0                     +14.4%                     45.0%
                                               +7.2%                                        YoY
    9.0   8.7M                                  YoY     10.0%                                                         25.0%
                                      +1.3%                       60.0   53.3M
                              -0.7%    YoY                                        -22.5%
                                                        5.0%                                                          5.0%
    8.5                        YoY                                                  YoY
                                                                  50.0
                     -6.5%                              0.0%             -45.2%                                       -15.0%
           -6.6%
    8.0               YoY                                         40.0     YoY
            YoY                                         -5.0%                                                         -35.0%

    7.5                                                 -10.0%    30.0                                                -55.0%
          1Q2020    2Q2020   3Q2020   4Q2020   1Q2021                    1Q2020   2Q2020   3Q2020   4Q2020   1Q2021

                                                                                                                               4
1Q2021 Results Presentation - Capturing Strategic Development Opportunities Continuing to Enhance Lean Operations
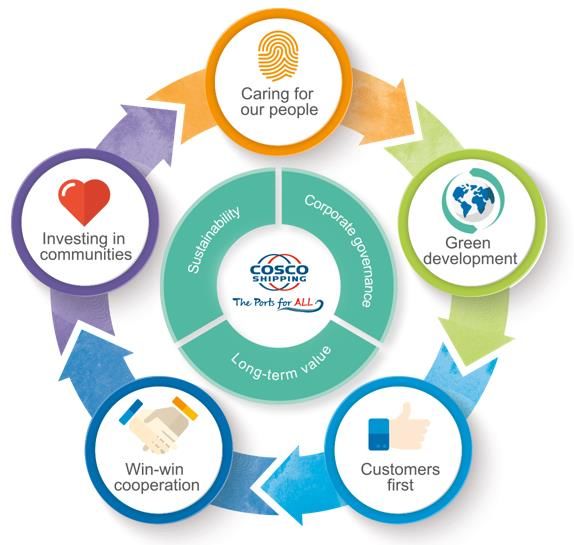
Highest 1Q Terminal Profit & Terminal Profit per TEU since 2016

      ➢ In 1Q2021, we have achieved the highest 1Q terminal profit as well as the highest 1Q terminal profit per TEU
        on the back of our lean operation strategy and macro environment improvement

                                    Terminal Profit (USD)                                                   Terminal Profit per TEU (USD) (2)

           100.0                                                                              11.0
                                                                                     93.9M
                                                                                                                                                        10.1
             90.0                               82.6M                                         10.0
                                                          78.2M (1)                                                       9.6
             80.0
                                                                                               9.0                                      (1)
                                                                                                                                  8.4
             70.0                                                                                     7.9
                                                                                               8.0
             60.0      54.8M
                                                                        53.3M
                                   48.1M                                                       7.0               6.6
             50.0
                                                                                                                                               6.1
             40.0                                                                              6.0

             30.0                                                                              5.0
                       1Q2016      1Q2017      1Q2018       1Q2019      1Q2020      1Q2021           1Q2016    1Q2017   1Q2018   1Q2019       1Q2020   1Q2021
Note:
(1) Excluding USD 18.9 million of fair value gain from Beibu Gulf Port in 1Q2019.                                                                               5
(2) Terminal profit per TEU is calculated by dividing terminal profit by equity throughput.
1Q2021 Results Presentation - Capturing Strategic Development Opportunities Continuing to Enhance Lean Operations
Sustainable High Dividend Yield and Long-term Investment Value
  ➢ We have confidence of being the best yield play within this industry

                                                                       Dividend Yield (1)
                                                                             1199         Peers Average

                                                                                        5.3%
                                                                                                                    4.9%                         5.4%
                                    4.3%                                                                                                         5.0%
                                                              4.2%
                                                                                        5.2%

                                   4.1%                                                                          4.1%
                                                            3.7%

                                   2016                      2017                       2018                      2019                      2020
 Notes:
 (1) COSCO SHIPPING Ports’ dividend yield is calculated: dividend divided by its closing price as at 16/4/2021. And peers (China Merchants Ports, Qingdao Port, Tianjin Port, Xiamen
     Port and Dalian Port) average is calculated: dividend of each company divided by its closing price as at 16/4/2021 and then taken by the average of 5 companies.                  6
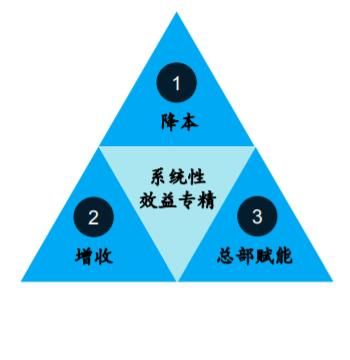
1Q2021 Results Presentation - Capturing Strategic Development Opportunities Continuing to Enhance Lean Operations
Agenda

         1   Recovery & Stable Dividend Policy

         2     Financial Highlights

         3     Operational Review

         4     Strategy & Outlook

         5     Appendix
Financial Highlights – Strong Profitability in 1Q2021

          (US$ million, unless stated otherwise)                                                      1Q2020               1Q2021    YoY Change (%)
          Revenue                                                                                      220.5                 265.3       +20.3
          Cost of sales                                                                                174.9                 203.4       +16.2
          Gross profit                                                                                  45.6                 61.9        +35.9
          Share of profits from Joint Ventures & Associates                                             52.3                 81.0        +54.8
          Net profit attributable to shareholders                                                       91.9                 73.0        -20.5
          EPS (US cents)                                                                                2.91                 2.20        -24.4
          Net profit attributable to shareholders (Excluding one-off items) (1)                         30.4                 73.0      +140.1
          EPS (US cents) (Excluding one-off items) (1)                                                  0.96                 2.20      +129.2

          Notes:
          (1) Excluding 1Q2020 after-tax gain of USD$61.5M on disposal of interest in Yangzhou Terminal and Zhangjiagang Terminal.

                                                                                                                                                      8
Revenue & Costs – Solid 1Q2021 Revenue Growth & Cost Control in the Greater China Region

                     Revenue (US$ million)                                                              Cost of sales (US$ million)

                                       265.3
                                                                                                                               203.4
                                               2.2%
                                                                                                                                        4.6%
                                                3.1%                                                     174.9
                    220.5                                       CSP Abu Dhabi                                                              3.2%
            2.7%                                4.3%                                            4.7%
                                                                Nantong                                                                    4.3%
            2.6%                       27.2%                                                    3.0%
            3.3%                                                                                3.8%                           31.8%
                   27.8%                                        CSP Zeebrugge
                                                                                                         31.7%
                                       16.6%                    CSP Spain
                                                                                                                               11.7%
                   15.1%
                                       9.7%                                                              10.5%
                                                                Guangzhou Nansha                                               7.3%
                    8.5%                                                                                 7.4%
                                                                Xiamen Oceangate
                                       25.2%                                                             26.8%                 26.2%
                   27.5%
                                                                PCT
                   12.5%               11.7%                                                             12.1%                 10.9%
                                                                Other subsidiaries
                   1Q2020             1Q2021                                                            1Q2020                1Q2021

 (US$ million)     1Q20      %        1Q21      %        YoY                    (US$ million)          1Q20       %        1Q21        %            YoY
 Greater China      84.9      38      108.6      41    +27.9%                   Greater China           57.4       33      66.8         33        +16.4%
 Overseas          135.6      62      156.7      59    +15.5%                   Overseas               117.5       67     136.6         67        +16.2%
 Total             220.5     100      265.3     100    +20.3%                   Total                  174.9      100     203.4        100        +16.2%
                                                                                                                                                           9
Terminals Profit – Robust Terminal Profit Growth in 1Q2021
➢ Benefiting from further throughput recovery as well as effective Lean Operations strategy, 1Q2021 terminal profit surged by 76.2%
  YoY and the portfolio has been further diversified
                   Terminals Profit by Regions (US$ million)                                                                   Top 10 Terminal Contributors

                                                                                                                                     1Q2020                                1Q2021
                                              93.9                                                      QPI                           43.8%    Yantian                      18.9%
                                                                     Overseas                           Yantian                       14.5%    PCT                           6.9%
                                             11.3%                                                      PCT                           10.6%     Guangzhou Nansha             5.1%
                                              6.0%                                                      Shanghai Pudong                6.9%    Xiamen Ocean gate             4.6%
                                                                     S.W. Coast
                                                                                                        Guangzhou Nansha               5.7%    Shanghai Pudong               4.5%
                                                                                                        Shanghai Mingdong              5.2%    Kumport                       3.9%
                   53.3                      29.2%
                                                                     Pearl River Delta                  Beibu Gulf Port                5.1%    COSCO-PSA                     3.2%
          2.8%
          5.5%                                                                                          Kumport                        4.7%    Shanghai Mingdong             2.7%
                                             4.5%                    S.E. Coast & Others
                    24.4%                                                                               COSCO-PSA                      3.7%
                                             10.6%
          0.9%                                                                                          Ningbo Yuan Dong               2.8%
                    12.6%                                            Yangtze River Delta                                    Total:   103.0%                   Total (1):      n.a.

                                             38.4%
                    53.8%                                            Bohai Rim

                   1Q2020                   1Q2021

 Notes:
 (1) Ranking and data of QPI and Beibu Gulf Port will be disclosed after their results announcements.
                                                                                                                                                                                     10
Financial Position – Maintaining Strong Balance Sheet

   ➢ As at the end of 1Q2021, our cash position has been strong with cash and cash equivalents of USD 1.27 billion
   ➢ Net gearing ratio remained at healthy level at 27%

                                     (US$ million, unless stated otherwise)                        As at 31 Dec 2020             As at 31 Mar 2021

                                     Total assets                                                          11,224                        11,107

                                     Net asset                                                               6,377                         6,308

                                     Total debt                                                              3,048                         3,000

                                     Cash and cash equivalents                                               1,310                         1,265

                                     Net debt to equity (%)                                                 26.8%                         27.0%
                                     Book value per share (HK$) (1)                                           13.0                          12.9

  Notes:
  (1) Book value per share is calculated by capital and reserves attributable to the equity holders divided by total number of shares issued as at the end of Dec 2020 and Mar 2021.

                                                                                                                                                                                       11
Capital Expenditure

                                FY2019 CAPEX:

                                Total – US$624m                                          1Q2021 CAPEX:
                                Investments – US$224m
                                PP&E – US$400m                                           Total – US$54.9m
                                                                                         Investments – US$8.8m
                                Examples:                                                PP&E – US$46.1m
                                • QPI (Added equity interest)
                                • Beibu Gulf Port (Added equity interest)                Example:
                                • CSP Zeebrugge CFS                                      • Vado (Capital increase)

             FY2018                    FY2019                       FY2020                    1Q2021                    FY2021

        FY2018 CAPEX:                                        FY2020 CAPEX:                                       FY2021 Expected CAPEX:

        Total – US$494m                                      Total – US$345m                                     Total ~ US$900m
        Investments – US$128m                                Investments – US$131m                               Investments ~ US$400m
        PP&E – US$366m                                       PP&E – US$214m                                      PP&E ~ US$500m
        Examples:                                            Examples:
        • COSCO-PSA (one new berth)                          • QPI (Added equity interest)
        • CSP Abu Dhabi                                      • Beibu Gulf Terminal

                                                                                                                                          12
Agenda

         1   Recovery & Stable Dividend Policy

         2    Financial Highlights

         3    Operational Review

         4    Strategy & Outlook

         5    Appendix
Operational Results – Strong Throughput Growth in 1Q2021
    Total Throughput                                                              Equity Throughput
                           1Q2020   1Q2021      YoY Change                                                1Q2020   1Q2021     YoY Change
       ('000 TEU)                                                                     ('000 TEU)

   - Subsidiaries          5,097    5,366         +5.3%                           - Subsidiaries          3,340    3,403        +1.9%

   - Non-subsidiaries      22,382   24,822       +10.9%                           - Non-subsidiaries      5,331    5,890       +10.5%

  Total throughput         27,479   30,188        +9.9%                          Equity throughput        8,671    9,293        +7.2%

                                        30.2M                                                                         9.3M
                                                                                                   8.7M
                27.5M
                                                             Overseas
                                        23.1%
                                                                                                                      32.8%
                24.8%
                                         4.2%                S.W. Coast                        35.6%

                    3.6%                                                                                              3.5%
                                        23.2%                Pearl River Delta                     2.5%
                20.4%                                                                                                 21.1%
                                         4.5%                S.E. Coast &                      19.5%
                    4.4%
                                        12.2%                Others                                                   8.3%
                11.8%                                                                              7.9%
                                                             Yangtze River
                                                                                                                      10.8%
                                                             Delta                             10.4%

                35.0%                   32.8%                Bohai Rim
                                                                                               24.1%                  23.5%

               1Q2020                  1Q2021                                                  1Q2020                1Q2021                14
Global Footprint and Opportunities

Key Overseas          Annual Designed
Terminals              Capacity (TEU)
PCT (1)                6,200,000
CSP Spain Group (1)    5,100,000
CSP Abu Dhabi (1)      2,500,000
CSP Zeebrugge (1)      1,300,000
Chancay (1)            1,000,000
RSGT                   5,200,000
Suez Canal             5,000,000
COSCO-PSA              4,850,000
Antwerp                3,700,000
                                                    ➢ Strategically pursue investment opportunities to create value to our shareholders
                                                    ➢ Future M&A opportunities in the regions of Southeast Asia, the Middle East, Africa
Euromax                3,200,000
                                                      and South America
Kumport                2,100,000
                                                    ➢ To target Hurdle rate at least low double-digit equity IRR
                                        Note:                                                                                              15
                                        (1) Overseas subsidiaries
Enhance Synergy in Subsidiaries– Secured Demand with Shipping Alliances (1)
            Throughput from COSCO SHIPPING Lines, OOCL, Evergreen +                                                         Growth in Throughput (2)
           CMA, 2M+THE Alliance and others as % of total throughput (2)                                                      (1Q2021 YoY Change)

             COSCO SHIPPING Lines             OOCL                               Evergreen + CMA                                                                    ➢ Contribution from COSCO
             OCEAN Alliance                   2M + THE Alliance                  Others                    +14.8%          COSCO SHIPPING Lines                       SHIPPING Lines and OCEAN
                                                                                                                                                                      Alliance was up about 14.8%
                                                                                                                                                                      and 10.1% YoY in 1Q2021,
                                                                                                                                                                      which accounted for around
                                            17.3%                     17.2%                                 +20.2%         OOCL (3)                                   1/4 and 1/2 of total
                                                                                                                                                                      throughput, respectively
                                                                                                                                                                    ➢ Throughput from OOCL surged
                                             31.5%                     29.9%                                                                                          by 20.2% YoY in 1Q2021, of
                                                                                                                                                                      which PCT, CSP Zeebrugge,
                                                                                                            +10.1%         OCEAN Alliance                             Xiamen, CSP Spain terminals
                                                                                                                                                                      increased significantly
                                            51.2%                     52.9%                                                                                         ➢ Throughput from non-
                                   22.9%                    22.1%
                                                                                                                                                                      Shipping Alliances rose 6.4%
                                                             6.1%
                                                                                                                                                                      YoY in 1Q2021, of which
                                   5.4%                                                                     +1.0%          2M + THE Alliance                          Xiamen Terminal increased
                                                            24.7%
                                                                                                                                                                      significantly
                                   22.9%

                                 1Q2020                    1Q2021                                           +6.4%          Non-Shipping Alliances (4)
Note:
(1)   Based on Alphaliner figures as at 16/4/2021, our major customers OCEAN Alliance, 2M and THE Alliance together were accounted for about 83% of global container fleet market shares.
(2)   Total throughput of 7 major subsidiary terminals at which 3 major Shipping Alliances call.                                                                                             16
(3)   Throughput from OOCL at PCT, CSP Zeebrugge, Xiamen and CSP Spain terminals increased significantly in 1Q2021.
(4)   Throughput from non-Shipping Alliances at Xiamen Terminal increased significantly in 1Q2021.
Promoting Value-Added Supply Chain Extension Projects

       CSP Abu Dhabi CFS                                                 CSP Zeebrugge CFS

                                                                                                                              ACCELERATE THE EXTENSION OF SUPPLY CHAIN
                                                                                                                                INCREASE NEW EARNINGS GROWTH DRIVER

                                                                                                                              ➢ Develop the supply chain business and accelerate
                                                                                                                                the construction of the extended supply chain
                                                                                                                                platform
                                                                                                                              ➢ Build up logistics network with the supply chain
                                          Total Area       Warehouse                               Commencement                 platform as a link and expand service categories,
                                                                                 Capex                                          better attract and retain customers, bring in new
                                            (sqm)          Area (sqm)                                  date
                                                                                                                                revenue growth points
CSP Abu Dhabi CFS Phase 1 (1)             273,970             50,666           77mUSD                         1H2021
CSP Zeebrugge CFS                          77,869             41,580           13mEUR                Now operating
Guangzhou Nansha CFS                      206,200                N/A         986mRMB                 2022 Expected
Xiamen CFS                                 23,800                N/A         130mRMB                 2022 Expected

 Note:
 (1) The total warehouse area and estimated capex of phase 1 and 2 is about 105,225 sqm and approximately USD$ 138 million.

                                                                                                                                                                                    17
Technology Development to Facilitate Lean Operations

               2021           Coming2020
                                     3-4 years

    Wuhan Terminal and      Application of Navis
    Nantong Terminal will   N4 system to most of
    implement Navis N4      our subsidiaries in
    system in 2021          the coming 3-4 years

                                                    ➢ Actively advocated 5G smart ports

                                                    ➢ Demonstration port for 5G smart application, Xiamen
                                                      Ocean Gate Terminal is actively carrying out research
    Further enhance terminals’ informatization        and development of driverless container truck system
    services level through the participation of
    GSBN and application of blockchain technology

                                                                                                              18
Agenda

         1   Recovery & Stable Dividend Policy

         2    Financial Highlights

         3    Operational Review

         4    Strategy & Outlook

         5    Appendix
Global Layout and Lean Operations

        Capitalize on          ➢   Identifying potential projects and tapping into strategic subsidiaries and profitable non-
     global growth and             subsidiaries amid global growth to enhance balanced global network
 optimize terminal portfolio   ➢   Restructuring terminals through port resources consolidation to increase efficiency
                               ➢   Disposing terminals without strategic value to enhance global portfolio and increase
                                   total assets
                               ➢   Continuing to explore emerging markets such as Southeast Asia, the Middle East and
                                   Africa to expand and diversify terminal portfolio

     Further implement         ➢   Continuing “lean operations“ in 3 ways to enhance portfolio and raise efficiency:
  lean operations to boost            Cost reduction – focusing on financial control and featuring “cost per TEU” to
    quality and efficiency             enhance terminal operations and management
                                      Revenue boost – capitalizing on global network and switching from single terminal
                                       service to network marketing to provide shipping companies with budget and
                                       efficient service in order to increase our bargaining power. Actively collaborating with
                                       other ports operators to raise throughput and improve overall efficiency
                                      Headquarters’ empowerment – setting up COE (Center of Excellence) team to
                                       enhance port operations and management
                                                                                                                                  20
Optimizing Terminal Assets Portfolio

                   ACQUISITIONS                                                    DISPOSALS

                  Beibu Gulf Terminal                                   Yangzhou Yuanyang Terminal &
 is expected to share the benefits of economic growth in                    Zhangjiagang Terminal
           Southwest China and Southeast Asia                        disposal gain after tax of around USD$61M

                          RSGT                                               Jiangsu Petrochemical
has a wide coverage of container market in the Middle East           disposal gain after tax of around USD$7M
       and East Africa, bringing growth momentum
                                                             PB ratio of the 3 terminals was about 1.5-1.7 times.
              Tianjin Container Terminal                     CSPL is now traded at around 0.5 times, deeply undervalued.
  further enhances synergy with the OCEAN Alliance and               The disposals created value for shareholders
   strengthens investment and expanding the space for
              development for both parties                                      Taicang Terminal
                                                                         is expected to be disposed in 2021

                                                                                                                       21
Lean Operations – Cost Reduction

                                                                       Cost Reduction

                                  ➢ Develop cost management system focusing on financial control and featuring “cost per TEU”
                                    to enhance terminal operations and management; incorporate “cost per TEU” in KPI to set
            Cost                    operating cost control targets for subsidiaries
          Reduction

            Lean                  ➢ Facilitate informatization and digitalization, relatively unify operating system and continue
          Operations
                                    to adopt Navis N4 in subsidiaries; develop MIS system, unify key operational and business
Revenue           Headquarters’
                                    indicators, and drive terminal automation
 Boost            Empowerment
                                  ➢ Enhance cost breakdown analysis, set targets and formulate cost control plan; develop a
                                    cost-oriented marketing and operating mindset; introduce practical, clear and effective
                                    measures; enhance cost optimization and stay cost competitive

                                                                                                                                    22
Lean Operations – Revenue Growth and Headquarters’ Empowerment
              ➢ Develop customer analysis model to identify profit contribution from shipping companies and container types,
                allowing headquarters and terminals to engage customers and leverage on their competitive edges to enhance
                effective marketing and negotiation to tap customer value and increase throughput and revenue

   Revenue
              ➢ Enhance organizational structure to increase marketing efforts and synergy; continue to optimize and enhance
    Boost       operations with sharper market insights and customer analysis by marketing team, and support terminals to
                maintain relationships with shipping liners in a systematic manner

              ➢ Develop supply chain business by innovative marketing; build terminal extended supply chain platform to
                develop terminal-oriented supply chain warehousing service and establish logistics network leveraging on supply
                chain platform. CFS business brings in shipping services, which in turn boost demand for CFS and supply chain
                extended services

              ➢ Headquarters is empowered to solve problems impeding cost-cut and make business decisions with terminals,
Headquarters’   transforming from being a “passive auditor” to “business partner” through measures such as visualization of
Empowerment     information and COE, with an aim to reducing cost and increasing terminal revenue

               ➢ Execute action plan proactively and strengthen terminal operations and management

                                                                                                                              23
Lean Operations – Cost Control

    Four measures to improve lean operations
                                                                             A series of cost control measures
          and cost control capabilities

         Innovatively set up ports operations management COE                 Actively promote and enhance automation in the
         Team                                                                terminal to improve efficiency and lower outsourcing
                                                                             cost
         Establish cost control incentive system
                                                                             Evaluate the allocation of human resources and
         Formulate four-stage cost control and supervision system,           maximize human resources by one job post with
         including 1)terminals;2)Operations Center and COE                   multi-functions or change of job to lower labor cost
         Team; 3)Audit & Supervision Department supervise the
         work;4)In terms of long-term problem which can not be
         effectively solved regarding cost control, introduce                Improve the working efficiency of cranes to reduce
         personnel change and disciplinary inspection when                   equipment electricity and fuel cost
         necessary
                                                                             Increase durability of equipment by in-house
         Set up centralized procurement system based on the                  maintenance to lower maintenance expense
         principle of making as many necessary purchases as
         possible from the same supplier

  ➢ Our Terminals highly value the cost control system, focusing on cost per TEU. Hence, we incorporated the “cost per TEU”
    concept into KPI and established operating cost control goals for subsidiaries in order to effectively implement cost control
    measures within the operational system
                                                                                                                                    24
Lean Operations – Increase Revenue

➢ Strengthen overall marketing activities and
  negotiation strategies to further tap customer                       Increase volume proportion from third-party customers (1)
  value. Terminals maintain good relationship                                                      FY20 Actual proportion           FY21 Target proportion
                                                    70%     62.7%
  with shipping companies and have made good                    64.1%       61.1%   63.6%
  positive progress in introducing new shipping                                               54.4%
                                                    60%                                               55.0%
  services. Our Subsidiaries have added 17 new                                                                        52.5%            51.0%
  shipping services during 1Q2021                   50%                                                                                                 46.1%
                                                                                                                 44.1%
                                                                                                                                  41.7%
                                                                                                                                                                             40.0%
➢ Apart from maximizing synergy with parent         40%                                                                                                              34.6%

  company, we also cooperate with different                                                                                                       30.3%
  shipping alliances to optimize our client         30%

  portfolio
                                                    20%

➢ Given improving macro environment and
                                                    10%
  effective lean operations strategy, we have
  stronger bargaining power to adjust up ASP, for   0%
  example, PCT’s ASP increased by about 10% in                  PCT          CSP Abu Dhabi   Xiamen Oceangate   Lianyungang New
                                                                                                                     Oriental
                                                                                                                                  CSP Zeebrugge   Jinzhou Terminal   Nantong Tonghai
                                                                                                                                                                        Terminal
  1Q2021 compared with that in FY2020                Note:
                                                     (1) Third party refers to throughput contributed by other shipping companies, excluding those from parent company and OOCL.

                                                                                                                                                                               25
5-Year Target Plan

                     To achieve targets by the end of 2025 (1)

                                       Equity throughput

                                        57 million TEU
                                    5-year growth rate 48%
                                 (5-year CAGR of about 8.2%)

                                   Operational cost per TEU
                                 Decrease by 15~20% in 5 years
                       (Annual average decline by 3~4% in 5 years)

                        Notes:
                        (1) Year 2021 - year 2025

                                                                     26
Outlook

                            Challenges                                                                  Opportunities
 ➢       Negative impact to global economy due to COVID-19                        ➢   Long term opportunities for overseas terminals development
 ➢       Sino-US trade tensions                                                   ➢   Opportunities amid domestic terminals consolidation
                                                                                  ➢   Good prospect on the back of our effective Lean Operations
                                                                                      strategy

     ➢    Global economic growth looks stagnant, some companies have cut or even cancelled dividend. However, on the back of our strong
          operating cash flow from lean operation, we are confidence of maintaining our attractive dividend policy to reward our shareholders
     ➢    The negative impact from COVID-19 on the ports industry has gradually eased. Throughput in the recent two quarters shows strong signs
          of recovery
     ➢    We will actively enhance the gateway ports network and further strengthen supply chain to build terminal network in Middle East, Africa,
          Southeast Asia and South America
     ➢    Expect our throughput growth of 2021 will outperform the average of industry

                                                    Capturing Strategic Development Opportunities
                                                         Continuing to Enhance Lean Operations                                                       27
Q & A Session
Thank you!
Agenda

         1   Recovery & Stable Dividend Policy

         2     Financial Highlights

         3     Operational Review

         4     Strategy & Outlook

         5    Appendix
Increasing Overseas Exposure

         Equity Throughput by geographic location (%)                    Overseas Equity Throughput (TEU)

                                                                                                 12.7 M     12.5 M

                                                                                     10.7 M

                                     71.2%       68.1%   67.4%
        79.3%     77.3%                                                    7.4 M
                                                                 6.1 M

                                     28.8%       31.9%   32.6%
        20.7%     22.7%

        2016       2017              2018         2019   2020    2016       2017       2018      2019       2020

                          Overseas      Greater China                                 Overseas
                                                                                                                     30
On Track to Achieve Our 5-Year Target

                        2016                                                      2020                                  2021
                   Restructuring                                           Where we were                                 Vision
             ◆   As a pure port operator                             ◆   No. of subsidiaries increased         Operations:
                                                                         to 14 (FY2016: 10)                    ◆ Global terminal network
             ◆   3 core strategies
                                                                     ◆   Industry leader in terms of           ◆ Linkage effects in costs,

                                                                         total container throughput               services and synergies
                                                                                                               ◆ Increasing subsidiaries
                                                                     As of 2020 growth                  100%
                                                                                                  92%
                                                                     2021 growth target                        Financials:
                           2016                           2021
                                          Change                                    65%                        ◆ Higher return from existing
                         Base Year                       Target            60%
                                                                                          50%                      portfolio
Equity throughput        29.5 mn TEU       +60%        47.2 mn TEU
                                                                     30%                                       ◆ Further     improved asset
Total assets          US$6,786.5 mn        +50% US$10,179.8 mn                                                     quality after M&A and
Net profit              US$180.9 mn(1) +100%           US$361.8 mn                                                 divestment
                                                                       Equity      Total assets   Net profit   ◆ Strong free cash flow and
Notes:
(1) Excluding one-off gain from disposal of Florens.
                                                                     throughput                                    healthy balance sheet
                                                                                                                                          31
Return On Equity (ROE) Improvement – Newly Acquired Terminals to Catch Up

            ROE                                                                                                     6.6
                                                                                             6.5 (3)
             (%)                                                      6.3

                                                4.8 (2)

                           3.5 (1)

                         FY2016                 FY2017                FY2018                FY2019                FY2020

           Note:

           (1) Excluding one-off gain of FCHL transaction of US$59.0 m and three months of share profits of FCHL of US$7.1 m.
           (2) Excluding one-off gain of QPI transaction of US$285.4 m.
           (3) Excluding one-off loss of QPI dilution effect of US$22.6 m.

                                                                                                                                32
Incentive Scheme – Aligning Shareholders’ Interests

                                  ◼    A total of about 53 million share options were granted to around 238 eligible employees under
                                       the share option scheme on 19 June 2018
                                  ◼    Exercising criteria are in line with shareholders’ interests

    Batch No. of     Percentage of                                                                                                 Return on           Growth Rate
                                                                               Exercise Period                                                                                 EVA Indicator
Share Options Vested Options Vested                                                                                               Net Assets 3         of Revenue 3

        1st batch                 33.3%            Commencing on the first trading day after the expiration of                       ≥ 6.0% 4            ≥ 15.0% 5             Must reach
                                                   the Restriction Period 1 and ending on the last trading day of                                                          assessment target 6
                                                   60 months from the Grant Date 2

       2nd batch                  33.3%            Commencing on the first trading day after the expiration of                       ≥ 6.5% 4            ≥ 25.0% 5             Must reach
                                                   the 36 months from the Grant Date and ending on the last                                                                assessment target 6
                                                   trading day of 60 months from the Grant Date 2                                                                              and EVA > 0

        3rd batch                 33.4%            Commencing on the first trading day after the expiration of                       ≥ 7.0% 4            ≥ 40.0% 5             Must reach
                                                   the 48 months from the Grant Date and ending on the last                                                                assessment target 6
                                                   trading day of 60 months from the Grant Date 2                                                                              and EVA > 0
 Notes:
 1. Restriction Period refers to Share Options cannot be exercised during the two-year period commencing from the Grant Date.
 2. Grant Date is 19 June 2018.
 3. The figure shall not be lower than the average of the selected peer benchmark enterprises.
 4. Return on net assets (after extraordinary gains and losses) in the financial year immediately preceding the vesting of the Share Options.
 5. Growth rate of revenue in the financial year immediately preceding the vesting of the Share Options as compared to that in the financial year immediately preceding the Grant Date.        33
 6. The EVA indicator accomplished for the financial year immediately preceding the vesting of the Share Options.
Sustainability Framework

                                          ◆   Providing a healthy and safe working environment
                                          ◆   Building an inclusive, diversified and sustainable
                                              workforce

                                                                                                   ◆   Transitioning to “Green Ports”
 ◆   Ensuring operational compliance                                                               ◆   Managing energy consumptions and
 ◆   Promoting inclusive development                                                                   emission to respond to climate
                                                                                                       change

                                                                                                   ◆   Harnessing the power of technology
 ◆   Enhancing supply chain management
                                                                                                   ◆   Strengthening our global terminal
 ◆   Fostering fair operating practices
                                                                                                       network
                                                                                                                                       34
Aligning Global Principles

         We support the Sustainable Development Goals (SDGs) of the United Nations and identify how these
         global sustainability challenges relate to our business and integrate them into our daily operations:

         Global Recognition and Advocacy:

                                                                                                                 35
Disclaimer

    This presentation contains certain forward-looking statements with respect to the financial condition, results of operations and business of
    COSCO SHIPPING Ports Limited (“COSCO SHIPPING Ports”) and certain plans and prospects of the management of COSCO SHIPPING Ports.

    Such forward-looking statements involve known and unknown risks, uncertainties and other factors which may cause the actual result or
    performance of COSCO SHIPPING Ports to be materially different from any future results or performance expressed or implied by such forward
    looking statements. Such forward- looking statements are based on numerous assumptions regarding COSCO SHIPPING Ports’ present and
    future business strategies and the political and economic environment in which COSCO SHIPPING Ports will operate in the future.

    The representations, analysis and advice made by COSCO SHIPPING Ports in this presentation shall not be construed as recommendations for
    buying or selling shares of COSCO SHIPPING Ports. COSCO SHIPPING Ports shall not be responsible for any action or non-action made according
    to the contents of this presentation.

                                                                                                                                                   36
Thank you!
You can also read