Click to edit Master title style Peru: Changing Growth Drivers - Investor Presentation - MEF

Page created by Roberta Morales
 
CONTINUE READING
Click to edit Master title style Peru: Changing Growth Drivers - Investor Presentation - MEF
Click to edit Master title style

Peru:
Changing Growth Drivers
Investor Presentation

October 2016
Click to edit Master title style Peru: Changing Growth Drivers - Investor Presentation - MEF
Key Highlights on the Peruvian Economy

                   1    Economic Outlook

                   2    Growth Strategy 2016-2021

                   3    Macroeconomic Balances

                   4    Commitment to Solarization & Development of PEN Market

                                                                                 2
Click to edit Master title style Peru: Changing Growth Drivers - Investor Presentation - MEF
1

        Peruvian economy is growing in line with its potential but with few and
        transitory drivers

 From a demand-side point of view, the economy is                From a supply-side point of view, this type of growth has
  growing 4% based on greater mining exports (14.3%) and           no productivity gains.
  an expansionary fiscal policy (9.1%).
 Both drivers are transitory.

                                    Peru: GDP growth                  Peru: Potential growth in non – reforms scenario
                             (Moving average, last 4 quarters)                 (Contribution in percentage points)

    Source: BCRP, MEF Forecasts .

                                                                                                                               3
Click to edit Master title style Peru: Changing Growth Drivers - Investor Presentation - MEF
1
       There is an urgent need for structural reforms that diversify growth drivers in the
       medium term but without hurting macroeconomic stability

                                                                                  GDP per capita
                                                                               (Constant soles of 2007)
                                                                              1971-1990          1990-2000          2001-2011          2012-2021
                                   GDP (Average annual % change)                 1.5                 3.2               5.7                 4.3
                                   Fiscal Balance (Average annual % of GDP)     -7.4                -3.1               0.0                -1.2
                                   Inflation (%)                                627.8               734.8              2.5                 2.9

                                       18,000
                                                                                          Structural reforms
                                                                                              and macro
                                                                                                                High global
                                       16,000                                                stabilization
                                                                                                             dynamism and the
                                                                                               program         super cycle of
                                                        Economic stagnation and
                                                        macroeconomic instability                              commodity prices
                                       14,000

                                       12,000
                                                                                                                                      Low global
                                       10,000                                                                                       growth and the
                                                                                                                                   end of the super
                                                                                                                                       cycle of
                                                                                                                                      commodity
                                         8,000
                                                                                                                                        prices

                                         6,000
                                                 1971      1976      1981       1986      1991    1996       2001   2006        2011    2016       2021

    Source: BCRP, MEF Forecasts.

                                                                                                                                                          4
Click to edit Master title style Peru: Changing Growth Drivers - Investor Presentation - MEF
1

     The super cycle of commodity prices is over

    • New and sustainable drivers are required to boost potential
      growth:

       1. Higher business productivity and formalization
       2. Greater public and private investment

    • Subject to the fiscal consolidation and decentralization
      processes.

                                                                    5
Click to edit Master title style Peru: Changing Growth Drivers - Investor Presentation - MEF
1

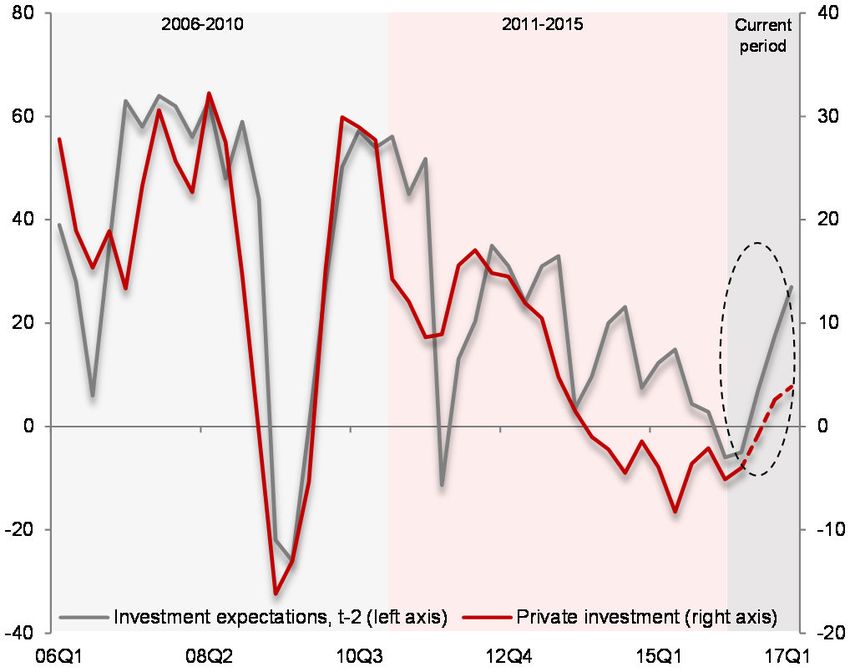
         Good momentum to implement structural reforms

Following a 4 year decline, the start of the new administration                                                                …together with a vast support to structural reforms.
has bolstered confidence indicators…

                Investment expectations1 and private investment                                                                 Businessmen that foresee improvements in the following sectors
                                      (Points, annual % change)                                                                                        towards 20212
                                                                                                                                                             (% of total businessmen surveyed)

                                                                                                                                     Business environment                                                                          95

                                                                                                                                                      Education                                                            89

                                                                                                                                                 Formalization                                                 80

    1/ Investment expectations consider percentage of firms (SAE clients) expecting to accelerate its investment plans minus firm s expecting to reduce them in the next six months. Also, for 2016Q3 we use August record (27 points).
    2/ Result of the sum of the percentage of executives that consider that Peru will be “slightly better” and “much better” with regard to the current situation.
    Source: APOYO Consultoría, BCRP, MEF Forecasts.

                                                                                                                                                                                                                                          6
Click to edit Master title style Peru: Changing Growth Drivers - Investor Presentation - MEF
Key Highlights on the Peruvian Economy

                   1    Economic Outlook

                   2    Growth Strategy 2016-2021

                   3    Macroeconomic Balances

                   4    Commitment to Solarization & Development of PEN Market

                                                                                 7
Click to edit Master title style Peru: Changing Growth Drivers - Investor Presentation - MEF
1
2
     Near- and medium-term reforms will be implemented in order to increase the
     country’s growth potential

                                       Near-term measures                         Medium-term measures

                                 Promote (i.e. addressing delays, sourcing   Redesign of processes for the granting and
            Promoting
                                 pending approvals of) both public and PPP   monitoring of public and PPP investment
           Investment            investment projects                         projects

                                 Seek a tax framework that promotes a        Strengthen multi sectoral efforts to reduce
                                 better business environment and the         informality:
                                 expansion of the tax base:                   • National Council of Competitiveness
            Boosting              • Commitment to lower taxes (VAT)               and Formality
      Business Productivity       • Increase in the taxpayer base             • Reform of the tax authority
    (and increasing formality)    • Greater tax equity                        • Red tape removal
                                  • Lower avoidance and evasion               • Entrepreneurial training for small
                                  • Maximize the flow of resources to             businesses
                                      regional and local governments          • Access to credit and financial inclusion

            Enhancing            Promote an institutional framework that     Improve financial programming (e.g.
              Fiscal             improves fiscal transparency and makes      systems, protocols, controls) in regional
           Responsibility        fiscal rules more enforceable.              and local governments

                                                                                                                           8
1
2
         To promote investment in the near term, the unlocking of infrastructure projects
         would be key

A considerable uptick in infrastructure spending would                                                                           The Government has prioritized a US$ 18 billion portfolio of
offset an expected decrease in mining investment as key                                                                          high impact projects
projects come into operation

                                     Investment by sectors1                                                                     Short – term: fast track of US$ 18 billion in infrastructure projects
                                               (US$ billion)
                                                                                                                                                                                                                            Pre
                                                                                                                                                                           Investment    %                      Land
                                                                                                                                              Main projects                                                             Investment
                                                                                                                                                                            US$ mill. executed                 access
                                                                                                                                                                                                                          Studies
                                                                                                                                          Gasoducto Sur
                                                                                                                                                                               7,300              34.5
                                                                                                                                          Peruano (GSP)

                                                                                                                                          Line 2 of the Metro                  5,346               0.0

                                                                                                                                          Lima’s Airport                       1,062               0.0

                                                                                                                                          Northern Dock                          883               0.0

                                                                                                                                          Chavimochic
                                                                                                                                                                                 715              29.7
                                                                                                                                          irrigation project
                                                                                                                                          T.L. Moyobamba-
                                                                                                                                                                                 654               7.0
                                                                                                                                          Iquitos

                                                                                                                                          Southern Dock                          600              41.0

                                                                                                                                          Chinchero
                                                                                                                                                                                 599               0.0
                                                                                                                                          International Airport
                                                                                                                                          Majes – Siguas II
                                                                                                                                                                                 550               0.2
                                                                                                                                          Irrigation project
                                                                                                                                                 Potential quick wins                  Concluded                 In progress

    1/ Include: public and private investment in transportation, irrigation, electricity, telecommunications, hydrocarbons transportation, tourism and sanitation, and the modernization of Talara refinery.
    Source: MEF, MINEM, ProInversion, Ositran, Osinergmin, Perúpetro, APOYO Consultoría.

                                                                                                                                                                                                                                     9
1
2
        In the medium term, the focus will be on reforming the investment promotion
        systems

                      Reforms                                                    Public investment
                                                                                      (% of GDP)

                                                        6
                        •   Will participate in post-       PPP
                            awarding phase.                 Traditional Public Investment
                                                        5
                        •   Decentralization.

                        •   Multiannual investment      4

                            program (PPP, Works
                            for Taxes).                 3
                                                                                                   3.6    3.8
                                                                                    3.9
                                                                  4.4

                        •   Red tape removal.           2

                        •   Guarantee execution
                                                        1
                            and quality of
                                                                                                   1.3    1.2
                            investment projects.                                    1.0
                                                                  0.4
                                                        0
                        •   Creation of a prioritized         2006-2015             2016           2017   2018

                            portfolio for regions and
                            local governments.

    Source: MEF.

                                                                                                                 10
1
2
                            Infrastructure investment will be a key step to diversify the economy

There is a strong relationship between infrastructure and
                                                                                                                             Of 13 prioritized projects from the US$ 18 billion portfolio
economic diversification
                                                                                                                                             4 will induce diversification
                                           Economic Complexity1 Index and Infrastructure Indicator2
                                                                                                                                                        Tourism projects:
                                                                (Country record)
                                                                                                                                                        • Lima’s Airport (US$ 1.1 billion).
                                                                                                                                Tourism
                                           3                                                                                                            • Chinchero International Airport (US$ 0.6 billion).

                                           2                        OECD Average                                                                        Tourism potential:
                                                                                                                                                        International tourist arrivals in New7Wonders
       Economic Complexity Index (Score)

                                                              PA3 Average
                                           1                                                                                                            countries:
                                                                                                                                                          • Peru: 3.2 million
                                                             Peru
                                           0                                                                                                              • China: 55.6 million.

                                                                                                                           Agribusiness                 Agribusiness projects:
                                           -1
                                                                                                                                                        • Chavimochic (US$ 0.7 billion).
                                                                                                                                                        • Majes – Siguas II (US$ 0.6 billion).
                                           -2

                                                                                                                                                        Agribusiness potential:
                                           -3                                                                                                           Agriculture land use in Peru:
                                                1     2        3              4              5   6           7
                                                                    Infrastructure (score)                                                                • Cultivated area: 58%
                                                                                                                                                          • Other uses: 42%

    1/ Economic Complexity Index ranks how diversified and complex a country’s export basket is. It can take values from -2.5 to 2.5, where a higher value implies greater economic complexity.
    2/ Infrastructure index measures the quality of overall infrastructure in a country. It can take values from 0 to 7, where a higher score indicates better quality of infrastructure.
    3/ Doesn´t include Peru.
    Source: Pew Research Center, WEF-IFM, The Atlas of Economic Complexity.

                                                                                                                                                                                                               11
1
2
        Also, an increasing middle class has induced a private sector-led pipeline
        of consumer-related investment projects totaling more than US$ 10 billion

                                                                                                       Main private investment announcements
                                                                                                     (Excluding infrastructure, mining and hydrocarbons;
                                                                                                        announced from January 2015 to July 2016)
                                                                                                                         Number of             Investment
                                                                                                      Sector
                                                                                                                       announcements          (USD million)
                     Urban Peru: Socioeconomic levels
                                     (% de households)                                                Retail                   59                 2,174

                                                                                                      Real Estate              51                 2,099
                                 A             B+C              D              E
                                                                                                      Tourism                  33                 1,367
             2005                               2015                                 2021

                                                                                                      Services                 20                 1,033
             0.5%                                1.5%                                3.0%

                                                                                                      Industrial               40                  970
            37.6%         Middle Class          46.0%           Middle Class        52.0%
                                                                                                      Massive
                                                                                                      consumption              23                  872
            42.3%         Emerging lower        34.3%          Emerging lower       31.0%
                              class                                class

                                                                                                      Logistics                10                  503
            19.7%                                18.3%                               14.0%

    Households: 4.5 mm                   Households : 6.3 mm                   Households : 7.7 mm    Education                32                  391

                                                                                                      Health                   11                  316

                                                                                                      Agriculture              12                  240

                                                                                                      Vehicle sales            13                  127
                                                                                                      Total                    304                10,092

    Source: INEI, ENAHO, Investment announcements gathered by APOYO Consultoría.

                                                                                                                                                              12
1
2
                 The Peruvian tax system has a bad combination: high tax rates, low tax base
                 and high tax avoidance

There is ample room to reduce tax rates and increase tax                                                                        … in order to formalize the economy
base…

                                  VAT tax rate and efficiency                                                                                          Tax avoidance2 and labor informality
                            (VAT rate and % of private consumption)                                                                                  (% of potential base and % of total employees)

                 32
                                                                                                                           45                    VAT avoidance (left axis)              Labor informality (right axis)          82

                 24                                                                                                                                                                                                             80
                                                                      Peru
                                                                                                                           40

                                                                                                                                                                                                                                78
      VAT rate

                 16

                                                                                                                           35                                                                                                   76

                 8                                                                                                                                                                                                              74

                                                                                                                           30

                                                                                                                                                                                                                                72
                 0
                      0          20                 40              60                80               100
                                                                                                                           25                                                                                                   70
                                                                                                                                  2007       2008       2009       2010       2011      2012       2013       2014       2015
                               VAT    efficiency1   (% of private consumption)

     Labor informality is around 70%.

     In Peru, fiscal revenues are equivalent to 20.1% of GDP which is lower than Chile (23.5%), Colombia (26.7%) and Mexico (23.5%).

    1/ Ratio between revenue and private consumption multiplied by the rate of VAT.
    2/ VAT tax avoidance index considers the estimated avoidance as numerator and the theoretical potential VAT tax base as denominator after discounting the effect of current tax expenditures in each period.
    Source: Lora (2012), Sokolovska y Sokolovskyi (2015), SUNAT, INEI.

                                                                                                                                                                                                                                     13
1
2
            The tax reform

                                  Tax                               Policy Measure
                                        • Reduction of 1% in VAT tax rate (from 18% to 17%) in 2017 and then
            Value Added Tax               convergence to 15% subject to tax collection targets.

                                        • Reversal of the reduction in the corporate income tax rate (from 28% to
            Corporate Income Tax          30%) and the increase in the dividend tax rate (from 6.2% to 4,1%).

                                        • Simplification of procedures to declare and pay taxes (VAT and IT).
            Special tax regime for
                                        • Progressive tax rates applied to net income or sales (for 10 years).
            small businesses
                                        • To extinguish tax debt under 1 UIT (PEN 3 950).

                                        • Tax deduction for health and housing expenditures, supported by
            Personal Income Tax           electronic payment receipts1.

                                        • Preferential treatment to financial instruments traded on stock exchanges
            Tax on capital gains          markets and supervised by the SMV (Peru's Exchange and Securities
                                          Supervisory agency).

                                        • Tax amnesty.

              Others                    • Tax benefits for repatriation of capital.

                                        • Simplification of procedures.

    1/ Receipts, tickets, etc..
    Source: MEF.

                                                                                                                    14
1
2
      The Credit Revolution

        Strengthen articulation among available financial instruments (Cofide, BN, Agrobanco, FMV, Financial Inclusion Strategy)
        to enhance the supply and reduce the costs for formal business.

            Peru: Credit cost and average loan by business size                                    Peru: financing sources by enterprise size
                                       (% and US$ millions)                                                       (% of total credit)

     35           33                                                                40
                                                                                         100
     30                                                                             35    90
                                                                                    30    80
     25                                                                                   70
                                    20                                              25    60
     20
                                                                                    20    50
     15                                                                                   40
                                                                                    15    30
                                                 10
     10                                                                                   20
                                                              6                     10
                                                                          5               10
       5                                                                            5      0
       0                                                                            0          Small enterprise   Medium enterprise        Big enterprise
               Micro      Small     Medium       Big     Corporate
             enterprise enterprise enterprise enterprise
                                                                                               Banks      Credit supplier       Other financing sources
                    Interest rate (left axis)           Average loan (right axis)

    Source: MEF estimates and forecasts.

                                                                                                                                                            15
1
2
       Impacts on the Growth Strategy 2016-2021

Potential growth will increase from 4% to 5% …                   …with greater permanent fiscal revenues

                            Effect of reforms on potential GDP               Effect of reforms on fiscal revenues1
                                           (Annual % change)                              (% of GDP)

    1/ Does not include extraordinary fiscal revenues.
    Source: MEF estimates and forecasts.

                                                                                                                     16
Key Highlights on the Peruvian Economy

                   1    Economic Outlook

                   2    Growth Strategy 2016-2021

                   3    Macroeconomic Balances

                   4    Commitment to Solarization & Development of PEN Market

                                                                                 17
2
3
         The new administration’s commitment to maintaining Peru’s historical fiscal
         responsibility

Gradual fiscal consolidation will begin in 2017…                                          … allowing the government to preserve its ongoing target of
                                                                                          prudent and sustainable debt management

                   Conventional and structural fiscal balance                                                             Public Debt
                                   (% of GDP)                                                                              (% of GDP)

     Peru will benefit by increasing transparency via the announcement and commitment to a target on the conventional fiscal deficit.

    Source: BCRP, MEF Forecasts.

                                                                                                                                                        18
2
         The New Fiscal Rule: simulate a structural pattern for the public spending but
3
         through observed and transparent fiscal targets

                 Rules                                                                      Current framework                                   Proposal

                              Public debt                                   Limit of 30% of GDP                                      Maintained

                                                                            Structural fiscal balance as a
                           Fiscal balance                                   function of potential output and Conventional fiscal balance
                                                                            long-term commodity prices1

                                                                                                                  Real growth for the General
                                                                            Expenditure ceiling in PEN only for
                    Primary expenditure                                                                           Government and as a function
                                                                            the National Government and as a
                    (current and capital)                                                                         of historical and projected GDP
                                                                            function of structural fiscal deficit
                                                                                                                  growth

                                                                                                                Real growth for the General
                                                                            Expenditure ceiling in PEN only for
                                                                                                                Government (wages, pensions,
                    Current expenditure                                     the National Government and as a
                                                                                                                goods & services excluding
                                                                            function of potential output
                                                                                                                maintenance)

                            Sub-national                                    -      Expenditure rule                                  -   Debt stock rule
                            Governments                                     -      Debt stock rule                                   -   Overall fiscal balance rule

                                                                                                                                             Compliance as a whole
    1/ According to the official methodology for the calculation of structural fiscal accounts approved by Ministerial Resolution.
    Source: MEF.

                                                                                                                                                                       19
2
3         The New Fiscal Rule: a stronger commitment to fiscal sustainability

                Non-financial Public Sector overall fiscal balance                                                                                   General Government non-financial expenditure
                                                  (% of GDP)                                                                                                                (PEN Billion)

     3                                                                                                                              140                Observed
                                                                                                                                                       Simulated under the current rule

     2                                                                                                                                                 Simulated under the proposed rule
                                                                                                                                    130

     1
                                                                                                                                    120

     0
                                                                                                                                    110
    -1

                                                                                                                                    100
                        Observed
    -2
                        Simulated under the current rule
                        Simulated under the proposed rule
                                                                                                                                      90
    -3

    -4                                                                                                                                80
             2010           2011           2012           2013           2014           2015           2016                                     2010      2011       2012        2013       2014   2015   2016

     Under the proposed fiscal rule, the 2016 public debt would have been 20.4% of GDP, lower than the current estimate (25.6% of
      GDP).

    Note: the current rule consider the official methodology for the calculation of structural fiscal accounts approved by Ministerial Resolution.
    Source: Forecasts MEF.

                                                                                                                                                                                                                 20
2
3
           Low level of external vulnerability

Current account deficit is fully covered by a strong financial                         …while a significant international reserves position
account…                                                                               provides comfort in facing any potential external shocks

                   Current account deficit and financial account                                         Net International Reserves
                                                  (% of GDP)                                                        (% of GDP)

                                                                                                 Coverage Indicators of International Reserves:
                                                                                                       As % of:                       2016
                                                                                                       Short-term External Debt 1     555.0
                                                                                                       Short-term External Debt
                                                                                                                                      320.0
                                                                                                       plus current account deficit

    1/ Include short-term stock debt plus amortization of private and public sector.
    Source: BCRP, Forecasts MEF, Bloomberg.

                                                                                                                                                  21
2
          External private debt has been reduced and now local business are in a better
3
          position to invest

          Growth of corporate debt remains in low levels…                            … and local firms have prioritized a financial strategy to
                                                                                     reduce their leverage and improve their balances
                                        Corporate debt 2014                                                    Corporate debt
                                                 (% of GDP)                                                        (% of GDP)

                            Singapore
                               Belgium
                                   China
                                 France
                                   Spain
                         South Korea
                                  Japan
                                    Chile
                    United Kingdom
                        United States
                                Canada
                              Germany
                          South Africa
                                    India
                                   Brazil
                          Peru (2015)              33%
                             Colombia
                                 Nigeria
                                 Mexico
                             Argentina
                                             0       50     100    150   200   250

     Corporate debt grew 11% since 2007, below the average of countries              Lindley, Alicorp and Ferryrcorp – firms that had a strong debt increase
      that increased their corporate debt (17%).                                       in 2013 – have shown a reduction of external debts up until 1H2016.

    Source: Bloomberg, BCRP, McKinsey Global Institute analysis.

                                                                                                                                                                 22
Key Highlights on the Peruvian Economy

                   1    Economic Outlook

                   2    Growth Strategy 2016-2021

                   3    Macroeconomic Balances

                   4    Commitment to Solarization & Development of PEN Market

                                                                                 23
2
        Emerging markets continue to gain momentum as shown by strong capital
3
4
        inflows into the region

    Emerging markets flows in 2016         Jan 1st till June 24th (Brexit)            June 27th till Sep 5th
                                                   USD millions                          USD millions
    EM – Hard currency                                 7 306                                  14 922

    EM – Local currency                                1 403                                   9 347

                                                                                         Record inflow:
                                                                                          USD 4.92Bn
                                                                             Brexit

    ____________________
    Source: Bloomberg, as of 09/05/2016.

                                                                                                               24
2
          A significant shortage in Peru’s debt supply has created considerable scarcity
 3
 4
          value for Peru bonds both, Soles and USD…

  Peru represents only 1.4% of the LatAm and EM primary                    Peru is amongst the lessen group of investment grade
  market supply…making it on of the most valued and                        issuers in the region…
  demanded credits amongst EM sovereign issuers

                   Peruvian Bond Issues in Latin America                            Evolution of LatAm issuers by credit rating
                                   (USD billions)
140,000
                                            7.2%
130,000
                            5.4%                                            100%
                5.0%                                 Peruvian Issues
120,000                                              LatAm Issues           90%    20%
                                                                                            29%          26%         30%     29%
                                                                            80%
110,000
                                                                            70%                                                        59%
100,000
                                                                            60%

 90,000                                                                     50%

 80,000                                                                     40%    80%
                                                                                            71%          74%         70%     71%
                                                    9.0%            1.4%
                                                                            30%
 70,000
                                                                            20%                                                        41%
 60,000
                                                                            10%

 50,000                                                                      0%
                2012        2013            2014    2015            2016           2012     2013         2014        2015   2015YTD   2016YTD
                                                                                                    IG          HY

     Source: Bloomberg

                                                                                                                                                25
2
        Peru’s 5-year CDS spread is currently trading near its 6-month low and below
3
4
        every sovereign in LatAm (ex-Chile)

The Peru 5-year CDS spread currently stands at 32bps                    …and has been trading closer to Chile than UMS over the
inside of 6M averages…                                                  past 3 months and has outperformed its regional
                                                                        investment grade peers over the past year

                 LatAm 5-year CDS Current and Average Levels                               LatAm 5-year CDS Evolution
                                      (Last 6 months)                                                  (Last year)
                                                                        750
                                                                                           Chile CDS, Current: 88, Average: 110 ( -23)
                                                                                           Peru CDS, Current: 110, Average: 164 ( -54)
                                                                        650                Mexico CDS, Current: 152, Average: 165 ( -13)
                        Average     Last
                                                                                           Colombia CDS, Current: 173, Average: 226 ( -53)
                                                                                           Brazil CDS, Current: 275, Average: 389 ( -114)
                                                               328      550

                                                                        450

                                                               275
                                             209
                                                                        350

                            158
                                                        142
                                             173                        250
          93
                             152
                                                        110
                                                                        150
          88

                                                                        50
         Chile             Mexico          Colombia     Peru   Brazil    Sep-15   Nov-15     Jan-16       Mar-16       May-16        Jul-16   Sep-16

    Source: Bloomberg

                                                                                                                                                       26
2
3
    Peru’s Asset and Liability Management Framework
4

                                                     Lines of defense to Finance Economic Growth

                    Assets                                                                                Liabilities

             Fiscal Stabilization Fund                                                                 Debt Capital Markets

            Fund size as of June 30, 2016                                                  Local Market           International Market
                    USD 8,165mn

                              National Emergency                                        Issuance of Soberanos    Issuance of Global Bonds
       Savings
                     Usage    International Crisis
      Mechanism

                      Significant shortage of fiscal income

                                                                Sources of Funds

           Secondary Liquidity Reserve                                                          Multilateral and Bilateral Loans

                                                                                                 CAF    BID     BIRF      Others

         Reserve size as of June 30, 2016

                                                                                                        Contingency loans
          PEN 1,978mn; USD603mn
                 equivalent
                                                                                                        USD 4,400mn

                                                                  RESTRICTED
                                                                                                                                            27
2
3
    Peru has successfully sought to increase “Solarization” while raising the
4   average life of its debt

                                      RESTRICTED
                                                                                28
2
        Peru has significantly increased its Soberanos (PEN) debt stock by relying on
3
4
        GDN’s

Over the past 10 years Peru has successfully increased its                                             …by focusing on PEN-denominated international issuances
Soberanos (PEN) debt stock by 6.0x compared to a growth                                                that have further developed the PEN market and
of 1.9x for its Global Bond (USD) debt stock…                                                          significantly increased foreign-ownership of its bonds

                             Soberano and Global Bonds                                                        Foreign Ownership Holdings – Soberano Bonds
                                   (PEN mn, USD mn nominal)                                                                    (as of September 2016 )

                                                                                           53,869
                                                                                                                                  7.840% Aug 2020s
             6.7x

                                   Global                                44,849
                                                                                                                                                45%
                                   Soberanos

                                                       32,961

                                                                                                            5.700% Aug 2024s                          6.950% Aug 2031s
                                26,008

                                                                                                                      52%                                         55%
      1.6x
                                                                11,440
                                                                                  10,520
                                               9,458
             8,092      8,571
     6,513

                                                                                                                                 6.350% Aug 2028s
        Dec 05             Dec 10                Dec 13           Dec 15            Sep 16

                                                                                                                                          86%

    1) Source: MEF and Bloomberg

                                                                                               RESTRICTED
                                                                                                                                                                         29
2
           The administration expects indebtedness levels to remain low as the fiscal
3
4
           deficit continues to consolidate

Both short-term and long-term debt to GDP levels have                                           …and we expect the trend to continue on the back of a
fallen significantly…                                                                           planned fiscal consolidation process

                            Short-term and Long-term Debt                                                                   Consolidation of Fiscal Deficit
                                             (% of GDP)                                              Public Debt, 2015          Public Debt, 2015   Public Debt, 2015   Public Debt, 2015
                                                                                                       23.3% of GDP               17.1% of GDP        49.4% of GDP        54.0% of GDP
    50.0
                                                                  Long-Term     Short-Term
                                                                                                                                                    3.9
    45.0                                                                                                    2016         2017    2018

    40.0
                                                                                                                                                          3.3
                                                                                                                                3.2
                                                                                                     3.0                              3.0                               3.0
    35.0
                                                                                                                                                                2.7
    30.0                                                                                                   2.5                                                                 2.5
                                                                                                                  2.3                         2.3
    25.0                                                                                                                                                                               2

    20.0

    15.0

    10.0

     5.0

      -
           1999        2002      2004        2006   2008   2010     2012      2014    2016                 Perú                       Chile           Colombia                México

     1) Source: BCRP, Forecasts MEF (Sep6)

                                                                                        RESTRICTED
                                                                                                                                                                                            30
Click to edit Master title style

Peru:
Changing Growth Drivers
Investor Presentation

October 2016
You can also read