CULP, INC. NYSE: CULP Second Quarter Fiscal 2021 Summary Financial Information - December 3, 2020 - Culp Inc
←
→
Page content transcription
If your browser does not render page correctly, please read the page content below
CULP, INC.
NYSE: CULP
Second Quarter Fiscal 2021
Summary Financial Information
December 3, 2020
SECOND QUARTER FISCAL 2021 FINANCIAL SUMMARY*
Net sales were $76.9 million, up 10.5 percent over the prior-year period, with mattress
fabrics sales up 12.2 percent and upholstery fabrics sales up 8.7 percent.
Pre-tax income from continuing operations for the second quarter of fiscal 2021
improved sequentially to $3.9 million, which included $680,000 in other expense
relating mostly to foreign exchange rate fluctuations associated with China,
compared with pre-tax income from continuing operations of $4.5 million for the
prior-year period, which included $99,000 in other expense.
Net income from continuing operations for the sec0nd quarter of fiscal 2021 was $2.4
million, or $0.19 per diluted share, compared with net income from continuing
operations of $2.2 million, or $0.18 per diluted share, for the prior-year period.
The Company’s financial position reflected increased total cash and investments of
$56.5 million and no outstanding borrowings as of November 1, 2020. This compares
with a net cash position of $37.8 million as of the end of the fourth quarter of fiscal
2020. (See summary of cash and investments table on Slide 13).
* During the fourth quarter of fiscal 2020, the company sold its majority interest in eLuxury, LLC, resulting in the elimination of its home accessories
segment. Accordingly, the financial results for this segment are excluded from the reported financial performance of the company’s continuing
operations and are presented as a discontinued operation in the company’s consolidated financial statements.
2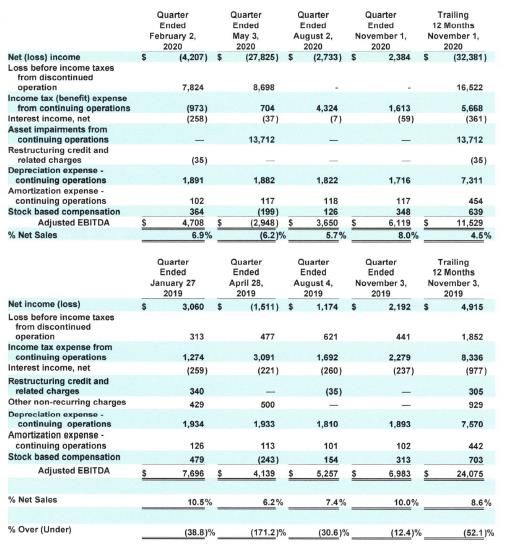
SECOND QUARTER FISCAL 2021 FINANCIAL SUMMARY
(cont’d)
Cash flow from operations and free cash flow for the first six months of fiscal 2021
were $22.7 million and $20.5 million, respectively, compared with cash flow from
operations and free cash flow of $8.2 million and $5.6 million, respectively, for the
prior-year period. (See reconciliation table on slide 25).
The company announced a five percent increase in its quarterly cash dividend to
$0.11 per share, commencing in the third quarter of fiscal 2021. At an annual
indicated dividend of $0.44 per share, the yield is 3.03%, based upon the closing stock
price of $14.50 per share on December 2, 2020. Notably, this is the company’s eighth
straight year of increasing its annual dividend.
3FINANCIAL OUTLOOK
Due to the continued economic impact of the COVID-19 pandemic and the lack of visibility
as to its duration or ultimate impact, the company is providing only limited financial
guidance for fiscal 2021 at this time.
Although subject to unforeseen changes that may arise in connection with the pandemic,
the company is encouraged by the ongoing execution of its product-driven strategy and
continued strength in demand for home furnishing products, as well as its opportunities
for market share growth. The company expects sales and operating income for the third
quarter of fiscal 2021 to be comparable to the prior-year period, with the mattress fabrics
segment continuing its strong rebound and the upholstery fabrics segment facing
ongoing headwinds relating to foreign exchange rate fluctuations associated with its
operations located in China, customer supply chain constraints, and sales mix. The
company also expects sales and operating income for the fourth quarter of fiscal 2021 to
be dramatically improved for both segments as compared to the fourth quarter of fiscal
2020.
4SECOND QUARTER 2021 HIGHLIGHTS*
($ in millions)
Change
GAAP Q2 FY21 Q2 FY20 $ %
Sales $76.9 $69.6 $7.3 10.5%
Operating income from continuing ops $4.5 $4.4 $0.1 2.5%
Operating income margin 5.9% 6.3% (40) bp
Pre-tax income from continuing ops $3.9 $4.5 $(0.6) (14.3)%
Pre-tax margin 5.1% 6.5% (140) bp
Net income from continuing ops $2.4 $2.3 $0.1 5.9%
Net income per diluted share $0.19 $0.18 $0.01 6.6%
* During the fourth quarter of fiscal 2020, we sold our entire ownership interest in eLuxury, LLC, resulting in the elimination
of the home accessories segment at such time. Accordingly, the financial results for this segment are excluded from the
reported financial performance of the company’s continuing operations and are presented as a discontinued operation in the
company’s consolidated financial statements.
5SECOND QUARTER 2021 YEAR TO DATE HIGHLIGHTS*
($ in millions)
Change
GAAP FY21 FY20 $ %
Sales $141.3 $140.3 $1.0 0.7%
Operating income from continuing ops $6.4 $7.7 $(1.3) (16.9)%
Operating income margin 4.5% 5.5% (100) bp
Pre-tax income from continuing ops $5.4 $8.0 $(2.6) (32.3)%
Pre-tax margin 3.8% 5.7% (190) bp
Net income (loss) from continuing ops $(0.3)** $4.0** $(4.3) NM
Net income (loss) per diluted share $(0.03)** $0.33** $(0.36) NM
• The first six months of fiscal 2021 included 26 weeks versus 27 weeks for the first six months of fiscal 2020. Also, during the fourth quarter of
fiscal 2020, we sold our entire ownership interest in eLuxury, LLC, resulting in the elimination of the company’s home accessories segment at
such time. Accordingly, the financial results for this segment are excluded from the reported financial performance of the company’s continuing
operations and are presented as a discontinued operation in the company’s consolidated financial statements.
** Refer also to the Reconciliation of Selected Income Statement Information to Adjusted Results at the back of this presentation.
6SECOND QUARTER 2021 YEAR TO DATE HIGHLIGHTS*
($ in millions)
Change
Adjusted (Non-GAAP)** FY21 FY20Change
$ %
Adjusted (Non-GAAP) * Q1 21 Q1 FY20 $ %
Adjusted net income (loss) from continuing operations $3.8*** $5.1**** $(1.3) (25.5)%
Adjusted net income (loss) from continuing operations per share $0.30*** $0.41**** $(.11) (26.8)%
* The first six months of fiscal 2021 included 26 weeks versus 27 weeks for the first six months of fiscal 2020. Also,
during the fourth quarter of fiscal 2020, we sold our entire ownership interest in eLuxury, LLC, resulting in the elimination
of the company’s home accessories segment at such time. Accordingly, the financial results for this segment are excluded
from the reported financial performance of the company’s continuing operations and are presented as a discontinued
operation in the company’s consolidated financial statements.
** Please see the Reconciliation of Selected Income Statement Information to Adjusted Results at the back of this
presentation.
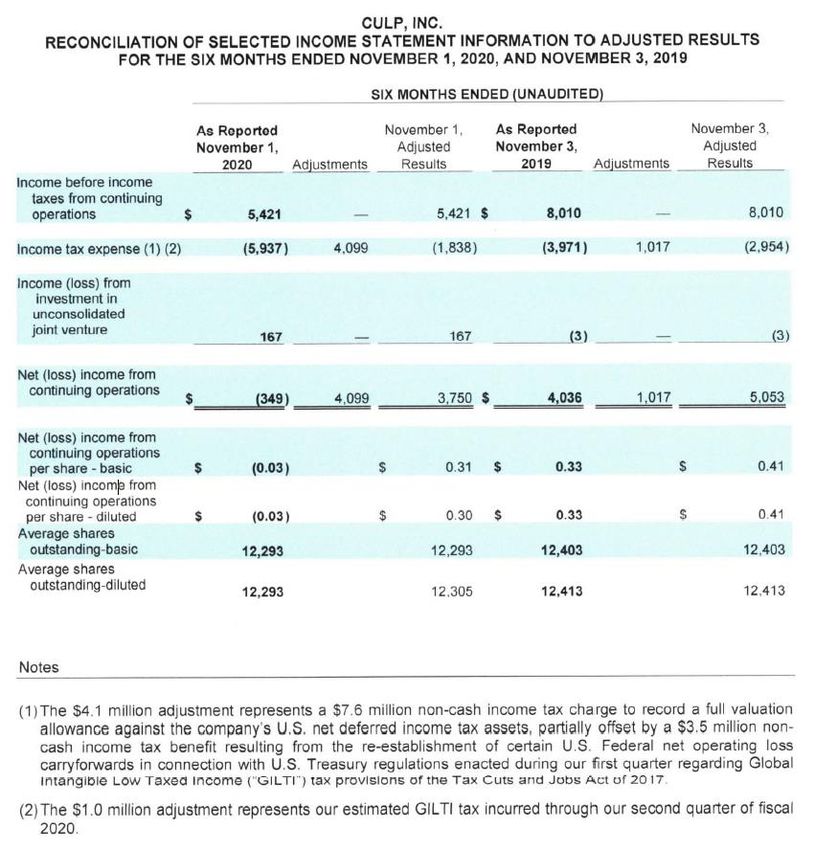
*** Excludes a $4.1 million net income tax charge, which consists of a $7.6 million non-cash income tax charge to record
a full valuation allowance against the company’s U.S. net deferred income tax assets, partially offset by a $3.5 million non-
cash income tax benefit resulting from the re-establishment of certain U.S. Federal net operating loss carryforwards in
connection with the U.S. Treasury regulations enacted during the first quarter of fiscal 2021 regarding the Global
Intangible Low Taxed Income (“GILTI”) tax provisions of the Tax Cuts and Jobs Act of 2017.
**** Excludes a $1.0 million income tax charge, which represents the company’s estimated GILTI tax incurred through the
second quarter of fiscal 2020.
7Q2 SALES & OPERATING INCOME BRIDGES*
($ in millions)
Change
Sales
$ %
Change
Q2 2020 $69.6
$ %
Mattress fabrics increase 4.4 12.2%
Upholstery fabrics increase 2.9 8.7%
Q2 2021 $76.9 10.5%
Change
Operating Income
$ %
Q2 2020 $4.4
Mattress fabrics increase 1.1 33.0%
Upholstery fabrics decrease (0.2) (5.4)%
Unallocated corporate expense increase (0.8) 33.6%
Q2 2021 $4.5 2.5%
* From continuing operations for the quarterly periods ended November 1, 2020, and
November 3, 2019.
8Q2 YTD SALES & OPERATING INCOME BRIDGES*
($ in millions)
Change
Sales
$ %
Change
Q2 YTD 2020 $140.3
$ %
Mattress fabrics increase 1.6 2.2%
Upholstery fabrics decrease (0.6) (0.9)%
Q2 YTD 2021 $141.3 0.7%
Change
Operating Income
$ %
Q2 YTD 2020 $7.7
Mattress fabrics increase 0.3 5.3%
Upholstery fabrics decrease (0.9) (14.9)%
Unallocated corporate expense increase (0.6) 13.9%
Q2 YTD 2021 $6.4 (16.9)%
* From continuing operations for the six month periods ended November 1, 2020, and November 3, 2019.
The first six months of fiscal 2021 included 26 weeks versus 27 weeks for the first six months of fiscal
2020.
9Q2 MATTRESS FABRICS HIGHLIGHTS
($ in millions)
Change
Q2 FY21 Q2 FY20 $ %
Sales $40.0 $35.7 $4.3 12.2%
Operating Income 4.4 3.3 $1.1 33.0%
Operating Income Margin 10.9% 9.2% 170 bp
Depreciation $1.5 $1.7 ($0.2) (11.8)%
10Q2 YTD MATTRESS FABRICS HIGHLIGHTS*
($ in millions)
Change
FY21 FY20 $ %
Sales $76.1 $74.5 $1.6 2.2%
Operating Income 6.2 5.9 $0.3 5.3%
Operating Income Margin 8.2% 7.9% 30 bp
Depreciation $3.1 $3.3 ($0.2) (5.7)%
*For the six month periods ending November 1, 2020, and November 1, 2019. The first six months of fiscal 2021
included 26 weeks versus 27 weeks for the first six months of fiscal 2020.
11Q2 MATTRESS FABRICS KEY POINTS
Strong growth in sales and operating income for mattress fabrics segment during the second quarter.
Pandemic has generated greater consumer awareness and appreciation for overall comfort and wellness within
home environment, leading to increase in discretionary spending on home furnishings, including mattresses.
Built on momentum generated during last eight weeks of first quarter by utilizing product-driven strategy for
both mattress fabrics and sewn covers, as well as global supply chain and dedicated attention to customers.
The strength and flexibility of the division’s global manufacturing and sourcing operations in the U.S., Canada,
Haiti, Asia, and Turkey supported current demand trends and helped meet customer needs.
Growth in sewn mattress cover business continued, with demand trends exceeding pre-pandemic levels. This
trend is driven by ongoing growth in the boxed bedding space, and the division continues to work
collaboratively with new and existing customers to develop fresh, innovative products.
During this uncertain and rapidly evolving environment, business is being managed with a firm focus on
creative designs, innovative products, and exceptional service. The division is also continuing its developments
in product innovation, including expanding specialty finish options and virtual rendering services.
Expect increased capacity in North America resulting from investment in additional equipment will be available
during fourth quarter of fiscal 2021.
Believe domestic mattress industry and, in turn, mattress fabrics segment, will benefit from recent preliminary
antidumping duties imposed by U.S. Department of Commerce on mattress importers from seven countries.
Barring additional shutdowns or significant disruption in customers’ supply chain for raw materials other than
fabric, the mattress fabric segment is expected to be well positioned to execute strategy and increase market
share during second half of fiscal 2021.
12Q2 UPHOLSTERY FABRICS HIGHLIGHTS
($ in millions)
Change
Q2 FY21 Q2 FY20 $ %
Sales $36.8 $33.9 $2.9 8.7%
Operating Income $3.3 $3.5 $(0.2) (5.4)%
Operating Income Margin 8.9% 10.2% (130) bp
Depreciation $0.2 $0.2 $0.0 NM
13Q2 YTD UPHOLSTERY FABRICS HIGHLIGHTS*
($ in millions)
Change
FY21 FY20 $ %
Sales $65.2 $65.7 $(0.5) (0.9)%
Operating Income 5.4 6.3 $(0.9) (14.9)%
Operating Income Margin 8.3% 9.7% (140) bp
Depreciation $0.4 $0.4 $0.0 NM
*For the six month periods ending November 1, 2020, and November 1, 2019. The first six months of fiscal 2021
included 26 weeks versus 27 weeks for the first six months of fiscal 2020.
14Q2 UPHOLSTERY FABRICS KEY POINTS Solid growth in upholstery fabric sales for the second quarter, as residential upholstery business saw a significant increase in sales compared to prior-year period, driven primarily by the increased consumer focus on the at-home experience and overall comfort. Strong platform in Asia, including expanded cut and sew capabilities in Vietnam and stable, long-term supplier relationships, has allowed for quick response to meet upsurge in demand from customers and increased market share. Historically strong backlog in residential upholstery business reflects ongoing favorable demand trends for this business. Our line of highly durable, stain-resistant LiveSmart® performance fabrics and LiveSmart Evolve® performance plus sustainability fabrics continued to experience favorable demand trends. Also recently launched LiveSmart Ultra™, featuring a new anti-microbial finish as the next step in our LiveSmart performance brand evolution. Hospitality business remained under pressure by COVID-19 disruption that continued to affect travel and leisure industries. These lingering pressures also affected Read Window Products during the quarter. While sales for hospitality business remained relatively stable compared to first quarter, the disruption in hospitality and leisure is expected to continue to affect this business in near-term. Material sequential improvement in operating income as compared to first quarter of fiscal 2021, but operating income as compared to prior-year period was materially affected by unfavorable China foreign exchange rate fluctuations, as well as sales mix. These factors are expected to continue to affect operating income during third quarter. Encouraged by strong backlog in residential upholstery business and confident in ability to meet demand. Expect strong performance in residential upholstery business to continue, absent additional pandemic-related shutdowns or material disruption in our customers’ supply chain. 15
FREE CASH FLOW*
     ($ in millions)
                                                                         Q2 FY21   Q2 FY20
                                                                          YTD       YTD
              Net income                                                   -0.3      3.4
              Depreciation, amortization, & stock-based compensation       4.2       4.7
              Deferred taxes, other                                        5.0      (0.1)
                  Gross cash flow                                          8.9       7.9
              Cash flow from working capital and
                                                                          13.8       0.3
              changes in other assets/liabilities
                  Cash flow from operations                               22.7       8.2
              Capital expenditures, including payments that are vendor
                                                                          (2.0)     (2.4)
              financed
              Investment in unconsolidated joint venture                  (0.1)      0.0

              Other                                                       (0.1)     (0.2)
                  Free cash flow                                          $20.5     $5.6
         * See reconciliation at the back of this presentation.

16
ADJUSTED EBITDA
Reconciliation of Net Income to Adjusted EBITDA
17OPERATING WORKING CAPITAL
($ in millions)
November 1, November 3, % Change
May 1,2020
2016 May 3, 2015 % Change
2019
Accounts receivable, net $33.0 $23.9 38.0%
Inventories, net 47.7 51.4 (7.2)%
Accounts payable (38.2) (26.3) 45.2%
Accounts payable – capital expenditures (0.1) (0.4) (82.9)%
Operating working capital $42.4 $48.6 (12.8)%
Percent of sales* 15.0% 17.3% (230) bp
Days sales outstanding 38.6 30.3 27.5%
Inventory turns 5.6 4.5 24.4%
Days accounts payable outstanding** 55.7 44.0 26.6%
* Sales used in the calculation is an annualized amount derived from the year-to-date net sales.
** Accounts payable also includes accounts payable – capital expenditures.
18NET CASH, INVESTMENTS, AND EQUITY
($ and share amounts in millions)
Q2 FY21 Q4 FY20 Q2 FY20
Cash and cash equivalents $45.3 $69.8 $47.2
Short-term investments (Available for Sale) 5.0 0.9 0.0
Short-term investments (Held-to-Maturity) 5.5 4.3 0.0
Long-term investments (Held-to-Maturity) 0.8 2.1 0.0
Total cash and investments $56.5 $77.1 $47.2
Total debt $ 0.0 $38.4 $ 0.0
Net cash and investments $56.5 $38.7 $47.2
Shareholders’ equity attributable to Culp, Inc. $127.3 $129.7 $161.5
Shares outstanding 12,303 12,285 12,412
Book value per share $10.35 $10.56 $13.01
* As of the end of second quarter of fiscal 2020, cash and cash equivalents totaled $47.2 million, of which $47.0 million and
$228,000 were classified as (i) cash and cash equivalents and (ii) within current assets – discontinued operation,
respectively, in the accompanying Consolidated Balance Sheets.
19CULP, INC. NYSE:CULP www.culp.com Investor Contact: Ken Bowling, Chief Financial Officer 336-881-5630
FORWARD LOOKING STATEMENTS

     This presentation contains “forward-looking statements” within the meaning of the federal securities laws, including the Private Securities Litigation
     Reform Act of 1995 (Section 27A of the Securities Act of 1933 and Section 21E of the Securities and Exchange Act of 1934). Such statements are
     inherently subject to risks and uncertainties that may cause actual events and results to differ materially from such statements. Further, forward
     looking statements are intended to speak only as of the date on which they are made, and we disclaim any duty to update such statements to reflect
     any changes in management’s expectations or any change in the assumptions or circumstances on which such statements are based, whether due to
     new information, future events, or otherwise. Forward-looking statements are statements that include projections, expectations, or beliefs about
     future events or results or otherwise are not statements of historical fact. Such statements are often but not always characterized by qualifying
     words such as “expect,” “believe,” “anticipate,” “estimate,” “intend,” “plan,” “project,” and their derivatives, and include but are not limited to
     statements about expectations for our future operations, production levels, new product launches, sales, profit margins, profitability, operating
     income, capital expenditures, working capital levels, income taxes, SG&A or other expenses, pre-tax income, earnings, cash flow, and other
     performance or liquidity measures, as well as any statements regarding potential acquisitions, future economic or industry trends, public health
     epidemics, or future developments. There can be no assurance that the company will realize these expectations, meet its guidance, or that these
     beliefs will prove correct.

     Factors that could influence the matters discussed in such statements include the level of housing starts and sales of existing homes, consumer
     confidence, trends in disposable income, and general economic conditions. Decreases in these economic indicators could have a negative effect on
     our business and prospects. Likewise, increases in interest rates, particularly home mortgage rates, and increases in consumer debt or the general
     rate of inflation, could affect us adversely. The future performance of our business depends in part on our success in conducting and finalizing
     acquisition negotiations and integrating acquired businesses into our existing operations. Changes in consumer tastes or preferences toward
     products not produced by us could erode demand for our products. Changes in tariffs or trade policy, or changes in the value of the U.S. dollar versus
     other currencies, could affect our financial results because a significant portion of our operations are located outside the United States.
     Strengthening of the U.S. dollar against other currencies could make our products less competitive on the basis of price in markets outside the
     United States, and strengthening of currencies in Canada and China can have a negative impact on our sales of products produced in those places.
     Also, economic and political instability in international areas could affect our operations or sources of goods in those areas, as well as demand for
     our products in international markets. The impact of public health epidemics on employees, customers, suppliers, and the global economy, such as
     the global coronavirus pandemic currently affecting countries around the world, could also adversely affect our operations and financial
     performance. In addition, the impact of potential goodwill or intangible asset impairments could affect our financial results. Finally, increases in
     market prices for petrochemical products can significantly affect the prices we pay for raw materials, and in turn, increase our operating costs and
     decrease our profitability. Further information about these factors, as well as other factors that could affect our future operations or financial
     results and the matters discussed in forward-looking statements, is included in Item 1A “Risk Factors” in our most recent Form 10-K and Form 10-Q
     reports filed with the Securities and Exchange Commission. A forward-looking statement is neither a prediction nor a guarantee of future events or
     circumstances, and those future events or circumstances may not occur.

21
ABOUT NON-GAAP FINANCIAL INFORMATION
This presentation contains adjusted income statement information, which discloses adjusted net income, adjusted earnings per share, and adjusted
income tax rate information, all non-GAAP performance measures that eliminate a non-cash income tax charge in connection with the recordation
of a full valuation allowance against the Company’s U.S. net deferred income tax assets, as well as a non-cash income tax benefit resulting from the
re-establishment of certain U.S. Federal net operating loss carryforwards in connection with the recently enacted final regulations regarding the
Global Intangible Low Taxed Income (“GILTI”) tax provisions of the Tax Cuts and Jobs Act of 2017. The company has included this adjusted
information in order to show operational performance excluding the effects of this non-cash income tax charge and non-cash income tax benefit,
which are not expected to occur on a regular basis. Details of these calculations and a reconciliation to information from our GAAP financial
statements are set forth in the back of this presentation. Management believes this presentation aids in the comparison of financial results among
comparable financial periods. We note, however, that this adjusted income statement information should not be viewed in isolation or as a
substitute for net income, earnings per share, or income tax rate information calculated in accordance with GAAP. In addition, the calculation of the
company’s income taxes involves numerous estimates and assumptions, which we have made in good faith.
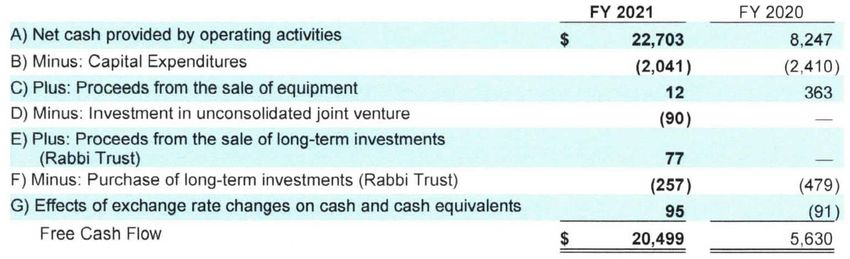
This presentation contains disclosures about free cash flow, a non-GAAP liquidity measure that we define as net cash provided by (used in)
operating activities, less cash capital expenditures, plus any proceeds from sale of property, plant, and equipment, less investment in
unconsolidated joint venture, plus proceeds from life insurance policies (if any), less premium payments on life insurance policies (if any), less
payments on vendor-financed capital expenditures, plus proceeds from the sale of long-term investments associated with our rabbi trust, less the
purchase of long-term investments associated with our rabbi trust, and plus or minus the effects of foreign currency exchange rate changes on cash
and cash equivalents. Details of these calculations and a reconciliation to information from our GAAP financial statements are set forth in the back
of this presentation. Management believes the disclosure of free cash flow provides useful information to investors because it measures our
available cash flow for potential debt repayment, stock repurchases, dividends, and additions to cash and investments. We note, however, that not
all of the company’s free cash flow is available for discretionary spending, as we may have mandatory debt payments and other cash requirements
that must be deducted from our cash available for future use. In operating our business, management uses free cash flow to make decisions about
what commitments of cash to make for operations, such as capital expenditures (and financing arrangements for these expenditures), purchases of
inventory or supplies, SG&A expenditure levels, compensation, and other commitments of cash, while still allowing for adequate cash to meet
known future commitments for cash, such as debt repayment, and also for making decisions about dividend payments and share repurchases.
22ABOUT NON-GAAP FINANCIAL INFORMATION (2)
This presentation contains disclosures about our Adjusted EBITDA, which is a non-GAAP performance measure that reflects net (loss) income
excluding loss before income taxes from discontinued operations, income tax expense (benefit) from continuing operations, and net interest
income, as well as depreciation expense from continuing operations, amortization expense, and stock-based compensation expense. This measure
also excludes asset impairment charges from continuing operations, restructuring and related charges and credits, as well as other non-recurring
charges and credits associated with our business. Details of these calculations and a reconciliation to information from our GAAP financial
statements are set forth in this presentation. We believe presentation of Adjusted EBITDA is useful to investors because earnings before interest
income and expense, income taxes, depreciation and amortization, and similar performance measures that exclude certain charges from earnings,
are often used by investors and financial analysts in evaluating and comparing companies in our industry. We note, however, that such measures
are not defined uniformly by various companies, with differing expenses being excluded from net income to calculate these performance measures.
For this reason, Adjusted EBITDA should not be viewed in isolation by investors and should not be used as a substitute for net income calculated in
accordance with GAAP, nor should it be used for direct comparisons with similarly titled performance measures reported by other companies. Use
of Adjusted EBITDA as an analytical tool has limitations in that this measure does not reflect all expenses that are necessary to fund and operate our
business, including funds required to pay taxes, service our debt, and fund capital expenditures, among others. Management uses Adjusted EBITDA
to help it analyze the company’s earnings and operating performance, by excluding the effects of expenses that depend upon capital structure and
debt level, tax provisions, and non-cash items such as depreciation, amortization and stock-based compensation expense that do not require
immediate uses of cash.
23Q2 YTD RECONCILIATION OF SELECTED INCOME STATEMENT
INFORMATION TO ADJUSTED RESULTS
24RECONCILIATION OF FREE CASH FLOW
RECONCILIATION OF FREE CASH FLOW
FOR THE SIX MONTHS ENDED NOVEMBER 1, 2020, AND NOVEMBER 3, 2019
(UNAUDITED)
(AMOUNTS IN THOUSANDS)
* As of November 3, 2019, cash and cash equivalents totaled $47.2 million, of which $47.0 million and $228,000 were classified
as (i) cash and cash equivalents and (ii) within current assets - discontinued operation, respectively, in the accompanying
Consolidated Balance Sheets.
25You can also read