ANALYST AND INVESTOR PRESENTATION HY18 RESULTS
←
→
Page content transcription
If your browser does not render page correctly, please read the page content below
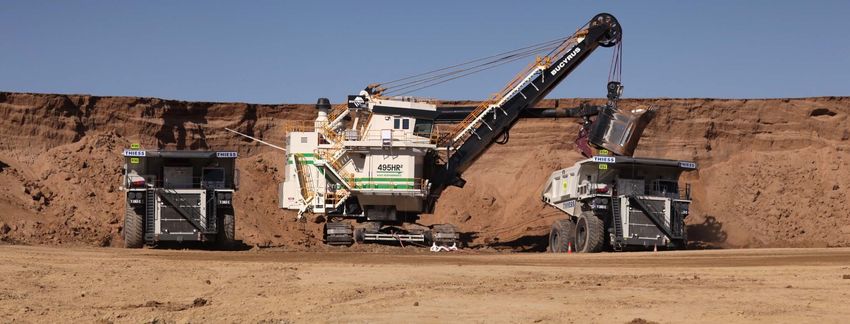
ANALYST AND INVESTOR PRESENTATION
HY18 RESULTS
Marcelino Fernández Verdes, Executive Chairman
Michael Wright, Chief Executive Officer
Stefan Camphausen, Chief Financial Officer

 Mining services at the Curragh
 Coal Mine, Queensland; Thiess;
 $160 million

18 JULY 2018
Refer to ‘ASX/Media Release’ for further information
HY18 financial highlights NPAT up 12% YOY to $363m NPAT ($m) Revenue1 of $6.9bn up 11% YOY, with growth in all Operating Companies (OpCo) 323 +12% 363 Strong EBIT, PBT and NPAT margins2 of 7.7%, 7.3% and 5.2% respectively Half year dividend of 70cps, up 17% YOY, fully franked Strong cash generation, with cash flow from operating activities3 of $724m, up 17% YOY HY17 HY18 Maintained strong EBITDA cash conversion of 102% in LTM Cash flow from operating activities of $1.6bn in LTM Dividend per share (cents) Generated free operating cash flow4 of $1.1bn in LTM 70.0 Strict focus on managing working capital and generating sustainable cash backed profits 60.0 +17% Balance sheet further strengthened, with a net cash position of $1.3bn, up by $691m YOY $2.5bn of undrawn debt facilities at end of June 2018 S&P affirmed its strong investment grade rating of BBB and upgraded the outlook to stable HY17 HY18 Robust order book with $34.8bn work in hand5; OpCo work in hand increasing by 7% or up by $2.1bn YOY Cash flow from operating activities ($m) New work6 of $7.1bn awarded in HY18; disciplined bidding maintained 724 Extensive project pipeline in our key markets/activities provides business opportunities 620 +17% $80bn of tenders relevant to CIMIC to be bid and/or awarded in 2018, and around $330bn of projects are coming to the market in 2019 and beyond, including about $100bn worth of PPP projects FY18 NPAT guidance confirmed, $720m‐$780m, up 3%‐11% YOY subject to market conditions Positive outlook for core markets supports guidance: construction and services boosted by strong PPP pipeline; HY17 HY18 mining further strengthens Net cash ($bn) Sound balance sheet provides flexibility to pursue strategic growth initiatives, capital allocation opportunities and 1.3 to sustain shareholder returns 0.9 0.9 0.6 Jun 17 Dec 17 Mar 18 Jun 18 HY18 Results 18 July 2018 2
Solid operating performance in HY18 Revenue of $6.9bn up 11% YOY, with growth in all Operating Companies Revenue ($m) Revenue from construction increased 9.8% YOY, mining and mineral processing rose by 16.8% YOY and services +11% 6,937 6,279 grew by 4.8% YOY Strong EBIT, PBT and NPAT margins of 7.7%, 7.3% and 5.2% respectively, driven by ongoing focus on project delivery and cost discipline Higher net finance costs mainly due to a reduction in shareholder loans to BIC7 HY17 HY18 NPAT of $363m for HY18, up 12% YOY No significant one‐off impacts to result PBT ($m) +14% 503 442 Financial performance ($m) HY17 HY18 Chg. % 2Q17 2Q18 Chg. % Revenue 6,279.4 6,937.4 10.5% 3,278.0 3,712.4 13.3% EBITDA 713.3 794.3 11.4% 370.3 425.9 15.0% EBITDA margin 11.4% 11.4% ‐ 11.3% 11.5% 20bp HY17 HY18 D&A (251.8) (258.5) 2.7% (138.3) (143.2) 3.5% EBIT 461.5 535.8 16.1% 232.0 282.7 21.9% NPAT ($m) EBIT margin 7.3% 7.7% 40bp 7.1% 7.6% 50bp +12% 363 323 Net finance costs (19.7) (32.8) 66.5% (9.6) (16.6) 72.9% Profit before tax 441.8 503.0 13.9% 222.4 266.1 19.6% PBT margin 7.0% 7.3% 30bp 6.8% 7.2% 40bp Income tax (123.7) (145.9) 17.9% (62.0) (77.2) 24.5% HY17 HY18 Effective tax rate 28.0% 29.0% 100bp 27.9% 29.0% 110bp Non‐controlling interests 4.8 5.9 22.9% 2.2 2.1 (4.5)% Earnings per share - basic (cents) NPAT 322.9 363.0 12.4% 162.6 191.0 17.5% 111.9 +12% NPAT margin 99.6 5.1% 5.2% 10bp 5.0% 5.1% 10bp EPS (basic) 99.6c 111.9c 12.3% 50.1c 58.9c 17.6% HY17 HY18 HY18 Results 18 July 2018 3
Ongoing strong cash generation and stable EBITDA conversion Cash flow from operating activities of $724m in HY18 and $1.6bn in LTM Maintained strong EBITDA cash conversion of 102% in LTM Cash flow from operating activities ($m) Strict focus on managing working capital and generating sustainable cash backed profits 724 +17% 620 Generated free operating cash flow of $1.1bn in LTM Ongoing investment through capital expenditure into the growth of the business, reflecting opportunities in mining and tunnelling activity HY17 HY18 EBITDA conversion ($m) HY17 HY18 Chg. % 2Q17 2Q18 Chg. % LTM Cash flows from operating activities (a) 620.4 723.6 16.6% 519.6 605.4 16.5% 1,626.6 EBITDA conversion ($m) EBITDA (b) 713.3 794.3 11.4% 370.3 425.9 15.0% 1,594.7 1,595 102% 1,627 EBITDA conversion (a)/(b) 87% 91% 140% 142% 102% Cash flow ($m) HY17 HY18 Chg. % 2Q17 2Q18 Chg. % LTM LTM Jun 18 Cash flows from operating activities 620.4 723.6 16.6% 519.6 605.4 16.5% 1,626.6 EBITDA Cash flow from op. activities Interest, finance costs, taxes and dividends (87.0) (87.2) 0.2% (27.3) (53.3) 95.2% (161.2) received Net cash from operating activities 533.4 636.4 19.3% 492.3 552.1 12.1% 1,465.4 Movement in net cash ($m) 636 (235) 8 (12) 1,299 Gross capital expenditure (201.5) (246.4) 22.3% (101.8) (139.4) 36.9% (469.0) 910 Gross capital proceeds9 12.2 11.9 (2.5)% 6.1 9.8 60.7% 118.3 Net capital expenditure (189.3) (234.5) 23.9% (95.7) (129.6) 35.4% (350.7) Net cash Net cash from Net capital Other Net cash Dec 2017 operating expenditure Jun 2018 activities Free operating cash flow 344.1 401.9 16.8% 396.6 422.5 6.5% 1,114.7 HY18 Results 18 July 2018 4
Strengthened balance sheet, net cash improved to $1.3bn Net cash up by $0.7bn YOY to $1.3bn Net contract debtors development in line with revenue growth10 $675m contract debtors portfolio provision remains unchanged Cost of debt down 50bp YOY to 3.9% Higher net finance costs mainly due to a reduction in shareholder loans to BIC Net cash ($bn) $2.5bn of undrawn debt facilities available at June 2018 1.3 S&P affirmed its strong investment grade rating of BBB and upgraded the outlook to stable 0.9 0.9 Jun Dec Jun 0.6 Net cash/(debt) ($m) 2017 2017 2018 Net cash/(debt) 607.5 910.4 1,298.7 Operating leases (450.4) (538.6) (525.5) Jun 17 Dec 17 Mar 18 Jun 18 Net cash/(debt) (incl. op. leases) 157.1 371.8 773.2 Mar Jun Net contract debtors ($m) 2018 2018 Net contract debtors (comparable)10 884.0 988.0 Finance cost detail ($m) HY17 HY18 Average cost of debt (%) Debt interest expenses (39.8) (34.5) 4.4% Facility fees, bonding and other costs11 (14.9) (23.3) 50bp 3.9% Total finance costs (54.7) (57.8) Interest income 35.0 25.0 Net finance costs12 (19.7) (32.8) Finance cost detail ($m) HY17 HY18 HY17 HY18 Debt interest expenses (a) (39.8) (34.5) Gross debt13 at period end 1,083.5 882.2 Gross debt period average (b) 1,818.5 1,787.7 Average cost of debt 4.4% 3.9% HY18 Results 18 July 2018 5
Strong WIH levels in Operating Companies maintained Work in hand of $34.8bn, equivalent to over 2 years’ revenue $4.5bn of new work awarded in 2Q18, representing an increase of 73% in 2Q18 vs 1Q18; bidding discipline maintained Work in hand ($bn) Operating Companies’ work in hand up by $2.1bn YOY or 7%, with a significant number of projects announced during the period 35.2 35.7 36.0 34.6 34.8 5.5 4.6 4.0 3.4 3.0 Several major contract wins YTD, domestically and internationally, including amongst others: Infrastructure works for the South Flank Project, WA Mineral processing operations at New Century Mine, QLD 29.7 31.1 32.0 31.2 31.8 Mining services at Rocky’s Reward nickel mine, WA North‐South Transportation Corridor Project, Singapore Contract extension at Curragh Coal Mine and QCoal Maintenance, project and shutdown services contracts in Jun 17 Sept 17 Dec 17 Mar 18 Jun 18 Northern Hub, QLD the resource sector across Australia Operating Companies Corporate Extensive pipeline across all Operating Companies Relevant to CIMIC, at least $80bn of tenders to be bid and/or awarded in 2018, and around $330bn of projects are Work in hand by activity Jun 18 (%) coming to the market in 2019 and beyond, including about $100bn worth of PPP projects. Corporate 9% Some major projects that CIMIC is currently bidding include: Services 19% WestConnex Rozelle Interchange and Iron Cove Link in NSW Cross River Rail PPP in QLD Construction 42% Snowy Hydro 2.0 in NSW North‐South Corridor in Singapore Parramatta Light Rail in NSW Kai Tak Sports Park in Hong Kong Mining & mineral processing 30% Sydney Metro (construction and O&M) in NSW and Mining and processing opportunities in NSW, QLD and WA Melbourne Metro Rail link in VIC Various projects in Canada and Chile including additional Suburban Roads Upgrade Projects PPP in VIC mining works in the oil sands and AMSA Minera Centinelas as well as the Jwaneng expansion project in Botswana Work in hand by activity Jun 17 (%) Corporate 16% Work in hand ($m) as at Jun 17 Dec 17 Mar 18 Jun 18 Construction 15,191 14,929 14,407 14,687 Services 14% Construction 43% Mining & mineral processing 9,577 10,445 10,200 10,400 Services 4,927 6,663 6,610 6,753 Mining & mineral Operating Companies’ work in hand processing 27% 29,695 32,037 31,217 31,840 Corporate14 5,552 3,973 3,398 2,967 Total work in hand 35,247 36,010 34,615 34,807 HY18 Results 18 July 2018 6

Continued focus on delivering shareholder returns, guidance confirmed Dividends Dividend per share (cents) 70.0 Interim ordinary dividend of 70.0 cents per share ($227m), up 17% YOY, franked at 100%, payable +17% 60.0 on 4 October 2018; representing payout ratio of 63% Final ordinary dividend for the 2017 year of 75 cents per share ($243m), up 21% YOY, franked at 100%, paid on 4 July 2018 HY17 HY18 FY18 NPAT guidance ($m) FY18 NPAT guidance confirmed, $720m‐$780m, up 3%‐11% YOY subject to market conditions +3 to +11% Positive outlook for core markets supports guidance: construction and services boosted by 702 $720m‐$780m expanding PPP pipeline; mining further strengthens Sound balance sheet provides flexibility to pursue strategic growth opportunities and sustain shareholder returns FY17 FY18 HY18 Results 18 July 2018 7

APPENDICES

Financial highlights
 Financial performance ($m) HY17 HY18 Chg. $ Chg. % FY17
 Revenue 6,279.4 6,937.4 658.0 10.5% 13,429.5
 EBITDA 713.3 794.3 81.0 11.4% 1,513.7
 EBITDA margin 11.4% 11.4% ‐ 11.3%
 EBIT 461.5 535.8 74.3 16.1% 1,002.4
 EBIT margin 7.3% 7.7% 40bp 7.5%
 Profit before tax 441.8 503.0 61.2 13.9% 959.2
 PBT margin 7.0% 7.3% 30bp 7.1%
 NPAT 322.9 363.0 40.1 12.4% 702.1
 NPAT margin 5.1% 5.2% 10bp 5.2%
 EPS (basic) 99.6c 111.9c 12.3c 12.3% 216.5c
 Financial position ($m) Dec 17 Jun 18 Chg. $ Chg. % Jun 17
 Net cash/(debt) 910.4 1,298.7 388.3 42.7% 607.5
 Operating leases (538.6) (525.5) 13.1 (2.4)% (450.4)
 Net cash/(debt) (including operating leases) 371.8 773.2 401.4 108.0% 157.1

 Net contract debtors10 (pre transition) 1,383.8 ‐ ‐ ‐ 1,238.7
 Net contract debtors10 (comparable) 717.9 988.0 270.1 37.6% ‐
 Cash flows ($m) HY17 HY18 Chg. $ Chg. % FY17
 Cash flows from operating activities 620.4 723.6 103.2 16.6% 1,523.4
 Interest, finance costs, taxes and dividends received (87.0) (87.2) (0.2) 0.2% (161.0)
 Net cash from operating activities 533.4 636.4 103.0 19.3% 1,362.4
 Gross capital expenditure (201.5) (246.4) (44.9) 22.3% (424.1)
 Gross capital proceeds 12.2 11.9 (0.3) (2.5)% 118.6
 Net capital expenditure (189.3) (234.5) (45.2) 23.9% (305.5)
 Free operating cash flow 344.1 401.9 57.8 16.8% 1,056.9
 Work in hand ($m) Jun 17 Jun 18 Chg. $ Chg. % Dec 17
 Work in hand beginning of period 34,012.0 36,009.9 1,997.9 5.9% 34,012.0
 New work 8,896.6 7,142.5 (1,754.1) (19.7)% 18,369.5
 Acquisition / (divestment)15 ‐ ‐ ‐ ‐ (260.9)
 Executed work (7,661.2) (8,345.3) (684.1) 8.9% (16,110.7)
 Total work in hand end of period 35,247.4 34,807.1 (440.3) (1.2)% 36,009.9

HY18 Results 18 July 2018 9
Statement of financial performance
 Key figures ($m) HY17 HY18 Chg. $ Chg. %

 Revenue 6,279.4 6,937.4 658.0 10.5%

 Expenses (5,802.1) (6,422.5) (620.4) 10.7%

 Share of profit/(loss) of associate and joint
 (15.8) 20.9 36.7 ‐
 venture entities

 EBIT 461.5 535.8 74.3 16.1%

 EBIT margin 7.3% 7.7% 40bp

 Net finance costs (19.7) (32.8) (13.1) 66.5%

 Profit before tax 441.8 503.0 61.2 13.9%

 PBT margin 7.0% 7.3% 30bp

 Income tax (123.7) (145.9) (22.2) 17.9%

 Profit for the year 318.1 357.1 39.0 12.3%

 Non‐controlling interests 4.8 5.9 1.1 22.9%

 NPAT 322.9 363.0 40.1 12.4%

 NPAT margin 5.1% 5.2% 10bp

 EPS (basic) 99.6c 111.9c 12.3c 12.3%

HY18 Results 18 July 2018 10
Segment performance Revenue ($m) HY17 HY18 Chg. $ Chg. % Strong performance in Operating Companies Construction 3,556.0 3,905.9 349.9 9.8% Construction Ongoing revenue growth in positive infrastructure market environment, with Mining & mineral 1,515.2 1,770.5 255.3 16.8% continued focus on disciplined tendering, cost control and project delivery processing Results reflect substantial contribution from a number of large scale transport Services 1,174.0 1,230.4 56.4 4.8% infrastructure projects Corporate 34.2 30.6 N/A N/A Mining & mineral processing Revenue 6,279.4 6,937.4 658.0 10.5% Revenue growth driven by contract extensions, increased production levels and additional mining & mineral processing contracts Segment PBT ($m) HY17 HY18 Chg. $ Chg. % Margins benefitting from continued focus on driving efficiencies and creating value for customers Construction 287.5 317.9 30.4 10.6% Mining & mineral Services 151.0 186.8 35.8 23.7% processing Revenue increase reflects the Group’s solid position in the operations and Services 65.5 74.3 8.8 13.4% maintenance services market Corporate (62.2) (76.0) N/A N/A Corporate PBT 441.8 503.0 61.2 13.9% The HY18 corporate segment mainly includes contributions from Corporate, EIC Activities, Pacific Partnerships, Commercial & Residential business and the former BIC segment HY18 Results 18 July 2018 11
Statement of financial position – assets Assets ($m) Dec 2017 Jun 2018 Chg. $ Chg. % Composition Current assets Current assets: Cash and cash equivalents: Cash and cash equivalents Cash and cash equivalents 1,813.8 2,180.9 367.1 20.2% was $2,180.9m at 30 June 2018, an increase of 20.2%, Trade and other receivables or $367.1m, compared to 31 December 2017 3,216.3 2,976.5 (239.8) (7.5)% Trade and other receivables: Includes amounts due Current tax assets 29.0 75.7 46.7 161.0% from customers, sundry debtors, joint venture and other receivables Inventories: consumables and Inventories: consumables and development properties: 210.8 233.1 22.3 10.6% development properties Includes consumables and commercial & residential assets Assets held for sale 32.2 40.7 8.5 26.4% Total current assets 5,302.1 5,506.9 204.8 3.9% Non‐current assets Non‐current assets: Trade and other receivables: Includes non‐current loan Trade and other receivables 1,090.8 646.2 (444.6) (40.8)% receivables owed by BIC Inventories: development properties (16.4) Property, plant and equipment: Additions to property, 167.6 151.2 (9.8)% plant and equipment during the period included Investments accounted for using the investment in job‐costed tunnelling machines for major 382.7 88.4 (294.3) (76.9)% road and rail projects, and capital expenditure on equity method equipment for mining projects Other investments 169.2 176.8 7.6 4.5% Investment accounted for using the equity method: Equity accounted investments include project related Deferred tax assets 145.4 103.9 (41.5) (28.5)% associates and joint ventures as well as PPP projects Property, plant and equipment 1,224.0 1,262.6 38.6 3.2% Intangibles 1,089.7 1,063.0 (26.7) (2.5)% Total non‐current assets 4,269.4 3,492.1 (777.3) (18.2)% Total assets 9,571.5 8,999.0 (572.5) (6.0)% HY18 Results 18 July 2018 12
Statement of financial position – liabilities and equity Liabilities and equity ($m) Dec 2017 Jun 2018 Chg. $ Chg. % Composition Current liabilities Current and non‐current liabilities: Trade and other payables: Includes amounts due to Trade and other payables 4,737.4 5,211.5 474.1 10.0% customers, trade creditors and accruals, joint venture payables, and other creditors Dividend payable ‐ 243.2 243.2 ‐ Provisions: Relates to wages and salaries, annual leave, long service leave, retirement benefits and Current tax liabilities 40.4 48.8 8.4 20.8% deferred bonuses Interest bearing liabilities: Current and non‐current Provisions 311.8 323.1 11.3 3.6% interest bearing liabilities were $882.2m at 30 June 2018, a decrease of 2.3%, or $21.2m, Interest bearing liabilities 265.6 173.4 (92.2) (34.7)% compared to 31 December 2017 Total current liabilities 5,355.2 6,000.0 644.8 12.0% Equity: Non‐current liabilities The reduction in equity in the period is primarily due to the initial impact of applying AASB 15 and Trade and other payables 152.0 124.9 (27.1) (17.8)% AASB 9 Provisions 69.3 71.6 2.3 3.3% Deferred tax liabilities ‐ 21.8 21.8 ‐ Interest bearing liabilities 637.8 708.8 71.0 11.1% Total non‐current liabilities 859.1 927.1 68.0 7.9% Total liabilities 6,214.3 6,927.1 712.8 11.5% Total equity 3,357.2 2,071.9 (1,285.3) (38.3)% HY18 Results 18 July 2018 13
Statement of cash flows
 Key figures ($m) HY17 HY18 Chg. $ Chg. %
 Cash flows from operating activities 620.4 723.6 103.2 16.6%
 Interest, finance costs, taxes and dividends received (87.0) (87.2) (0.2) 0.2%
 Net cash from operating activities 533.4 636.4 103.0 19.3%
 Payments for intangibles (6.5) (3.2) 3.3 (50.8)%
 Payments for property, plant and equipment (201.5) (246.4) (44.9) 22.3%
 Proceeds from sale of property, plant and equipment 12.2 11.9 (0.3) (2.5)%
 Proceeds from sale of investments ‐ 1.2 1.2 ‐
 Income tax paid on sale of investments (59.0) ‐ 59.0 ‐
 Payments for investments (13.5) (15.4) (1.9) 14.1%
 Loans to associates and joint ventures (40.9) (0.9) 40.0 (97.8)%
 Net cash from investing activities (309.2) (252.8) 56.4 (18.2)%
 Cash payments in relation to employee share plans (3.4) ‐ 3.4 ‐
 Net proceeds/(repayments) of borrowings (32.6) (43.1) (10.5) 32.2%
 Repayment of finance leases (10.5) ‐ 10.5 ‐
 Payments to acquire non‐controlling interest (29.3) ‐ 29.3 ‐
 Net cash from financing activities (75.8) (43.1) 32.7 (43.1)%

HY18 Results 18 July 2018 14
Group revenue by activity and market
% BY ACTIVITY (HY18) % BY MARKET (HY18)
 Corporate 13%

 International 28%
 Services
 18% Construction 47%
 Domestic 72%

 Mining & mineral
 processing 22%

% BY ACTIVITY (HY17) % BY MARKET (HY17)
 Corporate 15%

 International 30%
 Services
 18% Construction 46%

 Domestic 70%
 Mining & mineral
 processing 21%

HY18 Results 18 July 2018 15
Work in hand by activity and market
% BY ACTIVITY (JUNE 2018) % BY MARKET (JUNE 2018)
 Corporate 9%

 Services International 26%
 19%
 Construction 42%

 Domestic 74%

 Mining & mineral
 processing 30%

% BY ACTIVITY (JUNE 2017) % BY MARKET (JUNE 2017)

 Corporate 16%

 International 28%
 Services
 14% Construction 43%
 Domestic 72%

 Mining & mineral
 processing 27%

HY18 Results 18 July 2018 16
Selected project wins during HY18
 WAHANA COAL MINE SATUI COAL MINE SENAKIN COAL MINE CAVITE LAGUNA EXPRESSWAY CENTURY ZINC MINE & KARUMBA PORT
 $280m, Thiess (March) $240m, Thiess (March) $150m, Thiess (March) $182m, Leighton Asia (March) $150m, Sedgman (May)
 Contract extension to provide mining services Contract extension to provide mining services Contract extension to provide mining services Construction of a 28km, four‐lane expressway Refurbishing and commissioning of a process
 until 2021 until 2021 until 2020 and supporting infrastructure plant, and operation and maintenance of the
 plant, pipeline and port facility

 NORTH‐SOUTH TRANSPORTATION CORRIDOR
 $540m, Leighton Asia (May)
 ($380m Leighton Asia share)
 Contract to design and construct road
 transport infrastructure including tunnels NUMEROUS RESOURCES PROJECTS
 $139m, UGL (May)
 Maintenance, project and shutdown services
 contracts (Queensland and across Australia)

 ATOM SERVICES QCOAL NORTHERN HUB
 $150m, UGL (March) $480m, Thiess (June)
 Contract extension to continue to provide Contract extension to provide mining services
 asset management and project‐related until 2022
 services at BP fuel terminals (across Australia)

 CURRAGH COAL MINE
 $160m, Thiess (June)
 Contract extension to provide mining services
 until 2019

 SOUTH FLANK PROJECT DAWSON SOUTH COAL MINE
 $260m, CPB Contractors (June) $190m, Thiess (March)
 Construct mining infrastructure, including bulk Contract extension to provide mining services
 earthworks, concrete and underground until 2021
 services

 ROCKY’S REWARD MOUNT ARTHUR COAL MINE
 $225m, Thiess (June) $185m, Thiess (March)
 Contract extension to provide mining services Contract to provide additional mining services
 until 2019

 TAILEM BEND SOLAR FARM GUNYAMA PARK AQUATIC AND RECREATION WAIKERIA CORRECTION AND TREATMENT MT OWEN COAL MINE
 $170m, UGL (February) CENTRE FACILITY PPP $140, Thiess (March)
 Engineer, procure and construct, as well as a $84m, CPB Contractors (January) CPB Contractors and Pacific Partnerships Variation to existing contract to provide
 five‐year operation and maintenance contract Design and construct an outdoor pool and (June) confirmed as preferred partners mining services until 2021
 recreation facility Design and construct the new facility

HY18 Results 18 July 2018 17
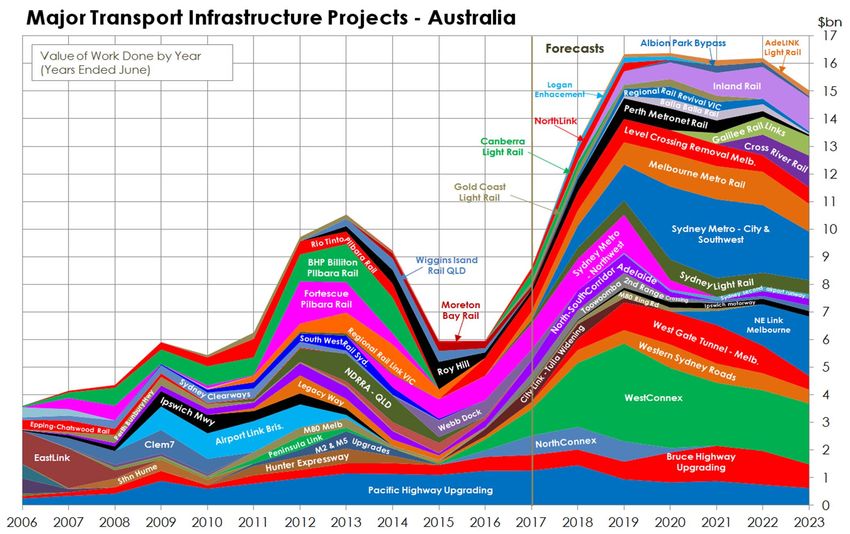
Australian transport infrastructure projects – market opportunities

Source: Macromonitor – Australian Construction Outlook Overview, June 2018
HY18 Results 18 July 2018 18
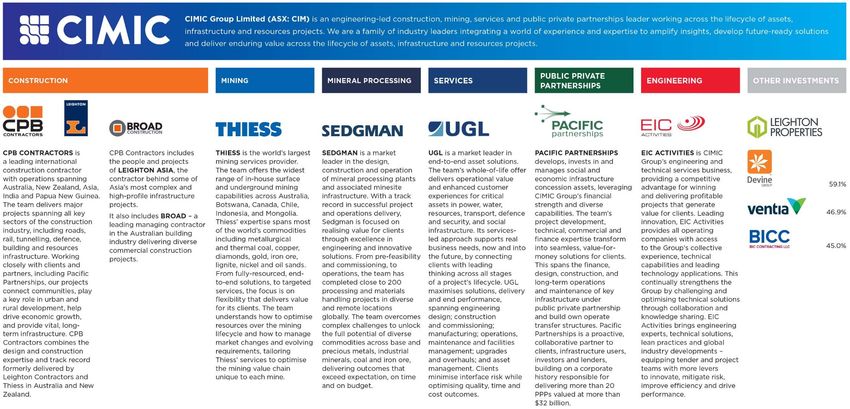
CIMIC Group

HY18 Results 18 July 2018 19
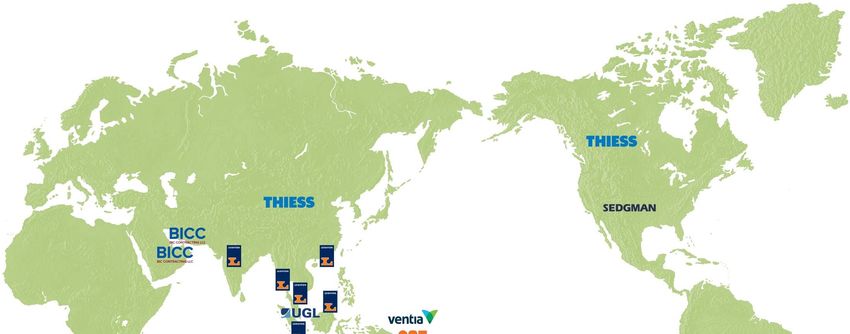
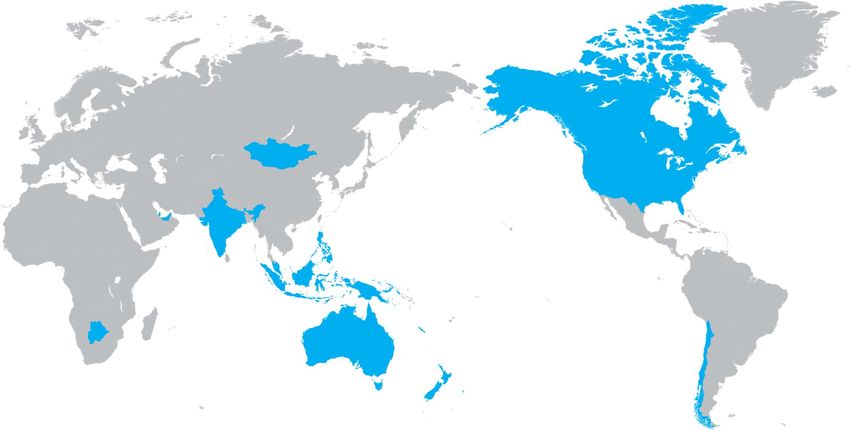
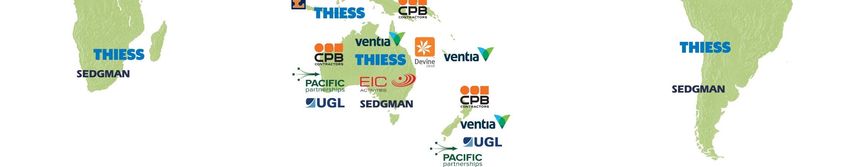
Group market position

HY18 Results 18 July 2018 20
F/X rates
 Jun Jun Dec
 Chg. $ Chg. %
End of the period 2017 2018 2017

 AUD/USD 0.76 0.75 (0.01) (1.3)% 0.78

 AUD/EUR 0.68 0.64 (0.04) (5.9)% 0.65

 HY17 HY18 Chg. $ Chg. % FY17
Period average

 AUD/USD 0.76 0.75 (0.01) (1.3)% 0.76

 AUD/EUR 0.71 0.64 (0.07) (9.9)% 0.68

HY18 Results 18 July 2018 21
1Revenue excludes revenue from joint ventures and associates of $1,407.9m (HY17: $1,381.8m) 2Margins are calculated on revenue which excludes revenue from joint ventures and associates 3Cash flows from operating activities before interest, finance costs, taxes and dividends received 4Free operating cash flow is defined as net cash from operating activities less net capital expenditure for property, plant and equipment 5WIH includes CIMIC’s share of work in hand from joint ventures and associates 6New work includes new contracts and contract extensions and variations including the impact of foreign exchange rate movements 7In the current period, HLG Contracting LLC changed its name to BIC Contracting LLC “BIC” 8Gross capital expenditure is payments for property, plant and equipment 9Gross capital proceeds are proceeds received from the sale of property, plant and equipment 10The Group has applied AASB 15 with the cumulative effect of initially applying the standard as an adjustment to the opening balance of net contract debtors. Refer to the Interim Financial Report, ‘Note 1(a): Basis of preparation – Change in accounting standards’. March 18 comparative figures remain as reported to the market based on estimates, the June 2018 numbers reflect the final adjustments 11Relates to the $2.9bn of working capital facilities of which $2.5bn is undrawn at 30 June 2018 and bank bonding commitment fees 12Net finance costs include interest income and finance costs 13Total interest bearing liabilities 14Corporate work in hand includes work in hand mainly from BIC, Commercial and residential and CIMIC’s share on investments such as Ventia 15Relates to Macmahon divestment work in hand at divestment date, 6 July 2017 Definitions 1Q18, 2Q18, 3Q18 & 4Q18 – Three months to March 2018, June 2018, September 2018 and December 2018 respectively LTM – Last 12 months bn – Billion m – Million bp – Basis points NPAT – Net profit after tax cps – cents per share PBT – Profit before tax D&A – Depreciation and amortisation PPP – Public Private Partnership DPS – Dividend per share QOQ – Quarter on Quarter EBIT – Earnings before net finance costs and tax WIH – Work in hand EBITDA – Earnings before net finance costs, tax, depreciation and amortisation YOY – Year on year EPS – Earnings per share (basic) FY – Full year from January to December HY – Half year from January to June HY18 Results 18 July 2018 22
Disclaimer This presentation, and any oral presentation accompanying it: is not an offer, invitation, inducement or recommendation to purchase or subscribe for any securities in CIMIC Group Limited (“CIMIC”) or to retain any securities currently held; is for information purposes only, is in summary form and does not purport to be complete. The Management Commentary and Appendix 4D within the Consolidated Interim Financial Report lodged provides statutory disclosures and details of the CIMIC financial position; is not intended to be relied upon as advice to investors or potential investors and does not take into account the investment objectives, financial situation or needs of any particular investor, potential investor or any other person. Such persons should consider seeking independent financial advice depending on their specific investment objectives, financial situation or needs when deciding if an investment is appropriate or varying any investment; and contains forward looking statements. These statements reflect the current views, expectations and assumptions of the board of directors of CIMIC (“Board”) and are based on information currently available to the Board, involve risks and uncertainties and do not guarantee future results, performance or events. Any forward looking statements have been prepared on the basis of a number of assumptions which may prove to be incorrect or involve known and unknown risks, uncertainties and other factors, many of which are beyond the control of CIMIC, which may cause actual results, performance or achievements to differ materially from those expressed or implied in the statements. There can be no assurance that actual outcomes will not differ materially from these statements. Any forward looking statement reflects views held only as at the date of this presentation. Subject to any continuing obligations under applicable law or any relevant stock exchange listing rules, CIMIC does not undertake to nor is it under any obligation to, publicly update or revise any of the forward looking statements or change in events, conditions or circumstances on which any such statement is based. No representation or warranty, express or implied, is made as to the fairness, accuracy, completeness or correctness of the information, opinions and conclusions contained in this presentation and any oral presentation accompanying it. To the maximum extent permitted by law, CIMIC and its related bodies corporate, and their respective directors, officers, employees, agents and advisers, will not be liable (including, without limitation, any liability arising from fault or negligence) for any loss, damage, claim, demand, cost and expense of whatever nature arising in any way out of or in connection with this presentation and any oral presentation accompanying it, including any error or omission therefrom, or otherwise arising in connection with any reliance by any person on any part of this presentation and any oral presentation accompanying it. HY18 Results 18 July 2018 23
You can also read