Investor presentation - Results for the year ended 31 December 2020 - Hardman & Co
←
→
Page content transcription
If your browser does not render page correctly, please read the page content below
Investor presentation
Results for the year ended 31 December 2020
                                              1
Disclaimer & Important Notice

This presentation (hereinafter "this document")has been preparedby Yew Grove REIT plc(the "Company“or “Group”)for information purposes only.
This document has been prepared in good faith but the information contained in it has not been independently verified and does not purport to be comprehensive. This document
is neither a prospectus nor an offer nor an invitation to applyfor securities.

Nothing contained in this document shall form the basis of any contract or commitment whatsoever. No representation or warranty, express or implied, is given by or on behalf of
the Company, its group companies, or any of their respective shareholders, directors, officers, employees, advisers, agents or any other persons as to the accuracy, completeness,
fairness or sufficiency of the information, projections, forecasts or opinions contained in this document. In particular, the market data in this document has been sourced from third
parties. Save in the case of fraud, no liability is accepted for any errors, omissions or inaccuracies in any of the information or opinions in this document and neither the Company
and its group companies nor any of their respective employees, officers, directors, advisers, representatives, agents or affiliates, shall have any liability whatsoever (in negligence or
otherwise, whether direct or indirect, in contract, tort or otherwise) for any loss howsoever arising from any use of this document or its contents or otherwise arising in connection
with this document. Certain information contained in this document has been obtained from published and non- published sources prepared by other parties, which in certain cases
have not been updated to the date hereof. While such information is believed to be reliable for the purpose used in this document, the Company does not assume any
responsibility for the accuracy or completeness of such information and which has not been independently verified by the Company. Except where otherwise indicated herein, the
information provided in this document is based on matters as they exist as of the date of preparation and not as of any future date, and will not be updated or otherwise revised
to reflect information that subsequently becomes available, or circumstances existing or changes occurring after the datehereof.

Forward-lookingstatements

This document contains forward-looking statements, which are subject to risks and uncertainties because they relate to expectations, beliefs, projections, future plans and
strategies, anticipated events or trends, and similar expressions concerning matters that are not historical facts. Such forward-looking statements involve known and unknown risks,
uncertainties and other factors, which may cause the actual results, performance or achievements of the Group or the industry in which it operates, to be materially different from
any future results, performance or achievements expressed or implied by such forward-looking statements. The forward-looking statements speak only as at the date of this
document. The Group will not undertake any obligation to release publicly any revision or updates to these forward-looking statements to reflect future events, circumstances,
unanticipatedevents,newinformationor otherwiseexcept as requiredby law or by any appropriateregulatory authority.

THIS DOCUMENT DOES NOT CONSTITUTE OR FORM PART OF ANY OFFER FOR SALE OR SUBSCRIPTION OR SOLICITATION OF ANY OFFER TO PURCHASE OR SUBSCRIBE FOR ANY
SECURITIES NOR SHALL IT OR ANY PART OF IT FORM THE BASIS OF OR BE RELIED ON IN CONNECTION WITH ANY CONTRACT OR COMMITMENT TO PURCHASE OR SUBSCRIBE
FOR ANY SECURITIES

                                                                                                                                                                                      2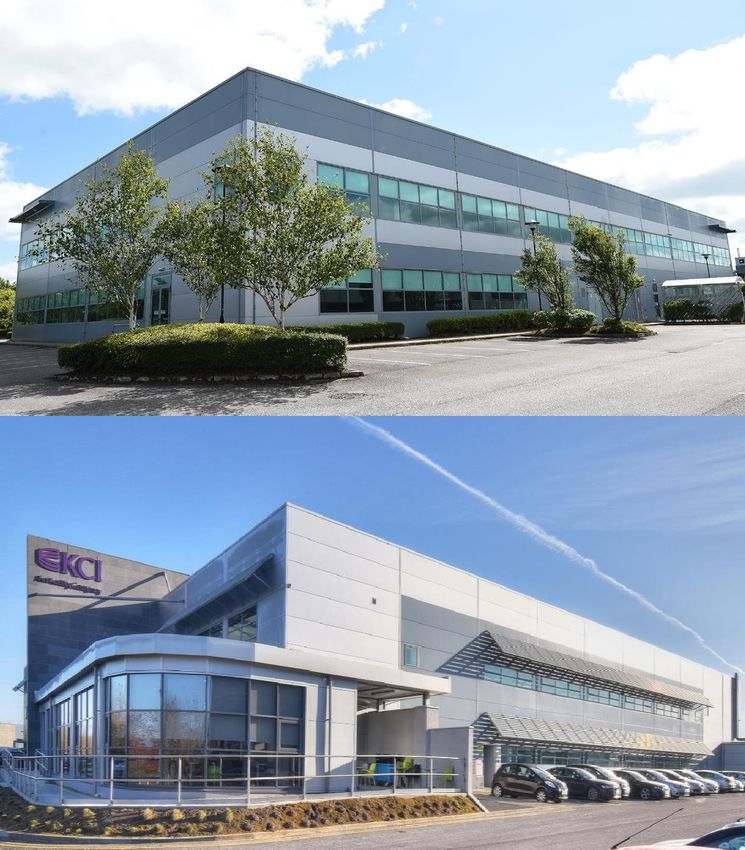
SECTION 1

Introduction

               43
Who are we and what do we do
    An Irish REIT investing in multinational businesses

      Yew Grove Strategy                                              Market dynamics
•     Yew Grove buys and manages properties outside of the        •   The non-CBD market for institutional buildings is
      Dublin central business district that are attractive to         approximately the same size as the Dublin
      large multinationals and/or Government entities.                institutional office market c €14b.
•     We invest in offices on the fringes of the Dublin city      •   Despite this institutional investment is skewed
      centre, in its suburbs and in the larger towns and cities       80/20 to the Dublin CBD market.
      where there are numerous multinational businesses.          •   That regional under investment is partly a result of
•     We invest in industrial buildings, particularly those              • its history as a closely held market until the
      used in research and development in the life sciences                  global financial crisis
      sector.                                                            • the natural disparity between lot sizes in the
•     We are the only publicly listed vehicle with this                      CBD vs elsewhere
      strategy.                                                   •   Despite growing competition available yields on
•     The management team have been pursuing the                      regional institutional offices property are almost
      strategy for over 7 years, the last 3 as a public               twice as high as in central Dublin.
      company.                                                    •   The industrial market has strengthened
                                                                      dramatically but despite increased competition the
                                                                      yields on the specialized buildings in which Yew
                                                                      Grove invests are still attractive.

                                                                                                                             4
Macro economic backdrop
The strength of the Irish economy underpins our strategy
    Economic performance in 20201                                                                               FDI importance in Ireland2

    ▪     Ireland’s GDP grew by 3.4% in 2020                                                                     ▪     112k jobs created between 2015 to 2019
    ▪     Fastest growing in the developed world                                                                 ▪     Regional FDI investments increased by over 50% in this period
    ▪     Gross Value Added (GVA) in the multinational sector increased                                          ▪     FDI direct investment increased by EUR72bn in 2019
          by 18.2%, even while the domestic economy declined by 5.4%                                             ▪     In 2020 there was a net gain of 9000 jobs:
    ▪     Ireland’s FDI economy is over 50% of total 2020 GVA, up from                                                    ▪ 52% of investments went outside Dublin
          25% in 2014                                                                                                     ▪ IDA client companies and their suppliers employ
    ▪     The largest contributions to GDP growth were from the                                                                12.4% of the total workforce
          pharmaceuticals and ICT sectors.                                                                                ▪ 257k are directly employed in the multinational sector in
                                                                                                                               Ireland and another 206k indirectly.

 Access to FDI tenants                                                                                       Current rent roll by FDI sector3

▪       FDIs invest across Ireland (more than 50% outsideDublin).                                           ▪        Life Sciences                            35%
▪       Multinational businesses tend to cluster by industry around local                                   ▪        Finance & Business Services              19%
        supply chains, research and educational establishments.                                             ▪        Grocery                                  7%
▪       This has led to concentrations of large employers in otherwise                                      ▪        Tech                                     7%
        small towns (e.g. med tech and pharma in the midlands from
                                                                                                            ▪        Packaging                                4%
        Athlone to Sligo and Galway, ICT down the west coast from Galway to
                                                                                                            ▪        Other                                    3%
        Cork.)
▪       The shortage of suitable properties (driven by lack of development in
        the past 12 year) and the demand for modern buildings has been                                               Government and government bodies 25%
        driving rents upwards from their GFC lows.

1 . Central statistics Office: https://www.cso.ie/en/releasesandpublications/ep/p-na/quarterlynationalaccountsquarter42020/headlineeconomicresults/
2.-IDA Ireland: https://www.idaireland.com/newsroom/regional-investment-grew-as-foreign-direct-investm
                                                                                                                                                                                        5
23– As at 01/01/2021
Overview of current portfolio

      Portfoliovalue
        €141.9m

     Lettable Space
                                                                                                                      Letterkenny (3)                                             Dublin
     824,940 sq. ft

   Number of properties
             25

       Vacancy rate                                                                                                                                                                            Airways
           4.1%1                                                                                                                                                                               7+8
                                                                                                                      Athlone            (4)
   Value ofinvestment                                                                                                 Dublin (12)2                             Ashtown
   properties inDublin
                                                                                                                                                                 B,C
         €78.6m2
                                                                                                                      Tullamore          (1)                                                 Gateway
   Government &FDI                                                                                                                                                                             1,3
       tenants
          92.4%                                                                                                       Portlaoise         (1)

   Acquisitions in2020                                                                                                Listowel           (1)
      (6 buildings)                                                                                                                               Naas
                                                                                                                      Waterford          (1)
         €25.3m

  WAULT Expiry/Break                                                                                                  Cork               (2)
         7.5/4.2

         Rent Roll3
        €11.3m

1 - Vacancy by area 3.9%
2. For these purposes the properties at Millennium Park in Naas, which is within the Dublin commuter belt have been treated as Dublin properties. Without them Dublin would account for €49.5 million .   6
Figures as at 01/01/2021
3. As at 1/1/2021 after the Alter Domus lease in Cork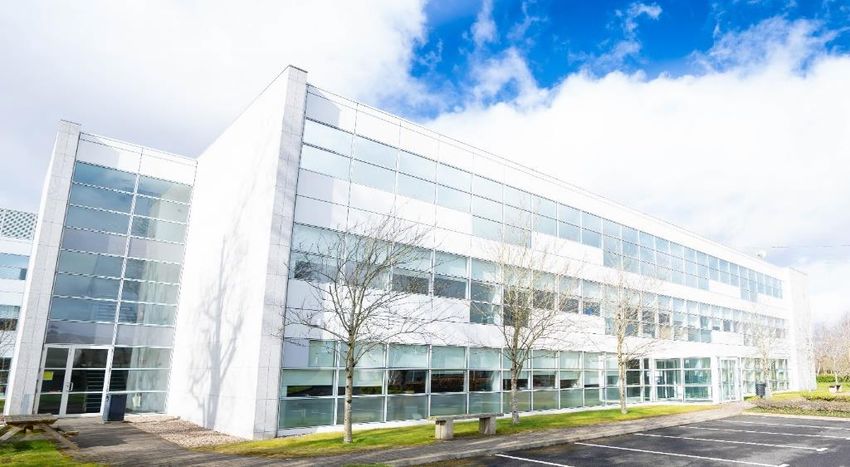
High quality rent roll from excellent tenants

          Overview of current portfolio                                                                            Key tenant overview

      •       Number of tenants: 42                                                                                                  % of annualrent
                                                                                                                        Company                        Home Country
      •       53% of rent roll is in the Dublin catchment area                                                                             roll
      •       53% of rent roll is rated A3 or above
      •       Public companies make up 76% of non-Government rent roll                                                                    12.7%            USA
      •       Yield to company: 7.9%
      •       Reversionary yield: 8.7%                                                                                                    12.2%
                                                                                                                                                          Ireland
                                                                                                                                                       (Government)

                                                                                                                                          9.9%             USA

                                                                                                                                          8.4%             USA

                                                                                                                                                          Ireland
                                                                                                                                          6.9%
                                                                                                                                                       (Government)
                              SME                                           Packaging,
                              3.7%                                            4.3%            Other,
                                                                   Tech,
Government                                                         6.6%
                                                                                              2.8%                                        6.2%           Germany
  24.9%                                                                                                   Life
                                                                                                       Sciences,
                                                              Grocery,                                  35.0%                             5.2%             USA
                                                               7.3%

                                                               Finance &                                                                  3.4%             USA
                                                                Business
                                                                Services,
                                                                19.1%                                                                     3.1%          Luxembourg
                                                 FDI/Large
                                                 enterprise
                                                                                         Government,
                                                   71.4%                                                                                  2.9%           Germany
                                                                                            24.9%

          2 - As a percentage of Revenue as at 01/01/2021                                                                                                             7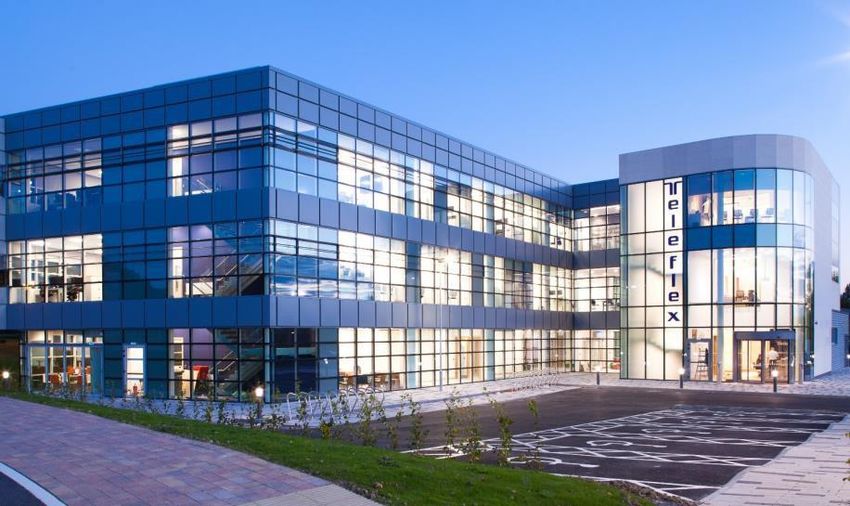
9

           SECTION 2

    Financial Highlights

                           8
2020 highlights
Validation of the investment strategy and focus on credit quality

             Collections                       Sector leading rent collection in the pandemic continues to support the dividend: 97%
                                               collected in Q2, 98% inQ3, and 100% in the following two quarters.

              Revenue                          Contracted rent roll grew from €8.9m to €10.9m.

            Distributions                      Dividends per share of 5.15c declared for 2020. 2019 was 6.75c, representing ordinary
                                               dividends of 4.88c and a special dividend of 1.87c.

                 NAV                           Robust valuation with NAV per share of 100.03c at Dec 2020, up 1.51c from 98.52c at
                                               Dec 2 0 19. This is despite costs for the €25.3m Millennium Park purchase of 1.8c per
                                               share.

          NAV total return                     NAV total return1 for the period of 6.30c per share vs 5.01c per share for 2019, despite the
                                               impact of the pandemic on economic activity.

               Pipeline                        Strong acquisition pipeline, with early indications suggesting improved pricing offering
                                               enhanced returns.

 1. NAV total return measures the return according to IFRS NAV and dividends paid. It is similar to total shareholder return, except for its use of IFRS NAV in place of
share price.
                                                                                                                                                                           9
Portfolio and income growth
Operational leverage continues to drive earnings growth
                                                                            Property value and rent roll €m

 ▪   Property portfolio grew by €26.1m (+23%) over the year (from                           12                                                                     160
     €115.8m to €141.9m).                                                                                                                                          140
                                                                                            10
 ▪   Contracted rent roll grew by €2.0m (+22%) over the period (from                                                                                               120
     €8.9m to €10.9m).                                                                       8
                                                                                                                                                                   100
 ▪   Since IPO the Company has maintained current and reversionary                           6                                                                     80
     yields despite growing by 5.5x.                                                                                                                               60
                                                                                             4
 ▪   Portfolio is still under rented with potential of additional rent of                                                                                          40
     €0.6m from rent reviews and €0.5 million from letting current                           2
                                                                                                                                                                   20
     vacancy.                                                                                0                                                                     0
 ▪   The Company has regularly outperformed the valuers’                                           IPO      Jun-18 Dec-18 Jun-19 Dec-19 Jun-20 Dec-20
                                                                                 Rent roll (LHS)   2.6        4.6     6.3      7.5      8.9       10.4      10.9
     expectations of ERV on new lettings.
                                                                                 Portfolio (RHS)   25.9      56.9     77.9     90.5    115.8     141.07 141.925

                                                                             Annualised administrative costs / portfolio

▪    Yew Grove continues to demonstrate operational leverage,
     which feeds through todividends.                                                    4.1%

▪    As reversion is captured, the revenue/cost ratio will improve.
                                                                                                                       2.6%
▪    As the Company increases its capital base, revenue growth                                                                                       2.2%
     should continue to outpace costs and we expect
     continued improvement.
                                                                                        DEC-18                        DEC-19                        DEC-20

                                                                                                         Annualised Admin cost/portfolio value

                                                                                                                                                                   10
Dividends and capital strength
Quarterly distributions from secure income
2
▪ Dividends for 2020 equate to 96% of EPRA EPS and reflect the net
income after accounting for irrecoverable capital expenditure on 1.5
the portfolio.
1
▪ Dividends declared for 2020 were 1.2c, 1.25c, 1.3c and 1.4c per
share respectively.
0.5
▪ The Company expects to distribute its EPRA earnings quarterly 0
after accounting for expected irrecoverable capital expenditure Q4 2018 Q1 2019 Q2 2019 Q3 2019 Q4 2019 Q1 2020 Q2 2020 Q3 2019
Ordinary Special
▪ The Company actively manages its properties to enhance
income and value. Like for like portfolio annual value change
2019 2020
▪ Property purchase costs are c. 8.5% (7.5% stamp tax, legal,
survey etc). The Company aims to recover these through value Portfolio 5.44% 2.55%
growth within three years
Office 3.39% 1.90%
▪ Despite the effect of the pandemic on valuations in 2020 the
Industrial 15.76% 5.50%
like for like growth since December 2018 has been 7.99%
11SECTION 3
Asset Management
12
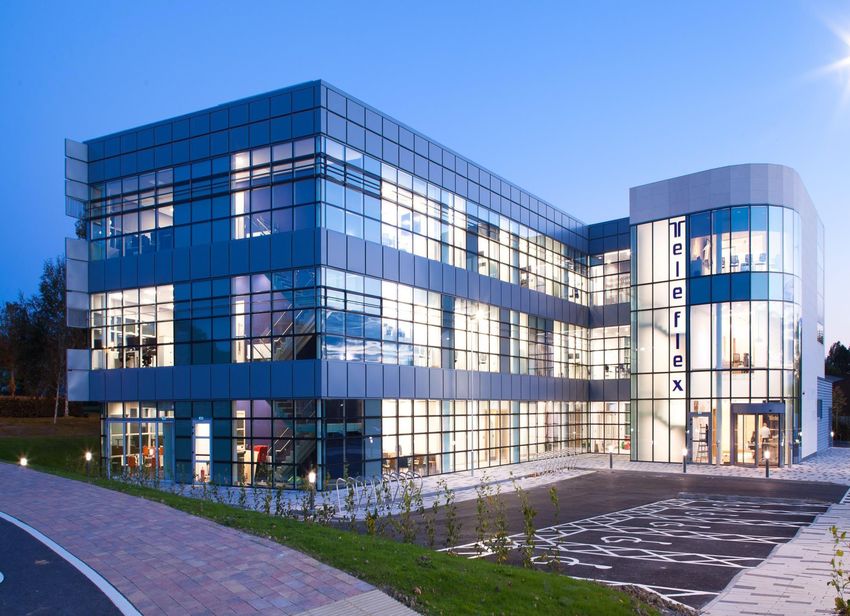
15Yew Grove is committed to tenants that are expanding their operations
IDA Business & Technology Park, Athlone
• Many FDI tenants, especially in Life Sciences,
are expanding operations, despite the
pandemic. .G
• The level of investment in existing properties, the D E
B C F
lack of vacancy in suitable alternatives, plus the
importance of existing supply chains, work force
and local 3rd level education make staying in situ
the preferred solution. Key:
• A - Teleflex
A • B - PPD
ProjectA • C – KCI Carpark
• D – KCI Building 1
• Temporary office/canteen development • E – KCI Building 2
• F - Signature
• Temporary car parkexpansion • G - M6 Motorway interchange
• 37k sq ft office extension
• New 175 space car park.
ProjectB Acquisition Yield at
• Expanded an existing car park Price: fair value: Size:
• Helped with improvements to power and
€28.6m 8.4% 207,000 sq ft
water supply
• Facilitated expansion in neighbouring
building Present Tenants:
• Planning for a new warehouse and resiting a Occupancy: Teleflex,
car park. Value:
100% KCI, PPD
€30.0m
13Building embedded value in industrial properties
There is more yield compression to come and asset management will improve earnings
• The portfolio is predominantly exposed to tenants in
the life science sector and there is currently no
vacancy.
• Over the past 2 ½ years ERVs have risen with the
changes in contracted rent psf largely coming from
new acquisitions at a higher rent than the portfolio
average.
• The discount rates used by the valuers have
compressed, but at over 7%, are still significantly above
the levels seen in public transactions in 2020 and 2021.
• Because there has, as yet, been little asset
management we have seen neither the capture of ERV
(via rent reviews or new leases), nor an extension of
6 €100
WAULT. Both could potentially substantially increase €90
5
value in this part of the portfolio. €80
4 €70
€60
3 €50
€40
2 €30
1 €20
€10
0 €0
June 18 Dec 18 June 19 Dec 19 June 20 Dec 20
WAULT (yrs, LHS) Cap Value psf (RHS)
14Focus on asset management in our office portfolio
Millennium Park, Naas
• We had tracked this portfolio since 2018, and agreed heads
of terms in the midst of our Q4 equity raise in 2019,
exchanging within 2 weeks of drawdown.
• The portfolio consisted of 6 buildings, 141,000 sq. ft, 5 fully let Naas
and one, Birch House, an HQ style 40,000 sq ft building, vacant.
• We completed the purchase in February, 2020 paying
€25.3 million plus costs.
M7/N7 interchange
• A new motorway directly connecting the park to Dublin (40
minutes) and the airport (40 minutes) had just been
completed, making it much more attractive as a suburban
location for FDI businesses. Millennium Park
• Before completion we identified potential lessees for Birch
House and despite delays caused by the Covid-19 lockdown, Acquisition Yield at
signed a 15 year lease with Aldi in early July. Price: Size:
fair value: 141,000 sq ft
• The December valuation saw an increase of almost €25.3m 8.7%
€1.3 million from June.
• Our active asset management continues to capture the Present
reversionary potential of the park. Occupancy: Multi-
Value tenanted
98%
€26.7m
15Has driven value growth in regional offices
To date the growth in value has not been driven by yield compression
▪ The regional office portfolio, like the overall portfolio, is under
rented.
▪ Since IPO the contracted rents per sq. ft and the ERVs have
risen and we expect that to continue.
▪ Asset management consistently drives WAULTs faster than
lease rolldown and benchmarks rental increases which
informs the valuer’s view of local ERVs.
▪ Since 2019 we have completed asset management (new or
regeared leases, rent reviews and lease breaks) in most of our
regional office locations.
▪ Our Dublin (city fringe and suburban offices) also demonstrate
significant under rental, and embedded value.
16SECTION 4
Pipeline & Outlook
17
Classified asConfidentialIncome accretive Pipeline
The non-CBD investment market is growing in liquidity and size
13.8 13.7
• The Company’s target market is large and under invested 5.2 Irish
industrial
Value€bn
• The immediate pipeline of 11 properties (€153 million of cost) is market
analysed below
Non-Dublin
• A further €150 million of regional properties in the medium term. 8.5 CBD office
market
• Number of asset management opportunities across the pipeline
to drive capital and income value. Dublin CBDoffice Yew Grove target
market market
Total Costs NIY RY WAULT break
Office €120.9m 8.06% 9.23% 2.8
Industrial €32.6m 7.15% 8.15% 6.4
Overall €153.5m 7.86% 9.00% 3.5
TenantType Location ofAsset Type of Asset
Large SME
Regional
Enterprise 3% Industrial
21%
13% 21%
Government
32%
Dublin
Suburban Core +
Dublin 71%
8%
FDI Office
52% 79%
18Summary & Outlook
• The Company’s focus on credit quality and institutional buildings in carefully selected locations
has been reflected in a robust rent collection and valuation in 2020 against the backdrop of the
Covid-19 pandemic….
• …and underpinned progressive quarterly dividends supported by stable and growing capital
values
• Our immediate outlook involves a move to the main board of the Irish Stock Exchange, and the
pipeline of potential acquisitions
▪ Irish FDI tenants, particularly in sectors targeted by the Company, have expanded their operations
through the pandemic, supporting the Company’s current investments and future opportunities
▪ There is, currently, limited competition for the pipeline, which can be both reversionary and bought
below re-build cost
▪ Our ability to execute the pipeline requires further capital
▪ Additional capital should enable the Company to benefit from operating leverage, improve shareholder
liquidity and returns
19SECTION 4
Appendices
20
Classified asConfidentialSustainability
Building a socially and environmentally responsible business
Environment
▪ Strategic drive to reducing the environmental impact of our property portfolio
▪ Our Sustainability Report details our activity in the 2020 annual report
▪ First energy and waste measurements of our multi-tenanted buildings published in
our 2020 annual report despite the challenges caused by Covid-19. Tenancy
questionnaire completed by majority of occupants.
▪ 100% renewable energy sources for multi-tenanted buildings
▪ During 2021, the collection of energy, water and waste measurements will expand
to include single tenanted properties
▪ New building management system (Riptide) to be installed in larger multi-tenanted
buildings which should enable further improvements in portfolio energy efficiency
and provide more accurate real time measurement of energy consumption as well
as improving M&E reliability and extending its useful life
▪ Increasing interaction with tenants and suppliers on sustainability matters. Community
▪ Interaction with 8 universities and Institutes of Technology (IoT) that took part in
the CFA Society of Ireland’s annual CFA Research Challenge .
▪ In 2021 re-engage with selected IoT’s post lockdown to see how we can better
improve the local environments in which we operate.
▪ Charitable donations for two charities focused on homelessness and hardship at
corporate and employee level.
Diversity
▪ Improving diversity throughout the Company is vital, however whilst governance
policies and practices are at the level expected of a public company, our small
workforce and short corporate history means we have not yet reached our
targeted levels.
21NAV per share progression 2020
Performance reflects underlying portfolio quality
▪ As an income REIT, the vast majority of EPRA earnings are distributed in quarterly dividends
▪ Income is not the only driver, valuation gains outweighed period acquisition costs
22Summary balance sheet
Stable asset values, strong liquidity
Group Balance sheet(€’m) At 31 Dec 2019 At 31 Dec 2020 Change Comment
€25.3m purchases, €2.7mm sales, valuation
Investment properties 115.8 141.9 23% gains of €3.5mm
Cash and cashequivalents 14.6 10.7 (27)%
Borrowings (20.4) (38.3) 88% Financing of Millennium Park purchase
Reflects quarterly rent collections paid in
Other Asset/(Liabilities) (0.1) (2.7) advance
Total equity 109.9 111.6 1.5%
IFRS NAVPS (cents) 98.52 100.03 1.5%
Diluted EPRA NAVPS (cents) 98.41 99.77 1.4%
▪ NAV grew by €1.6m, after the impact of Millennium Park acquisition costs of €2.1m
▪ The Company’s revolving debt facility increased to €53.6m, of which €15.0m was undrawn at period end
▪ Net debt at period end was €27.5m
▪ The Company remained comfortably within financing covenants throughout the period
23Summary income statement
Solid collections and contained costs
Group Income Statement (€’m) 2019 2020 % change
Rental Income 7.95 11.21 43% Portfolio +23%
Lease surrender income 2.00 0.15
Property Expenses -0.53 -0.71
Net Rental Income 9.42 10.65 13%
Gains on investment properties -0.65 1.3 Realised €0.1m, unrealized €1.2m
Total income 8.77 11.95 36%
Administration and AIFM -3.04 -3.14 3% Portfolio +23%
Finance costs -0.67 -1.81 Includes rearrangement costs
Total Expenditure -3.71 -4.95 33%
Profit for the period 5.06 7.01 39%
Total comprehensive income 5.06 7.01
Basic EPS (cents) 6.24 6.28 1%
Diluted EPRA EPS (cents) 7.02 5.5 -22%
Dividends declared for period (cents) 6.75 5.15 -24%
Dividends declared for period (cents, excl special) 4.89 5.15 5%
24You can also read


