Emkay Investment Managers Ltd
←
→
Page content transcription
If your browser does not render page correctly, please read the page content below
Emkay Investment Managers Ltd
Emkay’s 12 An equal weighted twelve stock large cap oriented PMS strategy   as on 31st May 2021
Mitigating "Selection bias" and "Allocation bias"

● Mitigating Selection Bias :
    » Sticking to the portfolio universe assiduously
    » Focusing on compounding themes rather than flavour of the season
    » Very high quality standards for companies to be eligible

● Mitigating Allocation bias :
    » Concentrated portfolio of a fixed number of high – conviction stocks
    » Back the high-quality portfolio with an Equi-Weighted construction
    » Re-balancing once a year to avoid concentration risk
    » Monitor regularly, prune when required

● Unique framework which seeks to maximize the potential out of a
     concentrated portfolio while managing risk
2
Presenting Emkay’s 12 - pioneering the concept of “Smart Alpha”

Where every performing stock gets equal attention

  3
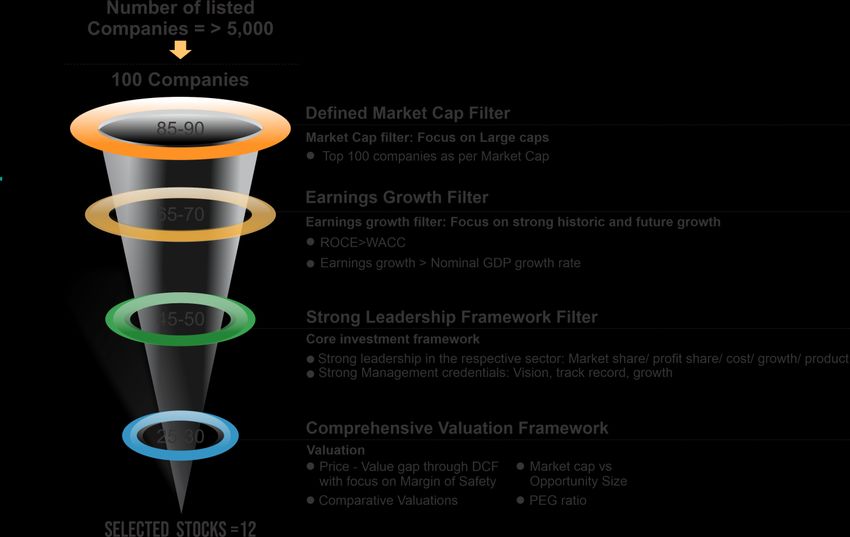
Mitigating “Selection bias” through a rigorous framework

 4

Emkay’s 12 – Key Investment Themes

                    Value Migration

                  IT, Chemicals, Unorganised to Organised, Voice to Data etc.

                      Domestic
                     Consumption

                  Auto, Building Materials, FMCG, Consumer Durables, etc.

                      Domestic
                        Infra

                  Cement, Capital Goods, etc.
 5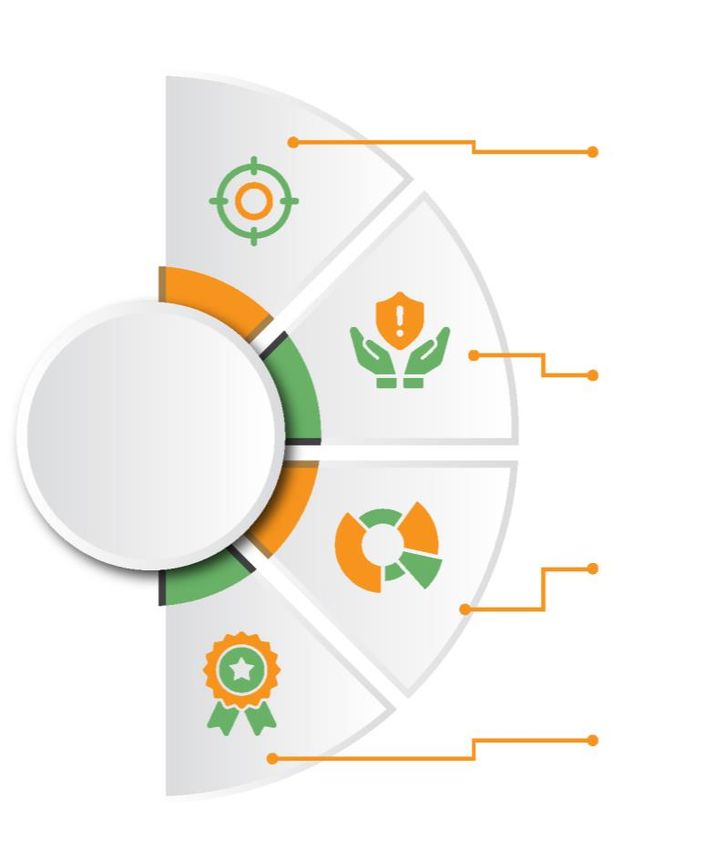
Key Investment Themes : Value Migration
The portfolio seeks to achieve long term capital appreciation by investing in these themes

 Beneficiaries
 ● Value Migration is “the flow of economic and
     shareholder value away from obsolete business                                Low cost
     models to new, more effective designs that are                               producers
     better able to satisfy customers’ most important
     priorities”
 ● The framework tries to identify industries where                        Technology
     Value Migration is underway and helps pick                              leaders
     potential winners early in the cycle.
 ● Few examples: Onshore to Offshore IT services,                                   Efficient
     Private banks vs PSU banks, Chemicals, Voice                                  products/
                                                                                    delivery
     to Data, Organised vs Unorganised Retail,                                      models
     Unorganised lending to Organised lending etc.

 6
Value Migration : Reliance Industries

                             Reliance Industries   Nifty 50
                                                              Reliance Industries - FY 2020
 600
                                                                 Financial Performance
 500                                                          Financial
                                                                                   FY 2020
                                                              Performance
 400
                                                              Revenue (Rs Cr)      5,96,743
 300
                                                              PAT (Rs Cr)           42,851
 200
                                                              ROC                    10%

 100                                                          ROE                     9%

      0                                                       Market Cap * (Rs Cr) 13,69,605
          Jun-15

          Jun-16

          Jun-17

          Jun-18

          Jun-19

          Jun-20
          Mar-15

          Mar-16

          Mar-17

          Mar-18

          Mar-19

          Mar-20

          Mar-21
          Dec-14

          Sep-15
          Dec-15

          Sep-16
          Dec-16

          Sep-17
          Dec-17

          Sep-18
          Dec-18

          Sep-19
          Dec-19

          Sep-20
          Dec-20
                                                              Price * (Rs)           2,161

  7

      *As on 31st May 2021
Reliance Industries

● RIL’s strength lies in its ability to build businesses of global scale and execute complex,
  time critical, and capital-intensive projects which will prove advantageous as it embarks
  on large investments in all core segments.

● Reliance has changed the dynamics of telecom industries by moving the value of revenues from voice
  to data through the launch of Reliance Jio.Jio Platforms has expanded its portfolio of services to
  become a multiplay service provider, equipment supplier, content producer and developer in new
  technologies (eg. Jio Glass).

● This has forced incumbents to aggressively roll out data networks and re-align their business
  design/networks from being traditionally tailored for voice to increasingly cater to explosive data
  demand as data climbs up the consumer priorities list for communication and as market value of
  telcos increasingly gets linked to data growth.

● Due to value migration, global investors such as Facebook, Google, Qualcomm and Intel have
  invested in Jio platform. It has raised approximately $20 billion from 13 global investors by selling
  32.9% stake.

● With the acquisition of Future Group, the deal adds to Reliance Retail’s offline presence and they get
  access to wide network, logistics and warehousing business. With control over the value chain,
  Reliance can beat down prices to earn higher margins.

  8

Key Investment Themes : Domestic Consumption
The portfolio seeks to achieve long term capital appreciation by investing in these themes

● India’s GDP is expected to grow from
      $2.7tn in FY19 to $5.0 tn by 2024.

● Domestic private consumption as a %
      of GDP in FY19E stands at 60% which
      is $ 1.6tn.

● The strategy aims to benefit from the
      growth in GDP and the attendant
      impact on domestic consumption
      driven sectors.

● Few examples: FMCG, Consumer
      Discretionary, Housing finance,
      Auto & Auto Ancillary
  9

      Source: Emkay Research
Domestic Consumption : Titan Company

                             Titan   Nifty 50     Titan Company - FY 2020
450                                                Financial Performance
400                                             Financial
                                                                     FY 2020
350                                             Performance
300                                             Revenue (Rs Cr)      21,051
250
                                                PAT (Rs Cr)           1,501
200

150                                             ROC                   24%
100
                                                ROE                   23%
 50

  0                                             Market Cap * (Rs Cr) 1,41,593

       Jun-20
       Jun-15

       Jun-16

       Jun-17

       Jun-18

       Jun-19
       Mar-15

       Mar-16

       Mar-17

       Mar-18

       Mar-19

       Mar-20

       Mar-21
       Dec-16
       Dec-14

       Dec-15

       Dec-17

       Dec-18

       Dec-19

       Dec-20
       Sep-15

       Sep-16

       Sep-17

       Sep-18

       Sep-19

       Sep-20
                                                Price * (Rs)          1,595

 10

      *As on 31st May 2021
Titan Company
● Eye on unorganised: Titan is a specialty retailer with strong presence in jewellery,
watches and eyewear, alongwith fashion accessories and fragrances among others.
Most of the segments are characterized by the presence of significant unorganized market
● Long run way for growth: Titan is a strong play on the consumption theme and rides on the
long term opportunity of rising per capita income, increased discretionary spending, gains from
penetration and premiumization trends. Given Titan has 10% market share in jewellery shows
that it has significant headroom for growth
● Strong Fundamentals: Titan has consistently delivered ROCE of 20%+ and has demonstrated
tremendous discipline in investing the incremental cash in the business that continues to deliver
top quartile ROCE.
11Key Investment Themes : Domestic Infra
The portfolio seeks to achieve long term capital appreciation by investing in these themes
● Infrastructure are the basic systems that
undergird the structure of the economy.
● These systems tend to be capital intensive and
high-cost investments, and they are vital to a
country's functioning, economic development,
and prosperity.
● The strategy aims to identify companies
that are poised to benefit from the rise
in demand for infrastructure in the country
– both retail and institutional spending.
● Few examples: Cement, Capital Goods, etc.
12
Source: Emkay ResearchDomestic Infra : Ultratech Cement
Ultratech Cement Nifty 50 Ultratech Cement FY 2020
300
Financial Performance
Financial
FY 2020
250 Performance
200 Revenue (Rs Cr) 42,125
150 PAT (Rs Cr) 5,747
100 ROC 12%
50 ROE 16%
0 Market Cap * (Rs Cr) 1,93,689
Jun-15
Jun-16
Jun-17
Jun-18
Jun-19
Jun-20
Mar-15
Mar-16
Mar-17
Mar-18
Mar-19
Mar-20
Mar-21
Dec-14
Sep-15
Dec-15
Sep-16
Dec-16
Sep-17
Dec-17
Sep-18
Dec-18
Sep-19
Dec-19
Sep-20
Dec-20
Price * (Rs) 6,710
13
*As on 31st May 2021Ultratech Cement
● Enough room for growth: Ultratech Cement has consolidated cement capacity
of 117mn tonne. With FY20 volumes of 82mn tonne or capacity utilisation of 70%,
Ultratech has enough room to grow volumes without adding new capacities.
● Working aggressively on cost cutting: Ultratech Cement is aggressively working on cutting
costs with recently commissioning 33MW WHRS plant and has already started working on
another 11MW WHRS and also 32MW solar power plant to cut power cost which is 23.6% of
total cost.
● One of the lowest cost manufacturer in India : Ultratech is one of the lowest cost producer
of cement in India. Low cost and premium pricing has helped Ultratech to consistently report
one of the highest EBIDTA/tonne of Rs1000+
● Strong Fundamentals: Ultratech’s RoCE is currently at 11%. However, as the capacity
utilisation rises, the RoCE is expected to improve to 16% by F23. RoIC will be better at 18%.
Despite high capex over last few years, net debt/equity is at just 0.2x and net debt/EBIDTA at
1x. The company is expected to be almost net debt free by FY23.
14Core Investment Framework
Leadership
● Market-share Leadership
● Profit-pool Leadership (Apple vs Rest of the manufacturers)
● Cost efficient Leadership (Export oriented sectors like IT, Textiles, Chemicals)
● Growth Leadership (Companies with best growth in the sector like Private banks vs PSU Banks)
● Product Leadership
● Moat / Niche in the Business
How different is the company?
» Edge, Entry-barrier, Competition, Pricing-power
» Bargaining power of the industry
Discipline
● Identifying Price-Value gap with focus on margin of safety
● Comparative valuations
● Market-cap vs Opportunity size
Excellence
Ambition
Strong Management Credentials
● Track record of past decisions Strong Earnings Visibility & Quality
● Management Comments v/s Delivery ● How big the sector can be (3x, 4x....)
● Futuristic vision ● Revenue/ PAT/ Cash-flow growth
● Avoid aggressive accounting policies ● RoE, RoCE analysis
● Management background ● High operating/ Free cash-flow generation
15Emkay’s 12 A Unique Strategy in the Indian Large cap investment space ! 16
Focus on large and mid cap companies
                                       ● >50% exposure in companies with Market capitalization >$ 3 bn
                                       ● Investment only in top 100 companies by market capitalization
                                       ● Companies with minimum turnover of INR 500 cr

                                       Risk Management
                                       ● Equi-weighted portfolio
                                       ● >15% price movement in a month triggers review of the stock
      Strong risk                      ● Focus on Liquidity risk
     management                        ● No use of leverage
     strategy with                     ● Monthly portfolio review
       focus on
        Capital
                                       Diversification across industries and companies
     Preservation
                                       ● < 30%* exposure in one sector
                                       ●  GDP growth

17

          *At the time of initiation
Typical issues faced by conventional large cap MF schemes
● Compressing alpha
» The average alpha generated by large cap schemes has been
3.1% over their respective benchmarks in the last 5 years.
» Large cap schemes have been waylaid by ETFs with shorter timeframes
● High expense ratio
» Regulator defined, rigid expense ratios
● Unwieldy “diversified” portfolio
» Average number of stocks in the top few schemes is 40-50
» Leads to “closet indexing” rather than alpha generation
● Rapid flows in and out of the scheme
» Fund managers have to manage sufficient liquidity most times
18Financial Snapshot – Emkay’s 12 v/s Nifty 50
FY22E
FY2020 Sales Growth (%) Ebitda Growth (%) PAT Growth (%) ROCE (%) ROE (%)
P/E* PEG*
Emkay’s 12 11.9 15.5 29.8 34.1 24.5 34.9 0.8
Nifty 50 0.0 5.7 2.5 10.9 11.4 19.9 0.7
450 Emkay’s 12 CAGR 12%
400
350
300
Nifty 50 CAGR 5%
250
200
150
100
50
0
Mar-10 Mar-11 Mar-12 Mar-13 Mar-14 Mar-15 Mar-16 Mar-17 Mar-18 Mar-19 Mar-20
Emkay 12 Nifty 50
19
Note: Emkay’s 12 portfolio went live on 1st August’19. The back tested performance data is for
illustration purpose only. All fund data have been rebased to 100 from FY-2010.Emkay’s 12 vis-à-vis leading Large Cap MF schemes
1 Year Monthly Rolling from 2009 (Rolling Return From 29-04-2009 to 31-03-2021)
Emkay 12
Scheme A1 (G) A2 (G) D (G) F (G) H (G) I (G) K (G) S (G) M (G) Nifty 50
(Rebased)
From Apr’09 Apr’09 Jan’10 Apr’09 Apr’09 Apr’09 Apr’09 Apr’09 Apr’09 Apr’09 Apr’09
To 1st April, 2021
Minimum -21.41 -29.73 -20.36 -27.88 -31.10 -34.05 -27.84 -24.56 -27.03 -26.83 -29.20
Maximum 68.41 78.17 56.02 71.12 85.42 74.95 77.66 79.19 82.50 94.54 80.13
Average 15.89 12.24 11.10 10.01 10.70 10.13 13.26 11.10 12.56 16.02 9.72
Std. Deviation 14.22 18.26 14.54 16.01 16.96 21.59 17.16 16.26 18.27 20.45 15.59
No of
Observations 86 85 78 85 85 85 85 85 81 85 86
More than 10% 66.28% 51.76% 55.13% 45.88% 48.24% 42.35% 52.94% 51.76% 55.56% 58.82% 51.16%
More than 15% 50.00% 40.00% 43.59% 34.12% 35.29% 38.82% 42.35% 36.47% 44.44% 42.35% 33.72%
Average of Peers is 11.9% Average of Peers > 10% is 51.4% Average of Peers > 15% is 39.7%
20
Source : Independent analysis done by MSJ MisterBond Pvt Ltd
20Emkay’s 12 vis-à-vis leading Large Cap MF schemes
3 Year Monthly Rolling from 2009 (Rolling Return From 29-04-2009 to 31-03-2021)
Emkay 12
Scheme A1 (G) A2 (G) D (G) F (G) H (G) I (G) K (G) S (G) M (G) Nifty 50
(Rebased)
From Apr’09 Apr’09 Jan’10 Apr’09 Apr’09 Apr’09 Apr’09 Apr’09 Apr’09 Apr’09 Apr’09
To 1st April, 2021
Minimum 4.05 -2.10 0.98 -1.96 -3.10 -8.96 0.75 -2.37 -1.11 0.99 -2.01
Maximum 31.07 28.32 26.44 20.55 22.70 24.57 24.89 24.54 29.50 29.38 20.32
Average 15.54 11.68 12.96 9.09 9.63 8.58 12.14 10.35 12.35 14.51 9.11
Std. Deviation 6.05 7.19 5.54 5.52 6.05 8.06 5.68 6.15 7.99 7.28 4.86
No of
Observations 71 71 64 71 71 71 71 71 67 71 71
More than 10% 85.92% 54.93% 70.31% 39.44% 49.30% 43.66% 71.83% 47.89% 56.72% 71.83% 45.07%
More than 15% 49.30% 28.17% 39.06% 14.08% 19.72% 19.72% 29.58% 25.35% 32.84% 49.30% 8.45%
Average of Peers is 11.25 % Average of Peers > 10% is 56.21% Average of Peers > 15% is 28.65%
21
Source : Independent analysis done by MSJ MisterBond Pvt Ltd
21Emkay’s 12 vis-à-vis leading Large Cap MF schemes
5 Year Monthly Rolling from 2009 (Rolling Return From 29-04-2009 to 31-03-2021)
Emkay 12
Scheme A1 (G) A2 (G) D (G) F (G) H (G) I (G) K (G) S (G) M (G) Nifty 50
(Rebased)
From Apr’09 Apr’09 Jan’10 Apr’09 Apr’09 Apr’09 Apr’09 Apr’09 Apr’09 Apr’09 Apr’09
To 1st April, 2021
Minimum 2.23 -0.69 4.95 -1.72 -1.92 -4.65 0.54 0.20 -0.01 2.69 -0.79
Maximum 26.62 21.02 18.38 15.43 17.18 19.15 20.13 18.12 22.03 23.97 15.36
Average 15.88 13.50 13.18 10.41 11.26 10.59 13.64 11.96 14.07 16.48 9.88
Std. Deviation 5.08 4.52 3.00 3.56 4.00 5.64 4.07 3.46 4.60 4.50 3.27
No of
Observations 55 55 48 55 55 55 55 55 51 55 55
More than 10% 90.91% 80.00% 85.42% 60.00% 65.45% 56.36% 81.82% 72.73% 90.20% 94.55% 56.36%
More than 15% 69.09% 43.64% 31.25% 7.27% 12.73% 27.27% 49.09% 18.18% 52.94% 61.82% 1.82%
More than 20% 21.82% 3.64% 0.00% 0.00% 0.00% 0.00% 1.82% 0.00% 3.92% 23.64% 0.00%
Average of Peers Average of Peers Average of Peers Average of Peers
is 12.79% > 10% is 76.28% > 15% is 33.8% > 20% is 3.67%
22
Source : Independent analysis done by MSJ MisterBond Pvt Ltd
22Significant outperformance over well known Large Cap Mutual Funds
450
10-years performance for the portfolio has been
significantly above well-known Large Cap Mutual Funds Emkay’s 12 CAGR 12%
400
350
300 MF Avg CAGR 7%
250
200
Nifty CAGR 5%
150
100
50
-
Mar-10 Mar-11 Mar-12 Mar-13 Mar-14 Mar-15 Mar-16 Mar-17 Mar-18 Mar-19 Mar-20
Emkay's 12 Mutual Funds* Nifty 50
23
*Source : Independent analysis done by MSJ MisterBond Pvt Ltd
Note: Emkay’s 12 portfolio went live on 1st August’19. The back tested performance data is for
illustration purpose only. All fund data have been rebased to 100 from FY-2010.Emkay’s 12 - Portfolio Snapshot
Top Sectors
7.2% Financial Services
7.1%
Cement
31.3%
8.7% Oil & Gas
Pharmaceuticals
IT
8.3%
Gems & Jewellery
8.1% 9.6% Specialty Chemicals
9.7% 8.5% Auto & Auto Ancillary
Top 5 Holdings Market Cap
Divi's Laboratories Ltd. 9.7% 1.4%
Ultratech Cement Ltd. 9.6%
Large Cap
ICICI Bank Ltd. 9.3%
Cash
Pidilite Industries Ltd. 8.7%
Reliance Industries Ltd. 8.5% 98.7%
24
*Data as on 31st May 2021Emkay’s 12 Strategy - Performance Update
Emkay'12 (Model Portfolio) Emkay'12 (TWRR)
Nifty Nifty
Outperformance (Model v/s Nifty) Outperformance (TWRR v/s Nifty)
70.0 70.0
60.0 60.0
50.0 50.0
40.0 40.0
30.0 30.0
20.0 20.0
10.0 10.0
0.0
0.0
-10.0
-10.0
-20.0
3M 6M 12M Since
Inception 3M 6M 12M Since
Inception
3M 6M 12M Since Inception
Emkay'12 (Model Portfolio) 9.4 17.0 56.6 22.1
Emkay'12 (TWRR) 9.1 16.4 53.2 19.9
Nifty 7.3 20.2 62.7 21.1
Outperformance (Model v/s Nifty) 2.2 -3.2 -6.1 1.1
Outperformance (TWRR v/s Nifty) 1.9 -3.7 -9.4 -1.2
Inception Date : 1st August 2019 Data as on 30.05.2021
25Emkay’s 12 Strategy : a “Smart Alpha” large cap portfolio
Key features
Portfolio of 12
Focus on risk structural growth
adjusted returns companies
Steady performance
over medium term Possible alternative to
framework Large cap MFs
EMKAY’s
12
Lower portfolio volatility
Low portfolio turnover and high liquidity
• Emkay’s 12 is an equal weighted twelve stock large cap oriented strategy.
• A buy and hold strategy focusing on companies with wider economic moat and dominant position in the sector.
• Combination of value and growth to deliver medium to long term wealth creation.
26Fund Managers – Emkay L.E.A.D.
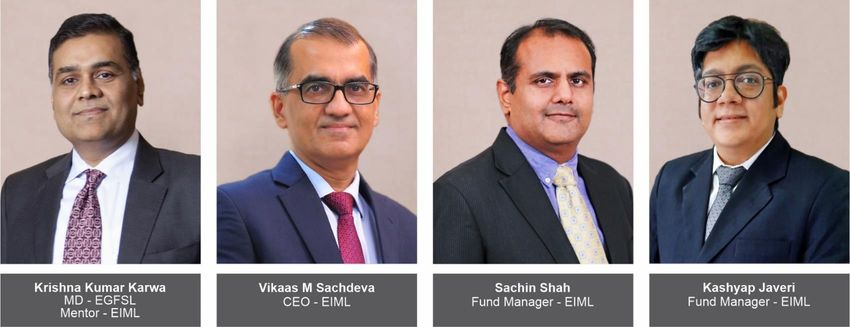
Kashyap Javeri Fund Manager
Kashyap Javeri is a fund manager with more than a decade of experience in company and sector research.
He brings exceptional insights into stocks and economy. Prior to joining Emkay Investment Managers,
he was a rated BFSI analyst in Emkay Institutional Equities for eight years and also worked with Sharekhan
Ltd as midcap analyst. Kashyap brings with him immense in-depth knowledge on not only variety of
manufacturing and services sectors but also on banking and economics.
Sachin Shah Co-fund Manager
Sachin is a seasoned fund manager with over two decades of experience in the Indian equity markets.
By virtue of his extensive research, Sachin realised early-on the need for a framework in which companies
with evasively tricky standing needed to be filtered out very objectively, leading to the development of E-Qual
Risk, EIML’s proprietary module which helps us to evaluate and compare listed companies on various
aspects of governance. Sachin shares his knowledge and insights through various media interactions across
print and digital platforms.
27Our Team
EGFSL: Emkay Global Financial Services Ltd | EIML: Emkay Investment Managers Limited
28Our reach & research across
~600 Non-institutional Clients ~ 60 Institutional Clients
~260 Stocks Research Coverage ~26 Industries Research Coverage
5 member investment team with collective experience of ~ 60 years
As on 31st May 2021
29About Emkay Global Financial Services Limited 30
Promoters

            Krishna Kumar Karwa, Managing Director
            A rank holder from the Institute of Chartered Accountants of India (ICAI), Krishna
            is the promoter and Managing Director of the Company. He has rich and varied
            experience of more than three decades in all aspects of the Equity Capital Markets
            and overlooks the Research, Equity Asset Management and Corporate Advisory
            divisions at Emkay.

            Prakash Kacholia, Managing Director
            A qualified Chartered Accountant of the 1987 batch, Prakash is the Promoter and
            Managing Director of the Company. He has a rich experience of more than three
            decades in the Capital Market and overlooks the Derivatives business and Retail
            division at Emkay. He has been on the board of the SEBI Committee on
            Derivatives. He has also served as a Director on the boards of Bombay Stock
            Exchange Limited, BOI Shareholding Limited and Central Depository Services
            (India) Limited.
 31
The figures speak for themselves
1,44,388 Non-institutional Clients 301 Institutional Clients
305 Stock Research Coverage
16 Sectors (Asset Mgmt, Retail, Insurance
are among the other sectors under coverage)
(Active + Soft coverage)
21 Branches 153 Franchisees
485 Employees Pan India Data as on 30 April 2021
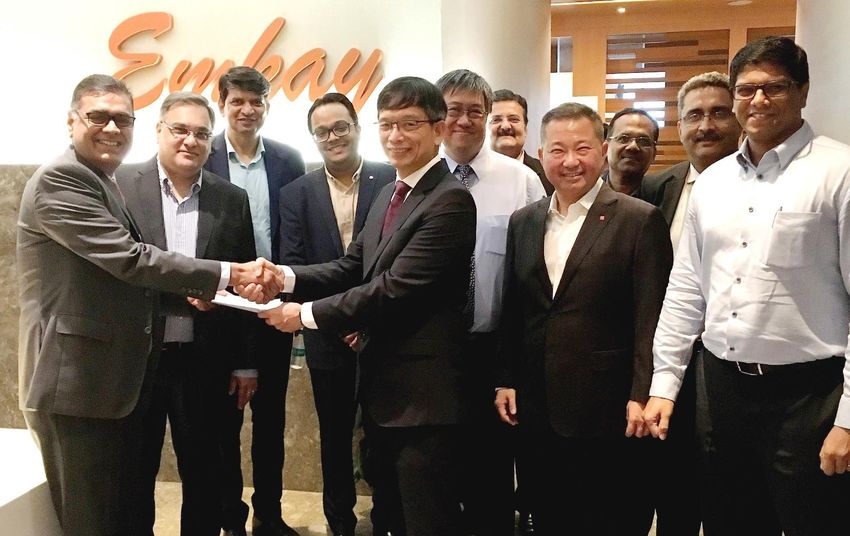
32Collaboration with DBS Vickers Securities
Emkay Global Financial Services Ltd. signed an
exclusive agreement with DBS Vickers Securities
(Singapore) Pte. Ltd., a wholly owned subsidiary of
DBS Bank, the largest bank of South-east Asia, for
sharing of knowledge, co-branding of research and
it’s distribution to the global clients of DBS Vickers.
33Contact Us
Emkay Investment Managers Ltd
7th Floor, The Ruby, Senapati Bapat Marg, Dadar - West, Mumbai 400028. India
CIN: U67190MH2010PLC203819 | PMS: INP000004458
Website: www.emkayim.com
For Sales
Ashu Tomar +91 98673 03861
Samir Merchant +91 99876 06786 | Kyra Ahuja +91 98219 14842
For Support
Namrata Momaya +91 22 6617 5453 | Email: pmsoperations@emkayim.com
Janhavi Surve +91 22 6612 1279 | Email: Janhavi.surve@emkayim.com
Disclaimer: This document has been prepared by Emkay Investment Managers Ltd (EIML) for information purposes only. This document and the
information contained herein shall not be disclosed or reproduced in whole or in part for any other purpose or furnished to any third party without the
express prior written permission of EIML.
EIML does not represent or warrant (express or implied) of any nature nor takes any responsibility or liability of any kind for any error or inaccuracy or any
losses suffered on account of information contained in this document. Information and/or data contained in this document is obtained from sources believed
to be reliable but cannot be guaranteed as to the completeness, timeliness, adequacy or accuracy of the information, hence EIML advises each recipient of
this document to verify the veracity / appropriateness of the information before taking any investment decisions. Past Performance if mentioned herein, is
not an indicator of future performance. Performance related information enclosed in this document is not verified by SEBI.
EIML and its group companies, its directors and employees shall have no liability for any misstatement or omission (by reason of negligence), opinions,
derivations, information or matters (express or implied) contained in the document. Each recipient of this document are advised to consult and/or make its
own independent evaluation and/or investigation before taking any investment decision.
PMS Investment products are subject to market risks, investors are advised to read all the PMS scheme related documents carefully before investment. For
further details, please visit: www.emkayim.com
34You can also read