FY21 Half Year Results - FEELS LIKE HOME - Aventus Group

Page created by Roland Watts
 
CONTINUE READING
FY21 Half Year Results - FEELS LIKE HOME - Aventus Group
FY21
Half Year Results
25 FEBRUARY 2021

FEELS LIKE HOME
FY21 Half Year Results - FEELS LIKE HOME - Aventus Group
Our Purpose

Feels Like Home
Our Values
                                                    Agenda

People first   |   Own it   |   Find a better way   03   FY21 Half Year Performance

                                                    04   Strategy
Our Team
                                                    06   COVID

                                                    07   Financial Results

                                                    15   Leasing & Development

                                                    20   Asset Management

                                                    23   FY21 Outlook

                                                    24   Appendices

                                                    Darren Holland
                                                    Chief Executive Officer           2
FY21 Half Year Results - FEELS LIKE HOME - Aventus Group
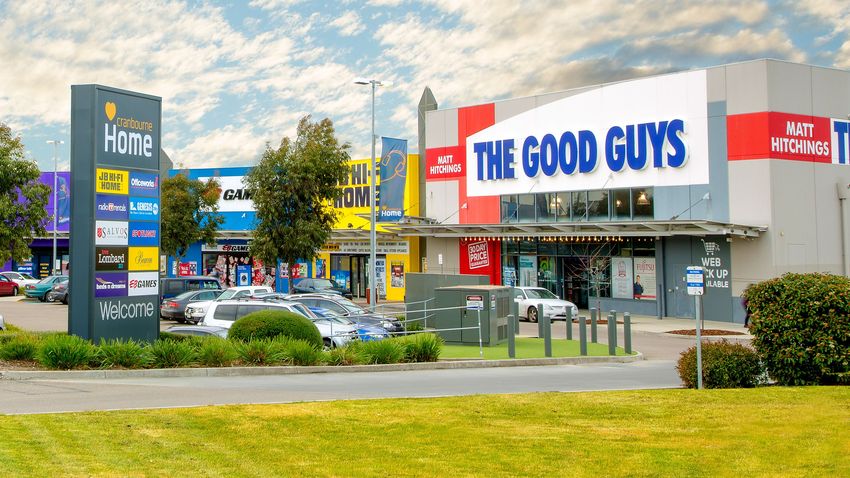
Strong Half Year
Performance

Key                                                                                         Financial                    Portfolio
Highlights                                                                                  Management                   Performance

98%                                                                                         $56m                         98.5%
Strong cash collection1                                                                     FFO ▲ 6.5%3                  Occupancy5 ▲ 0.5% 4

+8%                                                                                         34%                          41,000sqm
Centre traffic      growth2                                                                 Gearing ▼   2.0%4            GLA leased across 63 deals1

13%                                                                                         $2.50                        $46m
IRR achieved on Caringbah development                                                       NAV per security ▲   3.7%4   Net valuation uplift ▲ 2.4%4

1. Jul 2020 – Dec 2020                       3. For the 6 months ended 31 Dec 20 vs the 6
2. For the 6 months ended 31 Dec 20 (Excl.      months ended 31 Dec 19
   VIC) vs the 6 months ended 31 Dec 19      4. 31 Dec 20 vs 30 Jun 20
   (Excl. VIC)                               5. By GLA as at 31 Dec 2020                                                                                3
FY21 Half Year Results - FEELS LIKE HOME - Aventus Group
Our Strategy

                                             Delivering sustainable earnings growth and long-term shareholder returns

   Optimise Portfolio                                              Seize Consolidation                      Build Development                      Prudent Capital
   Performance                                                     Opportunities                            Pipeline                               Management
    Combine expertise, market insights                             Capitalise on opportunities to acquire   Enhance the near and long-term         Ensure capital is used efficiently to
    and strong retailer relationships to                           assets that complement the existing      earnings potential of the portfolio,   maximise income, execute on
    drive resilient portfolio income and                           portfolio and grow LFR market share      including the current land bank of     opportunities and achieve investor
    capital growth                                                 in excess of current 22%1                1.2 million sqm                        returns

                                                                                                                                                   Manage third-party capital to diversify
                                                                                                                                                   income and capital sources

1. For LFR centres >25,000 sqm. Source: Deep End Services as at
   1 Aug 2019; by GLA (excl. the former Masters Home Improvement
   tenancy)
                                                                                                                                                                                             4
FY21 Half Year Results - FEELS LIKE HOME - Aventus Group
Largest LFR
                                                                                                                                                                     Landlord in Sydney

                                                                                                                                                                           McGraths Hill

                                                                                                                                                                                                         Belrose
                                                                                                                                                                                      Castle Hill

                                                                                                                                                                     Marsden Park

                                                                                                                                                         17%
                                                                                                                                                        Queensland
                                                                                                                                                                                                    SYDNEY
                                                                                                                                                                                                     CBD

       3%                                                                                                                                                58%            Bankstown
    Western
    Australia                                                                                                                                           New South

                                                                          5%                                                                              Wales

                                                                         South
                                                                        Australia                                                                                                     Caringbah

                                                                                                                                             17%

$2.1b                                                                74%                                                                                             43%
                                                                                                                                             Victoria

Assets Under Management1                                             Metro by Value2                                                                                 Catchment Coverage
                                                                                                                                                                     of Sydney

1. Carrying value derived from independent and internal valuations                  2. All metrics exclude externally owned centres unless
                                                                                       otherwise stated                                                                                                      5
FY21 Half Year Results - FEELS LIKE HOME - Aventus Group
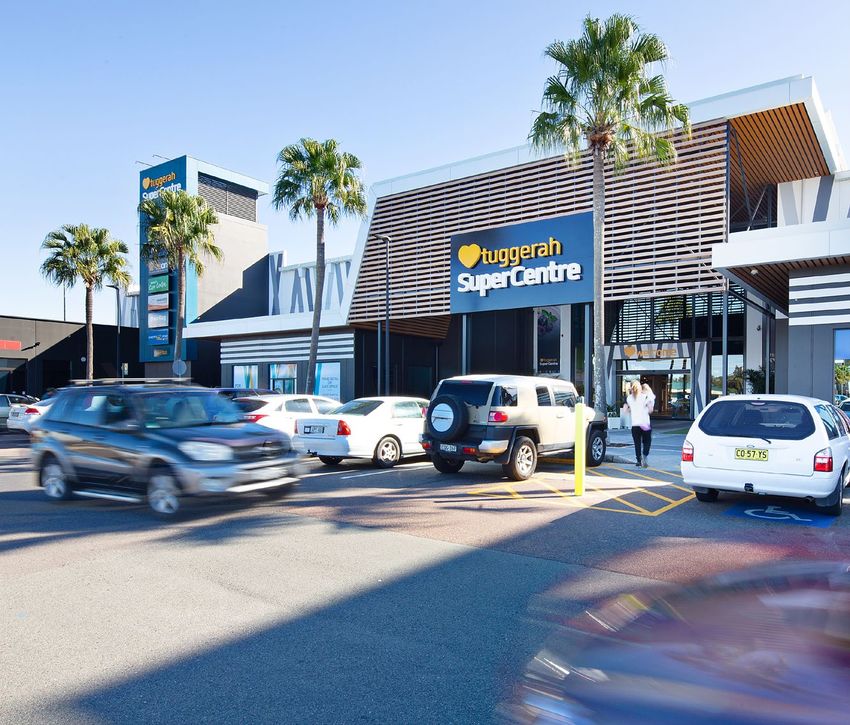
Strong Recovery                                                                                                                                                  Aligning COVID support with
                                                                                                                                                                 strong retailer performance
As Restrictions Eased                                                                                                                                            To ensure tenants could continue to operate through
                                                                                                                                                                 the initial lockdown, Aventus provided support rapidly
                                                                                                                                                                 to our retailers who requested assistance under the
Evidenced by improved rent collection of 98%
                                                                                                                                                                 National Code of Conduct
    Mar-20                                                                  Jun-20       Jul-20                                                         Dec-20
                                                                                                                                                                 Easing of restrictions saw strong increases in traffic
                                 87%                                                            100%               98%
                                                                                                                                                                 and retailer sales, reflecting pent-up demand,
         100%
                                                                                                                                                                 consumers shopping locally and travel restrictions

                                                                                                                                                                 A true-up of sales figures has now been performed to
                                                                                                                                                                 finalise the support provided to retailers.
                                                                                                                                                                 Consequently a one-off amount of $2m has been
                                                      11%                                                                                                        billed, including $1m of abatement reversals and $1m
                                                                          2%                                                            1%              1%       acceleration of deferrals

                                                                                                                                                 1

 And accelerating traffic
                                                                               110%      110%                      110%          109%
                                                                                                     107%                                        107%    108%

                                                                               110%
                       106%                                                              108%                                                    108%    107%
                                                                 105%
      103%
                                                                                                                                 101%
                                                                                                                    99%
                                                                                                      95%
                                    97%

                                                     79%
    Jan-20          Feb-20         Mar-20           Apr-20     May-20        Jun-20      Jul-20     Aug-20       Sep-20        Oct-20        Nov-20     Dec-20
                                         Traffic as a proportion vs the pcp (inc. VIC)            Traffic as a proportion vs the pcp (ex. VIC)
                                                                                                                                                                                                                          6
1. Net abatements and deferrals including True-up
FY21 Half Year Results - FEELS LIKE HOME - Aventus Group
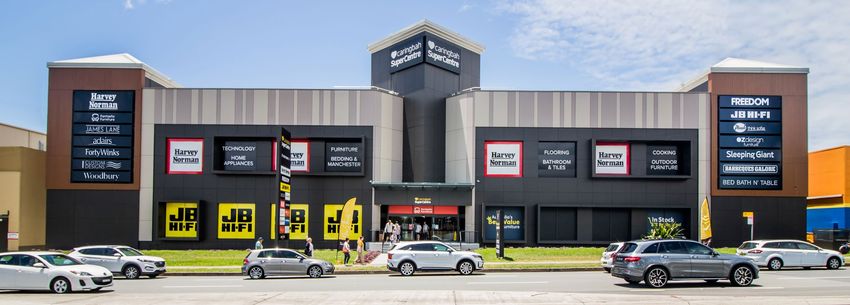
Financial
Results

Lawrence Wong
Chief Financial Officer   7
FY21 Half Year Results - FEELS LIKE HOME - Aventus Group
Key Financial
Metrics

Financial                                                                             Capital                                                                                          Debt
Performance                                                                           Structure                                                                                        Management

$56m                                                                                  34%                                                                                             5.9x
FFO ▲     6.5%1                                                                       Gearing4      ▼   2.0%3                                                                          Interest Cover Ratio6 ▲ 0.7x3

10.0c                                                                                 $2.24                                                                                           2.6 years
FFO per      security2                                                                NTA per security ▲            4.7%3                                                              Weighted Average Debt Expiry
▲ from 9.6 cents1

8.2c                                                                                  $136m                                                                                           2.8%
                                                                                      Available cash and                                                                               Weighted Average Cost of Debt5
Distributions per security                                                            undrawn debt liquidity                                                                           ▼ 30 bps from 3.1%3

1. For the 6 months ended 31 Dec 2020 vs the 6 months ended 31 Dec 2019               3. 31 Dec 20 vs 30 Jun 20                                                                 6.   Interest Cover Ratio (ICR) is calculated as EBITDA divided by interest expense
2. Based on a weighted average number of securities of 561m over the 6 months ended   4. The gearing ratio is calculated as total debt less cash and cash equivalents divided
   31 Dec 2020                                                                           by total assets less cash and cash equivalents and intangible assets including
                                                                                         proportional interests in investments in associates                                                                                                                          8
                                                                                      5. Weighted average cost of debt is calculated based on historical finance costs,
                                                                                         excluding amortisation of debt establishment costs and net fair value gains/losses
                                                                                         on interest rate swaps, for the 6 months ended 31 Dec 2020
FY21 Half Year Results - FEELS LIKE HOME - Aventus Group
Income
Statement
                                                                                                                                                                         6 months to         6 months to
Income Statement ($m)
                                                                                                                                                                         31 Dec 2020         31 Dec 2019
Net operating income                                                                                                                                               A                 71                 70

Net movement in fair value of investment properties                                                                                                                B                 46                 20

Other revenue                                                                                                                                                      C                  2                      1

Finance costs                                                                                                                                                      D                 (7)               (12)

Other expenses                                                                                                                                                     E                 (8)                    (8)

Net profit                                                                                                                                                                         103                  72

Commentary
A   $1m increase in net operating income (NOI) is mainly due to: i) $1m increase in rental income; ii)   C   Relates to fees received from APS1 and Kotara North
    $1m increase in net bad and doubtful debts ($2m gross bad and doubtful debts less $1m in
    COVID abatement reversals);                                                                          D   Decrease in finance costs was mainly due to $2m in lower interest expenses and $2m in higher
    iii) $1m in lower NOI from McGraths Hill Home which was sold in Nov 19                                   fair value gains on interest rate swaps

B   Represents net fair value gains from independent and internal property valuations for 1H21
                                                                                                         E   Other expenses include $5m of employee benefit expenses. Netted against the expense is
                                                                                                                                                                                                             9
                                                                                                             $0.6m in JobKeeper payments for the period Jul to Sep 2020
FY21 Half Year Results - FEELS LIKE HOME - Aventus Group
Funds from Operations
(FFO) Reconciliation
                                                                                    6 months to    6 months to
 FFO ($m)
                                                                                    31 Dec 2020    31 Dec 2019
 Net profit                                                                                103             72
 Straight-lining of rental income                                                             1              1
 Amortisation of debt establishment costs                                                     1              1
 Net movement in fair value of investment properties                                       (46)           (20)
 Net movement in fair value of derivative financial instruments                              (4)            (1)
 Other                                                                                       1              -
 FFO                                                                                        56             53
 Operating capex                                                                             (1)            (2)
 Leasing costs                                                                              (2)            (1)
 Adjusted Funds From Operations (AFFO)                                                      53             49

                                                                                    6 months to    6 months to
 Per Security (cents)
                                                                                    31 Dec 2020    31 Dec 2019
 Distributions per security                                                                 8.2            8.5
 FFO per security1                                                                         10.0            9.6
                              1
 AFFO per security                                                                         9.4            9.0
 Payout ratio (% of FFO)                                                                  82%            89%
 Payout ratio (% of AFFO)                                                                 87%            94%

1. Based on a weighted average number of securities for 1H21 of 561m (1H20: 547m)                           10
Operating Cashflow
Supports Distributions
                                                                                               Surplus Cash Generated from Operations1
Cash Provided by                                                  6 Months to   6 Months to
Operations ($m)                                                   31 Dec 2020   30 Dec 2019
                                                                                                                                9             34
                                                                                                                 10

Receipts in the course of operations (inclusive of GST)                   97            98        10
                                                                                                                                                             12

Payments in the course of operations (inclusive of GST)                  (29)          (33)

Finance costs paid                                                       (10)          (13)
                                                                                                 FY17          FY18            FY19          FY20           1H21
                                                                                                  Cash funded distributions   Surplus cash generated from operations

Income tax paid                                                             -            (1)
                                                                                               Cashflow Movements

Cash provided by operations                                               58            52

Distributions declared                                                   (46)          (47)

Payout ratio
                                                                       79.2%         90.7%
(% of Operating Cashflow)

1. Excludes one off performance fees and transaction costs paid
                                                                                                                                                                   11
Balance Sheet
                                                                                                                                          Balance as at        Balance as at
 Balance Sheet ($m)                                                                                                                                                                     Movement
                                                                                                                                           31 Dec 2020          30 Jun 2020
 Assets
 Cash and cash equivalents                                                                                                                             11                   39                  (28)
 Investment properties1                                                                                                                            2,006                1,933                    73
                                                                                                                                    A
 Investment in associates                                                                                                                               6                    6                        -
                                                                                                                                    B
 Intangible assets                                                                                                                                   144                  144                         -
 Other assets                                                                                                                                          12                   14                   (2)
                                                                                                                                    C
 Liabilities
 Borrowings                                                                                                                                         (692)                (735)                   43
                                                                                                                                    D
 Distribution payable                                                                                                                                 (24)                (13)                  (11)
 Other liabilities                                                                                                                                    (42)                (48)                        6
 Net assets                                                                                                                                        1,421                1,340                    81
 Securities on issue (million)                                                                                                                       568                  557                    11
 NTA per security                                                                                                                                  $2.24                $2.14                 $0.10
 NAV per security                                                                                                                                  $2.50                $2.41                 $0.09

Commentary
 A    $73m increase in investment properties during 1H21 includes $46m in net fair value gains,   C   Balance includes $9m of rental debtors (Jun 2020: $12m) offset by a $3m provision for bad and
      $16m in capital expenditure and $12m in acquisitions (Epping site acquisition)                  doubtful debts (Jun 2020: $7m)

 B    Investments in associates represents AVN's 25.3% interest in Aventus Property Syndicate 1   D   Gearing at 31 Dec 2020 was 34.0% (Jun 2020: 36.0%). 2% decrease was mainly due to debt
      (APS 1)                                                                                         repayments following $22m in equity raised via the DRP for the quarter ended 30 Sep 2020 and
1. Investment properties as at 31 Dec 2020 include $3m of rental guarantees (30 Jun 2020: $3m)        $46m of net valuations gains for 1H21                                                       12
Portfolio
Valuation Uplift

Valuations
Independent valuations performed
comprised 29% of the portfolio by value,
with internal valuations undertaken for the
remaining 71%. Total net portfolio
valuation up $46m or 2.4%

                                                                                                                                                                                                6.64%
                                                                                                        Portfolio Valuation1 Bridge ($m)
Income Growth
Income growth contributed $24m of net                                                                                                                                                           Weighted Average Cap Rate3,6
valuation uplift. Driven by annual rent                                                                                                                                                         ▼ 9 bps
escalations and high occupancy

Cap Rate Compression                                                                                                                                                                            +2.4%
Cap rate compression of 9 basis points                                                                                                                                                          Net valuation change6
driven asset specific factors including
development completion, site
amalgamation and asset stabilisation
                                                                                                                                                                                                +$270m+

                                                                                                                                                  growth
                                                                                                                                                 Income

                                                                                                                                                                                   4
                                                                                                                                                                         compression
                                                                                                                                                                            Cap rate

                                                                                                                                                                                       Dec-20
                                                                                                                                  expenditure2
                                                                                                                                       Capital
                                                                                                           Jun-20

                                                                                                                       Epping
                                                                                                                    acquisition

                                                                                                                                                           Caringbah
                                                                                                                                                            net uplift
                                                                                                                                                                                                Valuation uplift5 over last 3.5 years

1. Portfolio valuation includes rental guarantees    3.   As at 31 Dec 2020
   and excludes McGraths Hill                        4.   Cap rate compression excluding Caringbah
2. Capitalised expenditure represents                5.   Like for like FY20 valuation figure of $200
   development and maintenance capex,                6.   Excludes McGraths Hill                                                                                                                                                13
   capitalised leasing costs, capitalised interest
   on developments and straight lining of $1m.
Prudent Capital Management
and Liquidity
Capital Management                                                                                                                      Balance as at                       Balance as at
                                                                                                                                                                                                            No Near-Term Debt Expiries
Key Metrics                                                                                                                              31 Dec 2020                         30 Jun 2020                    500

                                                                                                                                                                                                                                                                     460
                                                                                                                                                                                                            400
Drawn debt ($m)                                                                                                                                          695                                738
                                                                                                                                                                                                            300
Facility limit ($m)                                                                                                                                      820                                820
                                                                                                                                                                                                            200

                                                                                                                                                                                                                                                                                57.5
Cash and undrawn debt capacity ($m)                                                                                                                      136                                121             100
                                                                                                                                                                                                                                        100           100                      102.5
                                                                                                                                                                                                              0
Gearing1 (%)                                                                                                                                         34.0%                              36.0%                          FY21          FY22             FY23          FY24        FY25

                                                                                                                                                                                                                  Syndicated Domestic           Syndicated International     Bank Debt
                            2                                                                                                                                                                                     Loan Notes                    Loan Notes
Loan to value ratio (LVR) (%)                                                                                                                        34.8%                              38.5%

Interest coverage ratio3 (ICR) (x)                                                                                                                      5.9x                                5.2x            Interest Cover Ratio3 and Gearing
                                                                                                                                                                                                      7.5                                                                                   48%
                                                                                                                                                                                                            6.3                                                                             46%
Weighted average cost of debt4 (%)                                                                                                                     2.8%                               3.1%        6.5                                                                        5.9
                                                                                                                                                                                                                                                                                            44%
                                                                                                                                                                                                                          5.5
                                                                                                                                                                                                                                                                       5.2
                                                                                                                                                                                                      5.5                                4.7            4.7                                 42%
Weighted average debt maturity (years)                                                                                                                    2.6                                3.1                                                                                            40%
                                                                                                                                                                                                      4.5
                                                                                                                                                                                                                                                                                            38%
                                                                                                                                                                                                                          39%                           39%
Proportion of drawn debt hedged (%)                                                                                                                  60.4%                              62.3%         3.5                                                                                   36%
                                                                                                                                                                                                         36%                             36%                          36%                   34%
                                                                                                                                                                                                      2.5
                                                                                                                                                                                                                                                                                 34%        32%
Weighted average hedge expiry (years)                                                                                                                     1.3                                1.7      1.5                                                                                   30%
                                                                                                                                                                                                                                 5
                                                                                                                                                                                                        FY16              FY17           FY18           FY19          FY20       1H21

1. The gearing ratio is calculated as total debt less cash and   2. The LVR ratio is calculated as total debt divided by the total     4. Weighted average cost of debt is calculated based on                    ICR (Covenant minimum 2.0x)                  Gearing %
   cash equivalents divided by total assets less cash and cash      fair value of investment properties. Fair value is calculated by      historical finance costs excluding amortisation of debt
   equivalents and intangible assets including proportional         reference to the most recent independent valuation for each           establishment costs and net fair value gains / losses on
   interests in investments in associates                           property                                                              interest rate swaps
                                                                 3. ICR is calculated as EBITDA divided by interest expense            5. Proforma numbers including the acquisition of Castle Hill                                                                                    14
                                                                                                                                          Super Centre and Marsden Park Home
Leasing &
Development

Jason James
Head of Leasing
                  15
Strong Portfolio                                                                                                                                                    Leasing strategy and expertise
                                                                                                                                                                            continues to drive income growth
        Outcomes                                                                                                                                                            Affordable rent relative to other retail
                                                                                                                                                                            subsectors combined with strong sales growth
       Staggered Lease Expiry Profile1 (%)
                                                                                                                                                                            and traffic performance, provide support for
                                                                                                                                                                            continued rent growth and tenant demand.
                                                                                                                                                                    55.6%

                                    1.5%
                                                              5.1%               12.6%                       10.5%
                                                                                                                                         14.7%                              98.5% $331
                                                                                                                                                                            Occupancy1 ▲ 0.5%4          Avg. Gross Rent
                                                                                                                                                                                                        per sqm ▲ 1.8%4
                                   Vacant                    FY21                  FY22                      FY23                         FY24                      FY25+
                                Holdovers       Lease Expiry Profile

       Affordable Rent Compared to Other Retail Subsectors2
                                                                                                                                                                            3.8yrs 41k
                                                                                                                                                                            WALE3 ▼ 0.1yrs4             Sqm of GLA across
                                                                                                                                                                                                        63 Deals6
                                                                                                                                                                    7.8x
Average Gross Rent / sqm p.a.

                                                                                                   2.8x
                                                                                                                                    4.9x
                                                                                                                                                                            3.8%
                                                                                                                                                                            Fixed Weighted Average
                                                                                                                                                                                                        77%
                                                                                                                                                                                                        Fixed Annual
                                                                       2.4x                                                                                                 Rent Review5 %              Reviews3 ▲ 1%4
                                             $331

                                            Aventus                Neighbourhood              Sub-regional                        Regional                          CBD
         1. By GLA as at 31 Dec 2020                                                          5. Fixed weighted average rent review by income excludes CPI.
         2. Source: JLL Research. Reflects specialty rents for all sub-sectors except Large   6. For the 6 months ended 31 Dec 20 vs the 6 months ended 31 Dec 19
            Format Retail. Rents as at 4Q20                                                   7. By GLA as at 31 Dec 2020
         3. By gross income as at 31 Dec 2020                                                                                                                                                                              16
         4. 31 Dec 20 vs 30 Jun 20
Diversified National
Tenant Base
Diversified tenant base with 88%1 national
retailers and no tenant accounting for greater
than 5% of income
                                                                                             37%
                                                                                             Everyday Needs2

No department stores or discount department
stores and less than 2% by income exposure
to fashion and apparel

Top 15 Tenants by Income

      Bunnings
The Good Guys
Harvey Norman
                        0%           1%           2%          3%           4%           5%

                                                                                             33%
                                                                                             Furniture and
       Freedom                                                                               Bedding
        JB Hi-Fi
Beacon Lighting

                                                                                             11%
          Adairs
    Forty Winks                                                                                       Homewares
       Spotlight

                                                                                             10%
        Snooze
      Fantastic
                                                                                                      Hardware and
   Officeworks                                                                                        Coverings3
  BBQs Galore
           BCF
      Domayne
1. National retailers percentages based on GLA
2. Everyday-needs tenants include food and beverage, supermarkets, liquor and convenience,
   services, health and well-being, automotive, office supplies, discount variety and pets
3. Includes garden                                                                                                   17
Enhancing Value
Through
Development

$9.5m
FY21 Remaining Development Spend

Track Record                                                          Opportunity to        Opportunity to
Since Listing in FY16                                                 Unlock Land Bank      Intensify Land Use

$120m+                                                                1.2m sqm              82%
Development Spend                                                     Land Area             of Portfolio with Development Opportunity2

9%                                                                    44%                   39%
Average Cash Yield1                                                   Site Coverage Ratio   of Portfolio with Zoning for Other Uses3

18k+                                                                                        11km
Sqm of GLA Added                                                                             of Street Frontage

1. Based on income producing development projects since Oct 2015
2. By site area                                                                                                                          18
3. By GLA attributable to zoning alternative to Large Format Retail
Key Development
               Highlights

               13%
               IRR, delivered during COVID

               $42m
               Valuation uplift ▲ 43% post development

               6.25%
               Centre Capitalisation Rate ▼ 125 bps1

               $34m+
Successful
               Total development spend over 12 months

Caringbah      4.0 yrs
               Centre WALE ▲ 3.2 years1

Completion
During COVID   100%
               Centre Occupancy

               1. 31 Dec 2020 vs 30 Jun 2020             19
Asset
Management

Ruth Jothy
Head of Asset Management
                           20
Customer First   Enabling data-led decision making

Driving          Large format retail is benefiting from changing
                 consumer behaviour:

Performance      • A shift to working, learning and entertaining in the
                   home and investment by consumers to improve
                   and enhance home life

                 • Preference for large, open and accessible retail
                   centres that allow for social distancing

                 • Convenient Click & Collect centres that enable
                   “browse online – shop instore”

                 In response, Aventus is active in leveraging this
                 demand with initiatives that include:

                 • Utilising spending data to enable location-based
                   shopper and retailer insights

                 • Leverage online and social media data to increase
                   engagement

                 • Interactive customer listening tools to provide
                   real-time feedback

                 44m
                 Shopper visits p.a.
                                                 672k
                                                 Unique website visits
                 ▲ 2% from last year             p.a. ▲ 38% from last year

                                                                             21
Diversified Income
Sustainability
Opportunities

Opportunities
                                             Solar                                                  Ticketless
Leveraging portfolio opportunities to grow
additional income streams through:
                                             Projects                                               Parking
• Solar and Embedded Networks

• Storage
                                             Following the successful rollout of                    Regulatory approval has been
• Digital signage on major roadways

• Ticketless Parking
                                             our foundational solar project at
                                             Midland, the next stage is the
                                             rollout of solar across the portfolio
                                                                                     94%            granted for the rollout of our first
                                                                                                    ticketless parking project at Kotara.   13k+
                                                                                     of roof area                                           free parking
                                             with Marsden Park our next                             This acts as the foundation for
                                             project.                                unutilised                                             spaces
                                                                                                    future rollouts across relevant
                                                                                                    centres, improves customer
                                             Additional income opportunities
                                             will also be realised as we expand                     experience and grows additional
                                             our embedded networks.                                 revenue streams.

                                                                                                                                                     22
Upgrade to
FY21 Guidance
FY21 Upgraded Guidance
Aventus is upgrading its FY21 FFO per security
guidance to at least 19.0 cps or 4%+ on FY20.

This guidance includes the one-off benefit from the true-
up, and is subject to no further major outbreaks of
COVID and no new significant government restrictions.

                                                            FY21 Upgraded
                                                            Guidance

                                                            4 +
                                                             %
                                                            FFO growth per security
                                                            (at least 19.0 cps)

                                                                                      23
Appendices

         24
Portfolio Metrics
                                         Ownership      Valuation                  Carrying            Capitalisation                                 WALE     Number of          GLA     Site Area    National                   Dev.
     Centres               State                                                                                             Occupancy3                                                                            Zoning
                                            Share       Type2                    Value ($m)                     Rate                                (years)4   Tenancies   (‘000 sqm)   (‘000 sqm)    Retailers1                Potential5

     Bankstown             NSW               100%       Internal                            67                6.75%                  100%               4.3          23           18            40         93%     LFR             NO
     Belrose               NSW               100%       Independent                       183                 6.25%                  100%               3.0          47           37            44         89%     LFR/Retail     YES
     Caringbah             NSW               100%       Independent                       139                 6.25%                  100%               4.0          27           21            23         85%     LFR            YES
     Castle Hill           NSW               100%       Internal                          347                 5.75%                    99%              3.8          77           51            60         81%     LFR/Retail     YES
     Highlands             NSW               100%       Independent                         37                7.00%                  100%               4.4          14           11            32         86%     LFR/Retail     YES
     Kotara South          NSW               100%       Internal                          124                 6.50%                    99%              4.2          24           29            53         97%     LFR/Retail     YES
     Marsden Park          NSW               100%       Internal                          102                 6.00%                  100%               4.2          31           20            40         96%     LFR             NO
     McGraths Hill         NSW                25%       Internal                            43                7.00%                  100%               3.6           9           16            38         98%     LFR             NO
     Tuggerah              NSW               100%       Internal                            96                7.00%                    96%              4.5          35           39           127         82%     LFR/Outlet     YES
     Warners Bay           NSW               100%       Independent                         46                7.00%                  100%               4.7          12           12            35         98%     LFR             NO
     TOTAL NSW                                                                          1,183                 6.28%                    99%              3.9         299          254           493         88%
     Ballarat              VIC               100%       Internal                            43                7.50%                  100%               2.8          15           20            52         93%     LFR            YES
     Cranbourne            VIC               100%       Internal                          143                 7.25%                    99%              4.8          38           57           194         91%     LFR/Retail     YES
     Epping                VIC               100%       Independent                         60                7.25%                    99%              2.1          30           22            91         64%     Mixed Use      YES
     Peninsula             VIC               100%       Independent                         95                7.25%                  100%               3.4          33           33            85         92%     LFR/Retail     YES
     TOTAL VIC                                                                            341                 7.28%                    99%              3.7         116          132           422         86%
     Jindalee              QLD               100%       Internal                          136                 7.00%                    97%              2.7          52           27            72         74%     Mixed Use      YES
     Logan                 QLD               100%       Internal                            92                7.00%                    98%              3.7          30           27            27         90%     LFR            YES
     Macgregor             QLD               100%       Independent                         27                7.00%                    82%              6.5           8           12            29         67%     LFR             NO
     Sunshine Coast        QLD               100%       Internal                          102                 7.00%                    97%              3.7          35           27            69         90%     LFR/Retail     YES
     TOTAL QLD                                                                            356                 7.00%                    95%              3.5         125           93           197         82%
     Mile End              SA                100%       Internal                          105                 7.25%                  100%               3.1          34           34            71         91%     LFR            YES
     TOTAL SA                                                                             105                 7.25%                  100%               3.1          34           34            71         91%
     Midland               WA                100%       Internal                            64                7.25%                  100%               3.7          18           23            43         96%     LFR             NO
     TOTAL WA                                                                               64                7.25%                  100%               3.7          18           23            43         96%
     TOTAL6                                                                             2,049                 6.65%                 98.5%               3.8         592          537         1,225         88%

1.   Metrics as at 31 Dec 2020                       5. Further development of certain centres may be           6. Includes McGraths Hill at 100%
2.   As at 31 Dec 2020                                  subject to contractual and regulatory approvals
3.   By GLA as at 31 Dec 2020                           including planning approvals from relevant local
4.   By gross income as at 31 Dec 2020                  government authorities                                                                                                                                                          25
Aventus
    Portfolio

  1.2m
    Square metres of total land area
                                       Ballarat VIC 39% Site Coverage         Cranbourne VIC 29% Site Coverage   Epping VIC 24% Site Coverage

    across the Portfolio

   44 %
    Portfolio Site Coverage %

                                       Mornington VIC 39% Site Coverage       Jindalee QLD 37% Site Coverage     Logan QLD 100% Site Coverage

Macgregor QLD 42% Site Coverage        Sunshine Coast QLD 39% Site Coverage   Mile End SA 48% Site Coverage      Midland WA 55% Site Coverage   26
Aventus
                                                                                                                   Portfolio

Bankstown NSW 44% Site Coverage      Belrose NSW 83% Site Coverage         Caringbah NSW 91% Site Coverage
                                                                                                                   20
                                                                                                                   LFR centres in the portfolio

                                                                                                                  11km
                                                                                                                    of Street Frontage

Castle Hill NSW 85% Site Coverage    Kotara NSW 55% Site Coverage          Mittagong NSW 36% Site Coverage

Marsden Park NSW 50% Site Coverage   McGraths Hill NSW 44% Site Coverage   Tuggerah NSW 30% Site Coverage    Warners Bay NSW 35% Site Coverage    27
Thank you   With thanks from
            today’s speakers

            Darren Holland                      Lawrence Wong
            Chief Executive Officer             Chief Financial Officer
            Email: darren@aventusgroup.com.au   Email: lawrence@aventusgroup.com.au
            Phone: (02) 9285 6700               Phone: (02) 9285 6700

            Ruth Jothy                          Jason James
            Head of Asset Management            Head of Leasing
            Email: ruth@aventusgroup.com.au     Email: jason@aventusgroup.com.au
            Phone: (02) 9285 6700               Phone: (02) 9285 6700

            aventusgroup.com.au
                                                                                      28
Disclaimer

This presentation has been prepared on behalf of the Aventus Group             This document contains certain forward-looking statements along with
(comprising Aventus Holdings Limited ACN 627 640 180 (AHL) and                 certain forecast financial information. The words “anticipate”, “believe”,
Aventus Capital Limited ABN 34 606 555 480 AFSL 478061 (ACL) as                “expect”, “project”, “forecast”, “guidance”, “estimate”, “outlook”,
responsible entity of the Aventus Retail Property Fund ARSN 608 000            “upside”, “likely”, “intend”, “should”, “could”, “may”, “target”, “plan”, and
764) (together, the AVN Group, Group or AVN). The information                  other similar expressions are intended to identify forward-looking
contained in this document is current only as at 31 Dec 2020 or as             statements. The forward-looking statements are made only as at the
otherwise stated herein. This document is for information purposes only        date of this document and involve known and unknown risks,
and only intended for the audience to whom it is presented. This               uncertainties, assumptions and other important factors, many of which
document contains selected information and should be read in                   are beyond the control of AVN. Such statements reflect the current
conjunction with the financial statements for the period and other ASX         expectations of AVN concerning future results and events, and are not
announcements released from time to time. This document may not be             guarantees of future performance. Actual results or outcomes for AVN
reproduced or distributed without AVN’s prior written consent. The             may differ materially from the anticipated results, performance or
information contained in this document is not investment or financial          achievements expressed, projected or implied by these forward-looking
product advice and is not intended to be used as the basis for making          statements or forecasts. Other than as required by law, although they
an investment decision. AVN has not considered the investment                  believe that there is a reasonable basis for the forward-looking
objectives, financial circumstances or particular needs of any particular      statements, neither AVN nor any other person gives any representation,
recipient. You should consider your own financial situation, objectives        assurance or guarantee (express or implied) that the occurrence of these
and needs, conduct an independent investigation of, and if necessary           events, or the results, performance or achievements expressed in or
obtain professional advice in relation to, this document.                      implied by any forward-looking statements contained herein will actually
                                                                               occur and you are cautioned not to place undue reliance on such
Except as required by law, no representation or warranty, express or           forward-looking statements. Risk factors (which could be unknown or
implied, is made as to the fairness, accuracy, completeness or                 unpredictable or result from a variation in the assumptions underlying the
correctness of the information, opinions and conclusions, or as to the         forecasts) could cause actual results to differ materially from those
reasonableness of any assumption, contained in this document. By               expressed, implied or projected in any forward-looking statements or
receiving this document and to the extent permitted by law, you release        forecast. Past performance is not an indicator or guarantee of future
AVN, AHL, ACL and its directors, officers, employees, agents, advisers         performance or results.
and associates from any liability (including, without limitation, in respect
of direct, indirect or consequential loss or damage or any loss or
damage arising from negligence) arising as a result of the reliance by you
or any other person on anything contained in or omitted from this
document.

                                                                                                                                                               29
You can also read