CURRENT WATER SITUATION IN THE WESTERN CAPE - VINPRO - GreenAgri
←
→
Page content transcription
If your browser does not render page correctly, please read the page content below

CURRENT WATER SITUATION
  IN THE WESTERN CAPE
            VINPRO

        A S Roux Pr Eng   21 May 2018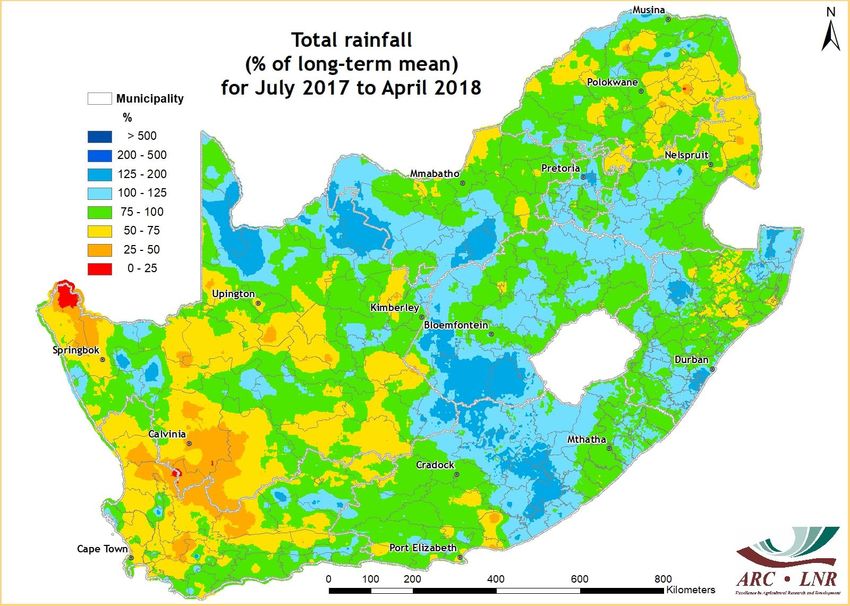
Content of presentation
•Limited water resources
•Current water situation
• Seasonal weather outlook
• Day Zero concept
• WC Water Supply System
• Impact of the drought on agriculture
•Support provided by WC Government
• Augmentation by City of Cape Town
• Take home message

          © Western Cape Government 2012 |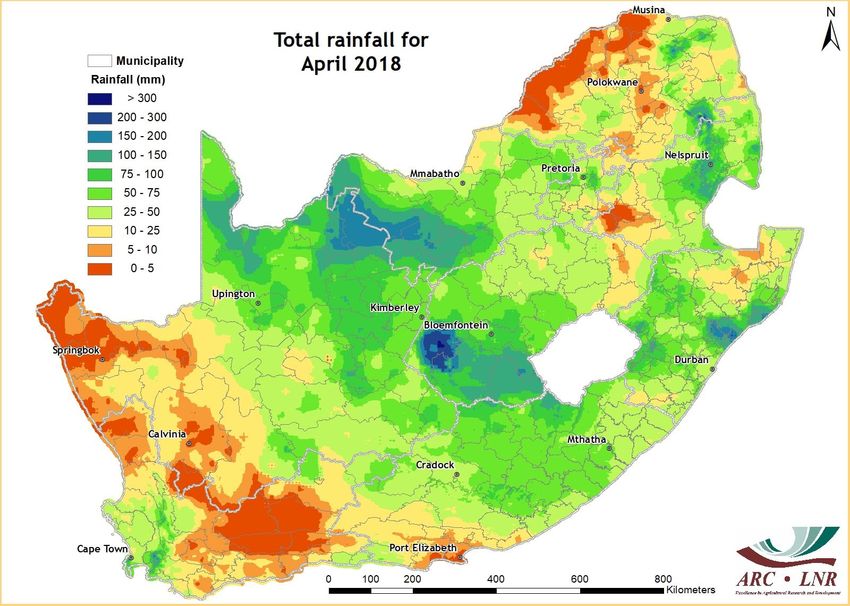
When the well is dry,
we learn the worth
of water.
Benjamin Franklin

    © Western Cape Government 2012 |   3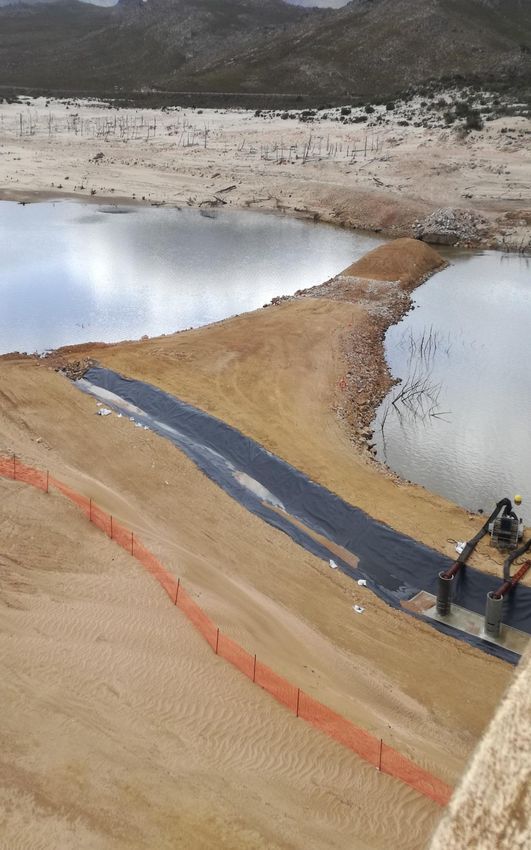
Water is for fighting, whiskey is for
               drinking

Mark Twain

        © Western Cape Government 2012 |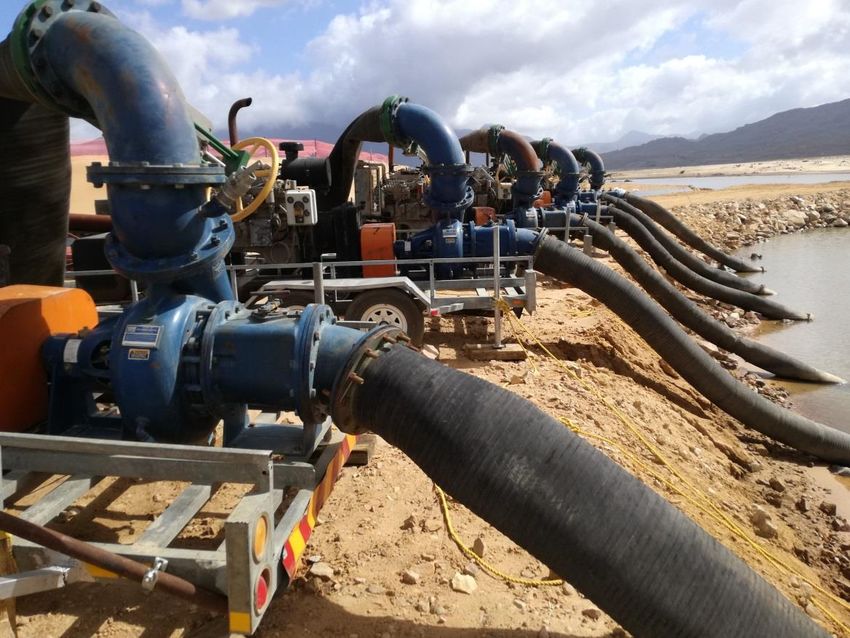
5
Limited water resources available
Transfers

            © Western Cape Government 2012 |
Western Cape Strategic Water Source Areas (SWSAs)

SWSAs supply 98% of Cape Town’s water

Current water situation

10
2018/05/30 Templ ref: PPT-ISO-colour.001 Doc Ref no: 11
VARIABLE RAINFALL!
DASHBOARD: 4 YEAR HISTORIC DAM LEVELS

                      15/10/2015: 73.4%
                                          15/10/2016: 61.8%

                                                              15/10/2017: 37.0%
Why is there a shortage of water in Cape Town?
The National Department of Water and Sanitation
is responsible for planning and implementing
Cape Town is experiencing an water resources schemes to meet water demand
unprecedented multi-year for cities, industries, mining and agriculture.
drought event.
The Department plans at a 1 in 50 year level of
assurance. This means that during droughts with a
severity of 1:50 years or more, restrictions need to
be imposed to reduce demand.
The current drought is much more severe than a 1
in 50 drought event. The best estimate of the
return interval of the meteorological drought in
the region of WCWSS dams is 311 years, with 90%
confidence that it actually falls between 105 and
1280 years1.
The next augmentation scheme for Cape Town
was planned for 2022/3 and is being accelerated
by the national Department. This scheme
2015 (augmentation of Voelvlei Dam) is unlikely to be
ready before 2021.
2016
201716
17
18
WCSIF 7 March 2017 19
Agro-meteorological situation in Western Cape
Normally winter rain start around the Easter Weekend
Winter rain started very late, first significant rain in June 2017.
Far below normal rain fell in May to October (less than 50% of Long Term
average) which had significant impact on water levels in our major
storage dams
Cape Town airport only received 30% of it’s long term average rainfall
(153 mm vs 510 mm)
Dam levels much lower than corresponding time last year
 Area               % on 14/5/2018   % on 14/5/2017   % on 14/5/2015
 Berg                     32.0             28.6             50.8
 Breede                   11.1             16.5             44.2
 Olifants/Doorn           5.2              8.5              11.0
 Gouritz                  21.5             20.8             44.3
 WC Province              16.9             19.3             43.4
 Cape Town supply         21.0             20.8             51.6

                                                                           20
Critical dam levels
Dam % on % change from % on Storage
14/5/2018 last week 14/5/2015 capacity Mm3
Greater Brandvlei 5.9 +1.0 36.6 286
Theewaterskloof 11.8 +0.8 52.8 479
Voëlvlei 14.4 +0.1 45.3 158
Berg River 37.8 +1.1 53.7 127
Clanwilliam 4.6 -0.4 14.9 122
21Western Cape dams
100
90
80
70
60
Percentage
2014
50 2015
2016
40
2017
2018
30
20
10
0
1 2 3 4 5 6 7 8 9 10 11 12
Months
22Theewaterskloof Dam water levels
120
100
80
Percentage
2014
60 2015
2016
40 2017
2018
20
0
1 2 3 4 5 6 7 8 9 10 11 12
Months
Dams providing water to Greater Cape Town
120
100
80
Percentage
2014
60 2015
2016
40
2017
2018
20
0
1 2 3 4 5 6 7 8 9 10 11 12
Months 2324
Inlet to tunnel at Charmaine 24 May 2017

                                           25
Inlet to tunnel at Charmaine 8 Feb 2018
26Draaiberg Bridge and Vyeboom Irrigation Scheme Pump Station 24 May 2017
27Pumping water into the sump of the Vyeboom irrigation tower: 8 Feb 2018
2829
Historical storage of the major dams of the Western Cape Water System

                1000

                 900                                                 New Berg River Dam increases available storage
                                                                     capacity
                 800               System storage capacity

                 700
Gross storage

                                                                                                                                           29 October
                 600
                                                                                                                                           2007
                 500

                 400

                 300                          Historical system storage

                 200

                 100
                                                                            Inaccessible, poor quality water
                   0
                       01-Oct-00

                                               01-Oct-01

                                                             01-Oct-02

                                                                                 01-Oct-03

                                                                                               01-Oct-04

                                                                                                               01-Oct-05

                                                                                                                           01-Oct-06

                                                                                                                                       01-Oct-07

                                                                                                                                                        01-Oct-08
                                                                                                                                                   30
• Seasonal Weather Outlook
Rainfall outlook for: Mar/Apr/May 2018

                                         33
Conclusion
• The forecasting system indicates above-normal rainfall over the far north-eastern
parts of the country as well as over parts of the interior during late summer (Jan-
Feb-Mar). It is expected that the total rainfall for these areas would rather be more
frequent rainfall events than more intense events. During early autumn (Feb-Mar-
Apr) a similar prediction persists with the notable exception of drier conditions over
a large part of the Northern Cape. Autumn (Mar-Apr-May) does not indicate any
notable direction of seasonal rainfall at this time. However over the Western Cape
there is a great deal of uncertainty by the models.
• Temperatures mimic the rainfall outlook, with warmer temperatures expected
across the country during late spring, but some areas across the interior of the
country are expected to be cooler during early and late summer, likely connected
to increased rainfall conditions.
• It is important to note that even though the models are uncertain about the
rainfall forecast over the Western Cape, the current drought conditions in the
area are expected to deteriorate further for the period Jan-May.
34MJJ Precipitation: May-June-July (MJJ) 2018
35JJA Precipitation: June-July-August (JJA) 2018
36Summary
1. El Nino / Southern Oscillation (ENSO) is expected to remain in an
ENSO-neutral phase during the southern hemisphere winter, persisting
into spring.
2. During early to mid-winter (May-June), the Western Cape (in entirety) as
well as the western half of Northern Cape can look forward to above-
normal rainfall. Towards May-June-July in mid to late winter, this pattern
is projected to persist, albeit with slightly lower confidence levels.
3. For June-July-August (mid to late winter and nearing early spring)
there is a hint of above-normal rainfall for the northernmost provinces,
however it is useful to bear in mind that this portion of southern Africa
receives extremely limited rainfall, delivered by 1 to 3 rain days per
month during the particular seasonal time of year in question.
20 The International Research Institute (IRI) for Climate and Society at Columbia University has upgraded its expectation for
rainfall in SA's drought-stricken Western Cape province. It now sees a higher likelihood for 'above normal' rainfall during
June, July and August.
38
The IRI previously predicted below to near-normal rainfall for the same period.• Day Zero concept
Time line towards possible Day Zero
                     Rain and
Water supply         evaporation     Augmentation of water supply
available                                                                   All impact on time line
                                                                            to Day Zero

Current date
                                                                          Estimated Day Zero at
               Water usage                                                current date with
                                                                          current conditions
The moving of possible Day Zero date due to impacts on water availability can create confusion
with the public and create the perception that the responsible authority is not properly
managing the situation - clear and accurate communication required to inform the public

                                                                                                      40
What happened to Day Zero?
22 January 2018 - Projection of 13.5% dam level = 12 April 7 May 2018 - Projection of 13.5% dam level beyond July 2018,
2018, Weekly drawdown = 1.4%, Agriculture : CCT, 48% : 47% Weekly drawdown = - 0.1%, Agriculture : CCT, 1% : 89%
The level of water in the dams supplying Cape Town will not drop below 13.5% this year if restrictions are adhered to and assuming rainfall similar to last year. Monitoring dam levels
(inflow, evaporation and withdrawals) and managing withdrawals is key to maintaining the integrity of the system and getting through the drought.
Day Zero calculation is based on conservative assumptions of consumption beyond the City’s control, including releases to agriculture, urban demand, evaporation and rainfall. The
projected Day Zero date is based on the previous weeks’ average volume extracted from the system, extrapolated into the future to the intersection point of 13.5% dam level without
adjusting for potential rainfall, reduction in demand etc. Unlike previous years, DWS stopped releases to irrigation boards once allocations were reached late in January onwards thus
dramatically reducing drawdown from the system. Furthermore, a sizeable transfer was made by an adjacent catchment area in February, also reducing the drop in dam level. These two
aspects, as well as a reduction in urban demand led to the Day Zero date moving well beyond the anticipated start of the rainy season in 2018.Contingency plans: Day Zero
• Day Zero to arrive when the combined water storage in the Big 6 dams reach
13.5% - the stage where pumping water from Theewaterskloof and Voëlvlei
Dam start to utilise the water that cannot reach the outlet works
• Day Zero will not arrive suddenly and unexpectedly
• Contingency plans for the critical municipalities are currently being developed
by PDMC
• Town specific plans are being developed, taking the local situation and
conditions into account.
• Day Zero can be avoided if we meet our water demand target (450 MLD) and
CoCT bring their augmentation options on line as planned
42Day Zero water collection
CoCT is expected to implement Phase 2 (Day 0) of it’s drought
emergency plan when combined storage reach 13.5%.
Current planning:
•Approx. 200 Points of Distribution (PODs) strategically located within
the city.
•PODs will be expected to supply 4-million + people with 25 litres per
person per day.
•PODs will have to be operational 24/7 in order to achieve this.
The Provincial Disaster Management Centre (PDMC) has
recommended a system whereby all resources are harnessed to
contribute towards water security (ARN – all resources network)
The ARN will be an augmentation of the POD system and will be
designed to relieve the pressure off the POD system.
© Western Cape Government 2012 | 43© Western Cape Government 2012 | 44
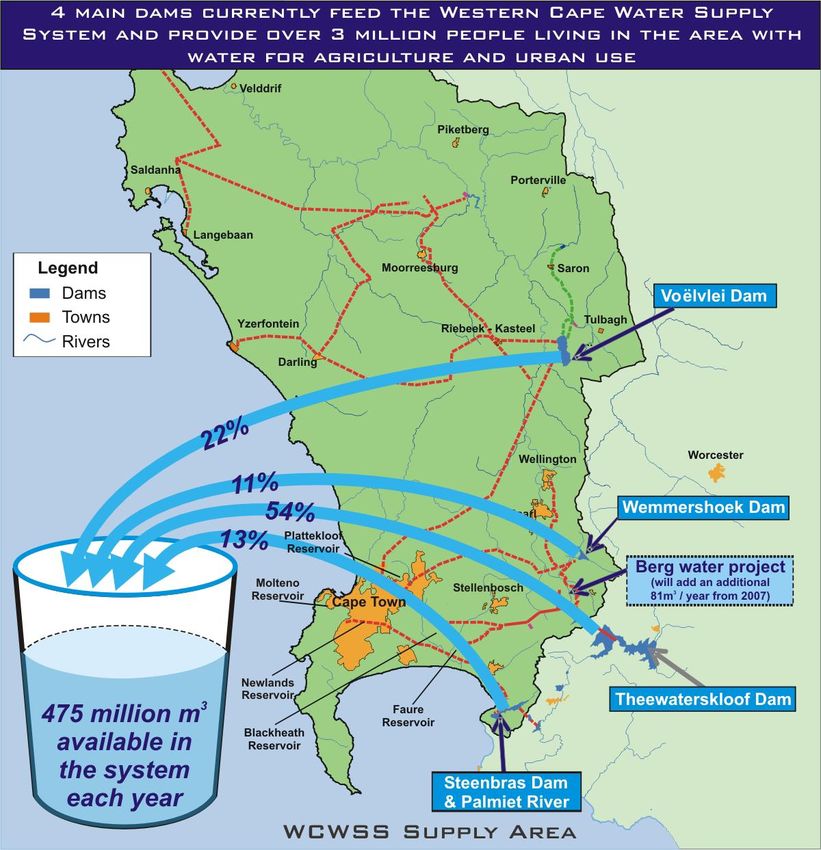
Western Cape Water Supply
         System

   © Western Cape Government 2012 |   45
WC Water Supply System
Yield of system:
Original system 475 Mm3 pa
Bergrivier Dam 81 Mm3 pa
Total 556 Mm3 pa
Yield:
The maximum quantity of
water obtainable on a
sustainable basis from a
dam(s), river or groundwater
source in any hydrological
year (at a certain level of
risk), and under specified
conditions of catchment
development and system
operation.
46© Western Cape Government 2012 | 47
Impact of the drought on
      agriculture

  © Western Cape Government 2012 |   48
Water situation and impact on agriculture
• Dam levels on 19 February 2018 at 22.2% (versus 33.1% in
2017)
• Thus only 67% of the 2017 volume
• Water restrictions for agricultural sector varies between
50% (Breede), 60% (WC Water Supply System) and 87%
(Clanwilliam, Klawer, Vredendal)
• Water supply to Berg River closed on 30 January – very
limited allocated quota fully utilised
• Severe impact on harvest (reduced by between 50% and
75%) in Vredendal area.
• Huge financial impact
• Estimated that +- 50 000 seasonal agri workers only
received very small income or no income at all
• Huge impact on tax income of Government
• Water shortages will have carry through impact on fruit
harvests for the next two or three years
© Western Cape Government 2012 | Economic Impact Assessement of AIAbandoned vineyards
© Western Cape Government 2012 |Abandoned vineyards
© Western Cape Government 2012 |Abandoned vineyards
52
© Western Cape Government 2012 |Current estimated impacts on agriculture
Feb 2018 study (actual 60% water restrictions):
• R5.9 billion GVA decline
• 30 000 job losses
Water situation:
Lack of post-harvest irrigation
If we receive average winter rain it would take 2-3 years for dam
levels to recover to a level where water restrictions can be
lifted/reduced
Orchards removed:
Replanting
Shortage of trees
Time to fruit bearing
Time without income of that orchard, impact on farming enterprises
© Western Cape Government 2012 | 53Economic impact of drought in Western Cape on the agricult
Industry Drop in production GVA shock 2016/17
vs 2017/18 (R
million)
Wine grapes -20.1% -591.2
Table grapes -18.1% -787.4
Vegetables -20.2% -78.7
Grains -36.7% -2 813.0
Total -20.4 - 5 922.4
© Western Cape Government 2012 | 54© Western Cape Government 2012 | 55
FruitLook: Innovative method
     to increase water use
   efficiency in Agriculture

    © Western Cape Government 2012 |   56
Need
Improve efficiency of resource use
National Water Act (1998): “water should be used more efficiently”
Mitigate impacts of climate change
Crop yield (kg)
WUE = Water
consumption (m3)
or
Option 1: Reduce
water consumption Option 2: Increase
without decrease in yield without
yield increasing water
consumption
57
© Western Cape Government 2012 |58 © Western Cape Government 2012 |
© Western Cape Government 2012 | 59
FRUITLOOK IS…
Free... Real...
Satellite derived data...
on growth, water and nitrogen..
every week...
from August to April...
going back to 2010...
For more than 200,000ha of fruit...
 [9.5 million hectares in total in Western Cape…….]

Once off registration & selecting fields...
Via:
                                                      ...SAVING...
Drought support to stock farmers
Provided support to Central Karoo, West Coast,
Kannaland and Witzenberg to date.
Overall
1 969 farmers
situation
124 536 animals (SSU’s)
Source of funding Amount (million)
Reprioritised DoA budget R 66.789
Reprioritised CASP budget R 10.804
Donation AgriSA R 2.5
Allocation NDMC R 40.0
Total R 120.093
Spent to date (8/2/2018) R 105.964
Balance R 14.129
Committed (March vouchers) R 14.129
Balance remaining Nil 61
© Western Cape Government 2012 |Water Augmentation Dept of Local Government: Municipal water situation
© Western Cape Government 2012 | 64
Business Sector Support: Dept of Economic
Development and Tourism
Economic security workstream goal &objectives

Goal: Reduce business
risk and build the water                   Reduce           Implemented
sector to support water                     water           through 7
resilience in the Western                consumption        strategies
Cape economy

    Increase                                             Build the
   businesses’                                             water
                                           ECONOMIC
   own water                                             sector of
                                            SECURITY
     supply                                                 the
  augmentation                                           Province

                                             Prepare
                                            businesses
                                             for Day
                                               Zero
                © Western Cape Government 2012 |                          66
Humanitarian Relief : Dept of Social Services
Summary of most vulnerable sub places

         District               No. of Local           No. of sub.   Total population
                                Municipalities          places

 West Coast                                  5             3              1,815

 Cape                                        5             17            99,272
 Winelands
 Overberg                                    4             4             28,563

 Eden                                        7             22            11,6671

 Central Karoo                               3             8              9,472

 Total                                      24             54            255,793

                    © Western Cape Government 2012 |                                    68
WCG WATER BUSINESS CONTINUITY PLANNING : Dept of Public Works
Deliverables

•       OBJECTIVE: WCG Water BCP focusses on how and which service delivery requirements of the WCG can
        continue to be met when there is constrained or no municipal water in a geographic area i.e. dry taps,
        including WCG effects to contribute to avoiding a dry taps situation arising.

•     Departmental responses required at a Provincial, Functional and Operational level, including water risk
      assessments and mitigations:
    •   Departmental responsibility [planning, identification, assessment, mitigation]
    •   Custodial / implementing agent responsibility [enablement, implementation and delivery]

•       Business continuity plans to be developed, with parallel immediate implementation, in highest risk areas first
        and to be structured across Immediate, Short, Medium and Long terms

•     The Water BCP has two focus areas:
    •   Demand management interventions to reduce water consumption at all WCG facilities in order to
        contribute to avoiding a “dry-taps” scenario in any areas of the Province.
    •   Supply-side interventions to not only reduce municipal water consumption but also to ensure that there are
        essential supplies of drinking water, for hygiene as well as for fire safety purposes in key facilities to secure
        vital facilities.

•       Plans are focussed on WCG critical service delivery areas:
    •      Heath services
    •      Social Development CYCC facilities
    •      Water BCP of departments and entities and securing water secure command and control office facilities
    •      Education

                            © Western Cape Government 2012 |                                                                71
DATE 2017/11/08
Drill rig Consultant Parcel Priority Facility Town Type Water Average Existing Boreholes Tests Aquifer Existing Works 16-Oct 23-Oct 30-Oct 06-Nov 13-Nov 20-Nov 27-Nov 04-Dec 11-Dec 18-Dec 25-Dec 01-Jan 08-Jan 15-Jan 22-Jan 29-Jan 05-Feb 12-Feb 19-Feb
Demand Demand Storage Needed Needed Boreholes
(KL/d) (L/s) (KL)
P&A 1 1 Ladismith town Ladismith 3? H Procure Review Review Review
1 1 Ladismith Hospital Ladismith H 5 0.1 0 WGA 0 I Order Implement *
VELTMAN 2 1 Knysna Hospital Knysna H 66 0.8 30 3 2 TMGA 0 H Site Drill Test Report Buffer Review Review
6 bhs I Design Order Implement *
Drill rig 1
2 2 Outeniqua CYCC (George) George SD 60 0.8 2 1 GA 0 H Site Drill Test Report Buffer Review Review
I Design Order Implement *
2 3 York Str George O 10 0.1 1 1 KGA 0 H Site Drill Test Report Buffer Review Review
I Design Order Implement *
GEOSS 3 1 Vredendal Hospital Vredendal H 11 0.1 50 2 2 0 H Site Drill Test Report Buffer Review Review
Local rig
6 bhs I Design Order Implement *
3 2 Clanwilliam CYCC Clanwilliam SD 60 0.8 2 1 0 H Site Drill Test Report Buffer Review Review
I Design Order Implement *
3 3 Dan de Villiers Beaufort West O 10 0.1 2 1 KA 0? H Site Drill Test Report Buffer Review Review
Local rig
I Design Order Implement *
3 4 Beaufort West Hospital Beaufort West H 34 0.4 60 0 3 KA 3 H Review Review
I Design Order Implement *
PIETERSEN 4 1 Calendon Hospital Calendon H 43 0.5 60 2 2 TMGA 0 H Site Drill Test Report Buffer Review Review
11 bhs I Design Order Implement *
4 2 Worcester Hospital Worcester H 144 1.8 200 3 Alluvium
2 / Enon / Granite
0 H Site Drill Test Report Buffer Review Review
I Design Order Implement *
4 3 Brewelskloof Hospital Worcester H 143 1.8 - 3 2 Fault 1 H Site Drill Test Report Buffer Review Review
I Design Order Implement *
4 4 Paarl Hospital Site 1 Paarl H 90 1.1 - 1 1 MA 1 H Site Drill Test Report Review Review
I Design Order Implement *
4 5 Paarl Hospital Site 2 - DSD CYCC Paarl
Drill rig 2
4 6 Cape Teaching and Leadership Institute Cape Town ED 60 0.8 2 3 CFA 2 H Drill Test Report Buffer Review Review
I Design Order Implement *
GEOSS 5 1 Stellenbosch Hospital Stellenbosch H 35 0.4 20 2 2 Alluvium / MA 0 H Site Drill Test Report Buffer Review
8 bhs I Design Order Implement *
5 2 De Novo Treatment Centre (Kraaifontein) Cape Town SD 60 0.8 2 1 MA 0 H Site Drill Test Report Buffer Review
I Design Order Implement *
5 3 Lindelani Place of Safety (Stellenbosch) Cape Town SD 60 0.8 2 1 0 H Site Drill Test Report Buffer Review
I Design Order Implement *
5 4 Elsenburg Stellenosch AG 120 1.5 3 2 MA ? H Drill Test Report Review
I Design Order Order Implement *
DELTA-H 6 1 Lentegeur Laundry Cape Town H 360 4.5 750 2 4 CFA 8 H Site Drill TestReport Buffer Review Review
10 bhs I Design Order Implement *
6 2 Horizon Youth Care Centre (Faure) Cape Town SD 60 0.8 2 1 0 H Site Drill Test Report Buffer Review Review
I Design Order Implement *
Drill rig 3
6 3 Metro South (Wynberg) Cape Town SD 60 0.8 2 1 0 H Site Drill Test Report Buffer Review Review
I Design Order Implement *
6 4 Somerset Hospital Cape Town H 177 2.2 130 2 2 MA 0 H Site Drill Test Report Buffer Review Review
I Design Order Implement *
6 5 Sivuyile Residential Facility (Stikland Hospital)
Cape Town SD 60 0.8 2 2 H Review Review
I Design Order Implement *
SRK 7 1 Tygerberg Hospital Cape Town H 1312 16.6 2500 7 3 CFA / MA 2 H Site Drill Test Report Buffer Review Review
12 bhs I Design Order Implement *
7 2 Green Building & Karl Bremer Cape Town O/H 15 2.4 95 1 3 2 H Site Drill Test Report Buffer Review
Drill rig 4
I Design Order Implement *
7 3 Vredelus House (Goodwood) Cape Town SD 60 0.8 2 1 0 H Site Drill Test Report Buffer Review
I Design Order Implement *
7 4 Metro North (Goldburn House) (Goodwood)
Cape Town SD 30 0.4 2 1 0 H Site Drill Test Report Buffer Review
I Design Order Implement *
Umvoto 8 1 Groote Schuur Hospital Cape Town H 780 9.8 3500 7 4 MA 0 H Site Drill Test Report Buffer Review Review
Africa I Design Order Implement *
13 bhs 8 2 Red Cross Children's Hospital Cape Town H 152 1.9 160 3 3 TMGA 1 H Site Drill Test Report Buffer Review
I Design Order Implement *
8 3 Mowbray Maternity Hospital Cape Town H 47 0.6 70 3 2 MA 0 H Site Drill Test Report Buffer Review
I Design Order Implement *
© Western Cape Government 2012 | 72City of Cape Town
Water demand management

                                            Level 6B restrictions
                                            in place as from 1
                                            February 2018

                                            Reduce demand to
                                            450 MLD

                                            50 l/p/d

         © Western Cape Government 2012 |                           74
Augmentation options
Temporary desalination (16 MLD):
Strandfontein, 7 MLD, on track, first water May, full production in July 2018
Monwabisi, 7 MLD, on track, first water May, full production in July 2018
V&A, 2 MLD, on track, first water May, full production in July 2018
Groundwater abstraction (peak at 150 MLD):
Cape Flats aquifer, on track, 80 MLD by May/June
Atlantis aquifer, on track, 5 MLD already into system, add 20 MLD May to Oct 2018
TMG aquifer, pilot drilling on track, 40MLD, ramping up from Feb 2018 to June 2019
Springs (4 MLD):
Newlands (Albion) 3 MLD and Oranjezicht 1 MLD in operation
Water reuse:
Zandvliet, 10 MLD on track for June 2018, increasing to 50 MLD in Dec 2021
Cape Flats, 10 MLD by June 2018, 75 MLD by Dec 2021
Macassar, 20 MLD by June 2019
Postdam, 10 MLD by June 2019
Athlone, 75 MLD by Dec 2021
Water transfer:
Palmiet to Steenbras Dam 10 million m3 to start soon
© Western Cape Government 2012 | 75Water supply cost (R/kilolitre)
© Western Cape Government 2012 | 76Actual vs Targeted water useage
Water allocations from WC Water Supply System

Urban use:
Greater Cape Town and includes Stellenbosch (partly), Drakenstein
(partly) and the West Coast towns of Malmesbury, Darling,
Moorreesburg, Yzerfontein, Langebaan, Saldanha, Vredenburg and
Velddrif

400 million m3 per annum (70% share)

Agriculture:
Berg River and Riversonderend (river systems) and pipe line systems
(Water users associations), Stellenbosch (Wynland) and Villiersdorp
(Vyeboom)
Grabouw (Groenland) also part of the system, own resources but they
impact on transfers from Palmiet to Steenbras Dam

170 million m3 per annum (30% share)

              © Western Cape Government 2012 |                        78
Demand management through DWS restrictions
3000
Daily consumption MLD
2500
2000 1028
983
737 846
1500 254 451
136
1000 1218 55 28
1100 1100 28 27 27
1010 1039 917
979 884
500 856 821 764 794
284 329 368 361 275 184 201
0 125 77 83 94 136
May-18
Nov-17
Dec-17
Feb-18
Jan-18
Jun-18
Apr-18
Jul-18
Oct-18
Mar-18
Aug-18
Sep-18
Evaporation - Maximum Urban (DWS average of last 5 years) Agriculture unrestricted
RESTRICT TO
3000
Daily consumption MLD
2500
2000
1500
393 411
1000 102 295 339
670 181 55
605 605 22 11
500 556 571 538 11 11 11
486 504
471 452 420 437
284 329 368 361 275 184 201
0 125 77 83 94 136
Feb-18
May-18
Jan-18
Jun-18
Apr-18
Jul-18
Oct-18
Nov-17
Dec-17
Aug-18
Sep-18
Mar-18
Evaporation - Maximum 45% restricted Urban Agriculture 60% restrictedDemand management: Both the City, other urban and agriculture
must adhere to the restrictions imposed on the system
Current
savings:
40%
(Target 45%)
Prelim scenario
(mid-March 2018)
Anticipated
savings >45%For Cape Town, this means that demand must be
managed down to get below 450 Ml/day
While Cape Town has significantly reduced its demand (measured here as production from the treatment works),
from a peak of 1200 Ml/day in 2015 down to nearly 500 Ml/day, a further reduction in demand is needed to below
450 Ml/day immediately due to not meeting the 500 Ml/day target since July 2017
Demand reduction is saving
400 Ml/day
Feb 2017 = 900 Ml/day
Feb 2018 = 500 Ml/day
Further measures are being put in place to reduce demand, including:
• punitive drought tariffs
• demand management devices & flow restrictors
• more aggressive pressure managementNew water supplies are important for water security going forward but these will have
little impact this summer.
70.0%
60.0%
Impact of Rainfall
Impact of Rainfall
50.0%
Urban restriction very
important
40.0%
30.0%
20.0%
10.0%
But are very important for 2019
if winter rainfall is low
0.0%
JUN-18
JUN-19
DEC-18
M AY - 1 8
NOV-18
M AY - 1 9
NOV-19
FEB-18
JUL-18
SEP-18
OCT-18
FEB-19
JUL-19
SEP-19
OCT-19
M AR -1 8
M AR -1 9
AP R - 1 8
AP R - 1 9
J AN - 1 8
J AN - 1 9
AU G - 1 8
AU G - 1 9
Restricted, 100% 2017 600MLD, 100% 2017 Restricted, No Augmentation
Restricted, 75% rain Restricted, 150% rain• Impacts of Climate Change
USING DOWNSCALED SCENARIOS TO MODEL THE
FINANCIAL VULNERABILITY OF FARMING SYSTEMS TO
CLIMATE CHANGE

Peter Johnston1, Hamman Oosthuizen2, Daan Louw2
& Roland Schulze3
1University   of Cape Town   2   University of Stellenbosch 3 University of KZN

September 2015
Aim of the study
The development of a conceptual framework
  to investigate the financial vulnerability of
    different farming systems to projected
                climate change

  (To develop a dynamic model that links climatology,
hydrology, crop physiology and economics at farm level –
           in this case COMMERCIAL Farmers)
4 case study areas
Citrus/Mangoes
Irrigated
Maize, Soya
Dry Land
Grapes
Irrigated
Wheat Dry
LandReport can be downloaded from the WRC web site on the
link below:
http://www.wrc.org.za/Knowledge%20Hub%20Documents/Research%20R
eports/1882-1-16.pdf
87• Take home message
90
Come gather ‘round people wherever you roam
And admit that the waters around you have
   grown
And accept it that soon you’ll be drenched to
   the bone.
If your time to you is worth savin’
Then you better start swimmin’ or you’ll sink
   like a stone
For the times they are a-changin’

Bob Dylan
                                           91
Thank You
Contact Us

             André Roux Pr Eng
             Drought and Water Specialist

             Tel: +27 (0) 21 483 6413   Fax: +27 (0) 82 907 1127
             andrer@elsenburg.com
             www.westerncape.gov.za
You can also read