Bloomberg Drybulk Webinar - April 2021 - Eagle Bulk Shipping Inc.
←
→
Page content transcription
If your browser does not render page correctly, please read the page content below
providing optimized global transportation
of drybulk commodities

                                  Bloomberg Drybulk Webinar
                                            April 2021
Disclaimer
This presentation contains certain statements that may be deemed to be “forward-looking statements” within the meaning of Section 27A of the Securities Act of
1933, as amended, Section 21E of the Securities Exchange Act of 1934, as amended, and the Private Securities Litigation Reform Act of 1995, and are intended
to be covered by the safe harbor provided for under these sections. These statements may include words such as “believe,” “estimate,” “project,” “intend,”
“expect,” “plan,” “anticipate,” and similar expressions in connection with any discussion of the timing or nature of future operating or financial performance or other
events. Forward-looking statements reflect management’s current expectations and observations with respect to future events and financial performance. Where
we express an expectation or belief as to future events or results, such expectation or belief is expressed in good faith and believed to have a reasonable basis.
However, our forward-looking statements are subject to risks, uncertainties, and other factors, which could cause actual results to differ materially from future
results expressed, projected, or implied by those forward-looking statements.

Where we express an expectation or belief as to future events or results, such expectation or belief is expressed in good faith and believed to have a reasonable
basis. However, our forward-looking statements are subject to risks, uncertainties, and other factors, which could cause actual results to differ materially from
future results expressed, projected or implied by those forward-looking statements. The principal factors that affect our financial position, results of operations and
cash flows include charter market rates, which have declined significantly from historic highs, periods of charter hire, vessel operating expenses and voyage costs,
which are incurred primarily in U.S. dollars, depreciation expenses, which are a function of the purchase price of our vessels and our vessels’ estimated useful
lives and scrap value, general and administrative expenses, and financing costs related to our indebtedness. The accuracy of the Company’s assumptions,
expectations, beliefs and projections depends on events or conditions that change over time and are thus susceptible to change based on actual experience, new
developments and known and unknown risks. The Company gives no assurance that the forward-looking statements will prove to be correct and does not
undertake any duty to update them. Our actual results may differ materially from those anticipated in these forward-looking statements as a result of certain
factors which could include the following: (i) changes in demand in the drybulk market, including, without limitation, changes in production of, or demand for,
commodities and bulk cargoes, generally or in particular regions; (ii) greater than anticipated levels of drybulk vessel newbuilding orders or lower than anticipated
rates of drybulk vessel scrapping; (iii) changes in rules and regulations applicable to the drybulk industry, including, without limitation, legislation adopted by
international bodies or organizations such as the International Maritime Organization and the European Union (the “EU”) or by individual countries; (iv) actions
taken by regulatory authorities including without limitation the U.S. Treasury Department’s Office of Foreign Assets Control (“OFAC”); (v) changes in trading
patterns significantly impacting overall drybulk tonnage requirements; (vi) changes in the typical seasonal variations in drybulk charter rates; (vii) changes in the
cost of other modes of bulk commodity transportation; (viii) changes in general domestic and international political conditions; (ix) changes in the condition of the
Company’s vessels or applicable maintenance or regulatory standards (which may affect, among other things, our anticipated dry docking costs); (x) significant
deterioration in charter hire rates from current levels or the inability of the Company to achieve its cost-cutting measures; (xi) the duration and impact of the novel
coronavirus (“COVID-19”) pandemic; (xii) the relative cost and availability of low and high sulfur fuel oil; (xiii) our ability to realize the economic benefits or recover
the cost of the scrubbers we have installed; and (xiv) any legal proceedings which we may be involved from time to time; and other factors listed from time to time
in our filings with the Securities and Exchange Commission (the “Commission”).

We have based these statements on assumptions and analyses formed by applying our experience and perception of historical trends, current conditions,
expected future developments and other factors we believe are appropriate in the circumstances. The Company’s future results may be impacted by adverse
economic conditions, such as inflation, deflation, or lack of liquidity in the capital markets, that may negatively affect it or parties with whom it does business.
Should one or more of the foregoing risks or uncertainties materialize in a way that negatively impacts the Company, or should the Company’s underlying
assumptions prove incorrect, the Company’s actual results may vary materially from those anticipated in its forward-looking statements, and its business, financial
condition and results of operations could be materially and adversely affected.

                                                                                                                                                                              2
Over 90% of Global Trade is Via the Seas

                                                                                       44%

                     33%                                                                                                                   16%

                                                                DRYBULK
          TANKER                           Involves the carriage of bulk commodities                                       CONTAINER
 Involves the carriage of liquid                    such as grain and coal.                                        Involves the carriage of
  products such as crude oil,                Represents approximately 54% of total                              containerized cargoes such as
   gasoline, chemicals, and                 seaborne trade, equating to over 5 billion                            machinery, televisions and
          natural gas.                     tons per year or 70,000 voyages per year.                                       furniture.

                                                Major Bulk                     Minor Bulk
                                                    ~60%                           ~40%

                      ▪ Source: OECD, Clarksons. Percentages are approximate and represent the three main segments’ share of total trade in metric tons. Other
                        specialty trade segments are not shown.                                                                                                  3
Drybulk Trade Totals ~5.3b Tons per Year
Major Bulk commodities represent ~60% of total drybulk trade

         IRON ORE (29%)                                              COAL (24%)                                                     GRAIN (9%)

Minor Bulk commodities represent ~40% of total drybulk trade

                                                                     FOREST
         STEEL (7%)                                                  PRODUCTS (7%)                                                  FERTILIZER (3%)

         BAUXITE (2%)                                                CEMENT (3%)                                                    SCRAP (2%)

         PETCOKE (1%)                                                SUGAR (1%)                                                     SALT (1%)
                                   MAJOR BULKS
         60% of Drybulk trade consists of the three “Major Bulk” commodities
                ▪ Only selected Minor Bulk cargoes depicted. Cargo percentages represent 5-year historical averages of total drybulk trade
                ▪ Source: Clarksons (March 2021)                                                                                                 4
What Differentiates Eagle
Eagle Bulk is a fully-integrated
shipowner-operator engaged
in the global transportation of
drybulk commodities

▪ Exclusive focus on the midsize                                                                 Copenhagen
  Supramax/Ultramax vessel
  segment: 52 owned vessels, of                                 Stamford
  which 45 are scrubber-fitted

▪ Employs an active management
  approach to fleet trading and
 perform all management services                                                                                                             Singapore
 in-house

▪ Industry-leading corporate governance
  structure and ESG focus with no
  related-party business / operational
  dealings; majority independent Board
                                                                                                                : EGLE

                  Our vision is to be the leading shipowner-operator through
                     consistent outperformance and sustainable growth
                        ▪ Eagle fleet count as of March 26, 2021, including all pending sale and purchase transactions. Please refer to the “Owned Fleet” slide in the
                          appendix for further details.                                                                                                                  5
Significantly Improving Fleet Makeup
                     Fleet Age Profile                                                                           Fleet Count + Vessel Size Evolution
▪ 52 ships in fleet inclusive of pending acquisitions                                                            54                                                                   61.0
                                                                                                                                                                                      60.0
▪ Average age ~8.8yrs old                                                                                        52

                                                                                                                                                                                             Average DWT per Ship (MT,
                                                                                                                                                                                      59.0
                                                                                                                 50
                                                                                                                                                                                      58.0

                                                                                                   Fleet Count

                                                                                                                                                                                                    thousands)
                                                                                                                 48                                                                   57.0
                                                                                                                 46                                                                   56.0
                                              4                                                                  44                                                                   55.0
                                                                                                                                                                                      54.0
                                                                                                                 42
                                                                                                                                                                                      53.0
                                                                                                                 40                                                                   52.0
                                                                                                                 38                                                                   51.0

                                                                                                                                     Fleet Count          Average DWT

                           10
                                                                                                                 Fuel Consumption per DWT per Day
                                                                              13
                                                                                                 0.62
                                             16
                                                                                                 0.60

               12                                                                                0.58

                                                                                                 0.56

                                                                                                 0.54
                           6
    5                                                                                            0.52
                                                                              3
                                                              2                                  0.50

    15

    Fleet   Vessels Acquired        Vessels Sold         Acquisition Pending                                          Avg Fuel Consumption per DWT per Sailing Day (Tons)

                               ▪ Eagle fleet count as of March 26, 2021, including all pending sale and purchase transactions. Please refer to the “Owned Fleet” slide in the appendix for further
                                 details. Fleet Age Profile chart depicts current age of sold vessels. Fleet renewal/growth commenced in April 2016                                                                      6
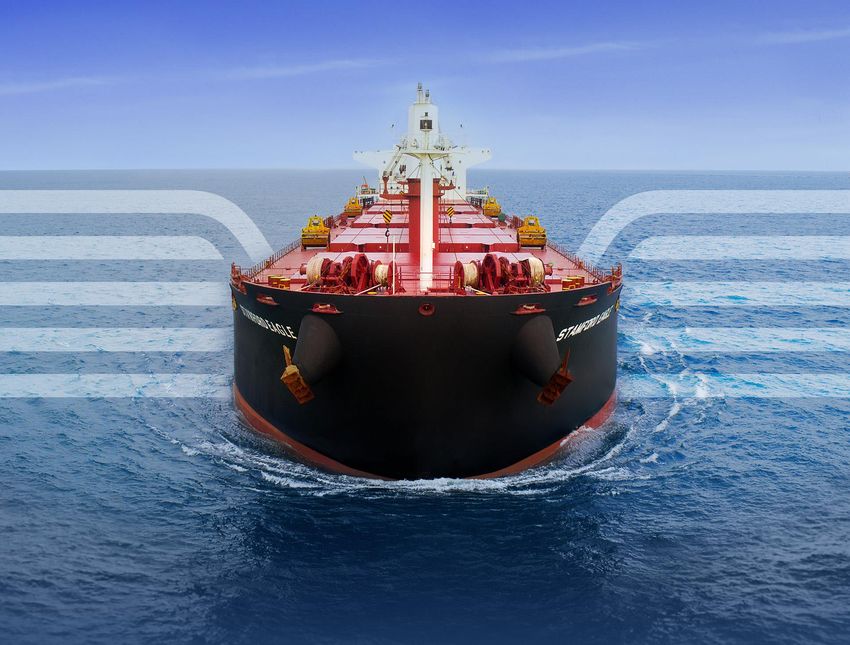
Creating Value Through Active Management
 Eagle’s sophisticated in-house
 commercial platform has a
 proven track record

              ▪ Please see the appendix for further descriptions of Eagle’s commercial strategies
                                                                                                    7
Spot Rates at a 10yr High
                                 Baltic Supramax Index (BSI)*
                                                                                                                        Annual Averages
                                                                                                                        2018             $11,487
$30,000
                                                                                                                        2019              $9,948

                                                                                                                        2020              $8,189

$25,000
                                                                                                                     2021 YTD            $16,618

$20,000

$15,000
                                                                                                                                          $15,127

$10,000

 $5,000

    $0

                                               BSI (Actual)            25 year average

          ▪ Source(s): Clarksons
          ▪ Supramax Spot is based on the BSI-58. Historical averages are based on BSI-58 (Aug-15 to present), BSI-52 (Jul-05 to Jul-15), Supramax
            52k dwt Avg Trip Rate (Dec-01 to Jul-05), and the Handymax 45k dwt. Avg Trip Rate (prior to Dec-01).
                                                                                                                                                     8
Spot Rates at a 10yr High
                                 Baltic Supramax Index (BSI)*
                                                      Starting point of prior chart                                      Annual Averages
$70,000
                                                                                                                        2018              $11,487

                                                                                                                        2019              $9,948
$60,000                                                                                                                 2020              $8,189

                                                                                                                     2021 YTD             $16,618

$50,000

$40,000

$30,000

$20,000

                                                                                                                                               $15,127
$10,000

    $0

                                               BSI (Actual)            25 year average

          ▪ Source(s): Clarksons
          ▪ Supramax Spot is based on the BSI-58. Historical averages are based on BSI-58 (Aug-15 to present), BSI-52 (Jul-05 to Jul-15), Supramax
            52k dwt Avg Trip Rate (Dec-01 to Jul-05), and the Handymax 45k dwt. Avg Trip Rate (prior to Dec-01).
                                                                                                                                                         9
Drybulk Demand Correlated to Global GDP Growth
                                     Drybulk Trade (ton-miles) vs. Global GDP

                                                                                                                                     Shaded area
13.0%                                                                                                                             represents range of
                                                                                                                                   GDP forecasts for
                                                                                                                                      2021-2022

11.0%

 9.0%

 7.0%

 5.0%

 3.0%

 1.0%

-1.0%

-3.0%

-5.0%
        2005   2006   2007    2008     2009     2010     2011     2012     2013     2014     2015   2016   2017   2018   2019   2020f   2021f   2022f

                                                                 Drybulk Trade          GDP (IMF)

                             ▪ Source(s): Clarksons (March 2021), IMF (January 2021), Bloomberg
                                                                                                                                                        10
Strong Demand Recovery Expected in 2021
Annualized Growth Rates EGLE Cargo Mix (FY 2020)
3-yr avg Last Current
2017-19 2020 2021f Forest Products, 0.2%
Agriculture Products, 4%
Global GDP 3.4% -3.5% 5.5% Fertilizer, 5% Coal, 16%
China 6.3% 2.3% 8.1%
Coke, 9%
India 5.8% -8.0% 11.5%
Dry Bulk (all) 2.3% -1.6% 3.3%
Iron Ore 0.9% 3.2% 2.7% Grain, 10%
Coal 4.1% -9.4% 4.5%
Cement, 10%
Grains 2.1% 6.9% 2.3%
Minor Bulks 2.6% -2.2% 3.4%
Iron Ore, 7%
Steel
Products, 8% Other, 1%
Minerals, 16%
Metal & Ore,
14%
Minor Bulks ~68% Major Bulks ~32%
▪ Source(s): Clarksons (March 2021)
▪ Cargoes loaded during the 12 months ended December 31, 2020.
▪ Metal & Ore group includes: Manganese ore, scrap, copper concentrate, bauxite. Minerals group includes: Salt, gypsum, feldspar, limestone
11Supramax/Ultramax 2021f Net Fleet Growth ~2.2%
Drybulk Deliveries + Scrapping (DWT)
100 Net Fleet Growth
Supramax /
Drybulk
Ultramax
80 2020 3.7% 3.6%
2021f 2.6% 2.2%
2022f 0.9% 1.6%
60
40
20
0
-20
-40
2006 2007 2008 2009 2010 2011 2012 2013 2014 2015 2016 2017 2018 2019 2020 2021f 2022f
Total Deliveries Total Demolition Drybulk Net Supply Supramax/Ultramax Net Supply
▪ Figures are in million DWT
▪ Source(s): Clarksons (March 2021) 12IMO 2020 and Fuel Spread Development
Fuel Prices (USD per MT)
$800
$700
For 2020, Eagle was able to realize a total fuel spread of ~$150/MT,
comprised of average market fuel spread of ~$100/MT plus ~$50/MT
generated from spread hedges put on prior to the outbreak of COVID-19.
$600
VLSFO
$500
$400
HSFO
$300
$200
IMO 2020
$100
Implementation Date
$0
Oct-19 Nov-19 Dec-19 Jan-20 Feb-20 Mar-20 Apr-20 May-20 Jun-20 Jul-20 Aug-20 Sep-20 Oct-20 Nov-20 Dec-20 Jan-21 Feb-21 Mar-21
Market Fuel Spread Eagle Hedge Value HSFO VLSFO
▪ Source: Clarksons. VLSFO and HSFO average of historical prices at Fujairah, Houston, Rotterdam, and Singapore.
13Uniquely Positioned to Capitalize on the Market
Vessel Segment: SUPRAMAX / ULTRAMAX
Business Model: OWNER-OPERATOR + INHOUSE MGMT.
Operating Scale: 52 SHIPS OWNED + TC-IN FLEET
IMO 2020: 87% OF THE FLEET SCRUBBER-FITTED
Balance Sheet: WELL-CAPITALIZED
Corporate Governance: MAJORITY INDEPENDENT BOARD
Management Team: PROVEN TRACK RECORD
Superior performance and results
▪ Eagle fleet count as of Mar 26, 2021, including all pending sale and purchase transactions. Please refer to the “Owned Fleet” slide in the
appendix for further details. 14APPENDIX
Owned Fleet
                                  52 Vessels        | 45 Scrubber-fitted           | 3114 DWT (MT, thousands) | 8.8 yrs-old
               Eagle Bulk Shipco LLC                                         Eagle Bulk Ultraco LLC                                   Eagle Bulk Holdco LLC
       Vessel          Scrubber     Built       DWT                Vessel            Scrubber      Built          DWT          Vessel         Scrubber   Built     DWT
 1 Singapore Eagle         *           2017        63.4       1 Hong Kong Eagle          *           2016          63.5   1 Rotterdam Eagle       *         2017    63.7
 2 Shanghai Eagle         *            2016        63.4       2 Santos Eagle              *          2015          63.5   2 Helsinki Eagle       *          2015    63.6
 3 Oslo Eagle             *            2015        63.7       3 Copenhagen Eagle          *          2015          63.5
 4 Stamford Eagle                      2016        61.5       4 Sydney Eagle              *          2015          63.5   2 Vessels                                 127
 5 Sandpiper Bulker       *            2011        57.8       5 Dublin Eagle              *          2015          63.5
 6 Roadrunner Bulker      *            2011        57.8       6 New London Eagle          *          2015          63.1
 7 Puffin Bulker          *            2011        57.8       7 Cape Town Eagle           *          2015          63.7
 8 Petrel Bulker          *            2011        57.8       8 Westport Eagle            *          2015          63.3
 9 Owl                    *            2011        57.8       9 Hamburg Eagle             *          2014          63.3
10 Oriole                 *            2011        57.8      10 Madison Eagle             *          2013          63.3
11 Egret Bulker           *            2010        57.8      11 Greenwich Eagle           *          2013          63.3
12 Crane                  *            2010        57.8      12 Groton Eagle              *          2013          63.3
13 Canary                 *            2009        57.8      13 Fairfield Eagle           *          2013          63.3                Acquistion Vessels
14 Bittern                *            2009        57.8      14 Southport Eagle           *          2013          63.3        Vessel         Scrubber   Built     DWT
15 Stellar Eagle          *            2009        56.0      15 Rowayton Eagle            *          2013          63.3   1 Stockholm Eagle       *         2016    63.3
16 Crested Eagle          *            2009        56.0      16 Mystic Eagle              *          2013          63.3   2 Montauk Eagle                   2011    57.8
17 Crowned Eagle          *            2008        55.9      17 Stonington Eagle          *          2012          63.3   3 Newport Eagle                   2011    57.8
18 Jaeger                              2004        52.5      18 Nighthawk                 *          2011          57.8   4 Sankaty Eagle                   2011    57.8
19 Cardinal                            2004        55.4      19 Martin                    *          2010          57.8
20 Tern                                2003        50.2      20 Kingfisher                *          2010          57.8
                                                             21 Jay                       *          2010          57.8
                                                             22 Ibis Bulker               *          2010          57.8
                                                             23 Grebe Bulker              *          2010          57.8
                                                             24 Gannet Bulker             *          2010          57.8
                                                             25 Imperial Eagle            *          2010          56.0
                                                             26 Golden Eagle              *          2010          56.0
20 Vessels                                       1,156       26 Vessels                                           1,594   4 Vessels                                 237

                                  ▪ Eagle fleet count as of March 26, 2021, including all pending acquisitions.
                                                                                                                                                                         16
Eagle Commercial Strategies
Strategy Description
The most basic method of employing a vessel, Timecharter-out involves leasing out a ship for
Timecharter-out an agreed period of time at a set USD per day rate. The shipowner-operator essentially hands
over commercial management to the charterer who performs the voyage(s). The length of
timecharters can range from as short as one voyage (approximately 20-40 days) to multiple
years.
This involves the employment of a vessel to carry cargo from one port to another based on a
Voyage Chartering USD per ton rate. In contrast to a Timecharter-out strategy, in a Voyage Charter, the
shipowner-operator maintains control of the commercial operation and is responsible for
managing the voyage, including vessel scheduling and routing, and for any related costs such
as fuel, port expenses, etc. Having the ability to control and manage the voyage, the
shipowner-operator is able to generate increased margin through operational efficiencies,
business intelligence and scale. Additionally, contracting to carry cargoes on voyage terms
often gives the shipowner-operator the ability to utilize a wide range of vessels to perform the
contract (as long as the vessel meets the contractual parameters), thereby giving significant
operational flexibility to the fleet. Vessels used to perform this type of business may include not
only ships owned by the company, but also third-party ships which can be timechartered-in on
an opportunistic basis (the inverse of a Timecharter-out Strategy).
With this strategy, the shipowner-operator contracts to carry a cargo on voyage terms (as
Vessel + Cargo described in Voyage Chartering) with a specific ship earmarked to cover the commitment. As
Arbitrage the date of cargo loading approaches, the shipowner-operator may elect to substitute a different
vessel to perform the voyage, while securing alternate employment for the ship that was initially
earmarked for the voyage. Taken as a whole, this strategy can generate increased revenues,
on a risk-managed basis, as compared to the initial cargo commitment.
17Eagle Commercial Strategies
Strategy Description
This strategy involves leasing a vessel from a third-party shipowner at a set USD per day rate.
Timecharter-in As referenced above, vessels can be timechartered-in to cover existing cargo commitments, or
to effect Vessel+Cargo Arbitrage. These ships may be chartered-in for periods longer than
required for the initial cargo or can be chartered-in opportunistically in order to benefit from rate
dislocations and risk-managed exposure to the market overall.
Forward Freight Agreements (“FFAs”) are cleared financial instruments, which can be used to
Hedging (FFAs) hedge market rate exposure by locking in a fixed rate against the eventual forward market.
FFAs are an important tool to manage market risk associated with the time chartering-in of third
party vessels. FFAs can also be used to lock in revenue streams on owned vessels or against
forward cargo commitments the company may have entered into.
This is a blended strategy approach that uses a combination of timecharters, cargo
Asymmetric Optionality commitments, and FFAs in order to hedge market exposure, while maintaining upside
optionality to positive market volatility. For example, in a scenario where a ship may be
timechartered-in for one year with an option for an additional year, Eagle, dependent on market
conditions, could sell an FFA for the firm 1-year period commitment (essentially eliminating
exposure to the market), while maintaining full upside on rate developments for the optional
year.
18Definitions
Item Description
Adjusted EBITDA is a non-GAAP financial measure that is used as a supplemental financial measure by our management and
by external users of our financial statements, such as investors, commercial banks and others, to assess our operating
Adjusted EBITDA
performance as compared to that of other companies in our industry, without regard to financing methods, capital structure or
historical costs basis. Our Adjusted EBITDA should not be considered an alternative to net income/(loss), operating
income/(loss), cash flows provided by/(used in) operating activities or any other measure of financial performance or liquidity
presented in accordance with U.S. GAAP. Our Adjusted EBITDA may not be comparable to similarly titled measures of another
company because all companies may not calculate Adjusted EBITDA in the same manner. Adjusted EBITDA represents
EBITDA adjusted to exclude the items which represent certain non-cash, one-time and other items such as vessel impairment,
lease impairment, gain/(loss) on sale of vessels, stock-based compensation, loss on debt extinguishment and restructuring
expenses that the Company believes are not indicative of the ongoing performance of its core operations.
Time charter equivalent ("TCE") is a non-GAAP financial measure that is commonly used in the shipping industry primarily to
TCE compare daily earnings generated by vessels on time charters with daily earnings generated by vessels on voyage charters,
because charter hire rates for vessels on voyage charters are generally not expressed in per-day amounts while charter hire
rates for vessels on time charters generally are expressed in such amounts. The Company defines TCE as shipping revenues
less voyage expenses and charter hire expenses, adjusted for the impact of one legacy time charter and realized gains on
FFAs and bunker swaps, divided by the number of owned available days. TCE provides additional meaningful information in
conjunction with shipping revenues, the most directly comparable GAAP measure, because it assists Company management in
making decisions regarding the deployment and use of its vessels and in evaluating their financial performance. The
Company's calculation of TCE may not be comparable to that reported by other companies. The Company calculates relative
performance by comparing TCE against the Baltic Supramax Index ("BSI") adjusted for commissions and fleet makeup. The
BSI was initiated in 2006 based on the Tess 52 design. The index for the Tess 58 design has been published commencing on
April 3, 2017, and transition was completed as of December 2018, when the Baltic stopped publishing a dynamic Tess 52 daily
rate. The Company has now switched to the Tess 58 index for valuation modeling as of January 1, 2019. The change in the
BSI may affect comparability of our TCE against BSI in periods prior to Company switching to the Tess 58 index.
Owned available days is the aggregate number of days in a period during which each vessel in our fleet has been owned by us
less the aggregate number of days that our vessels are off-hire due to vessel familiarization upon acquisition, repairs, vessel
upgrades or special surveys. The shipping industry uses available days to measure the number of days in a period during
which vessels should be capable of generating revenues.
19www.eagleships.com
You can also read