HALF YEAR RESULTS 2021 - A digital workforce for every enterprise - 17th June 2021 - Blue Prism Investor Relations
←
→
Page content transcription
If your browser does not render page correctly, please read the page content below

A digital workforce for every enterprise

 HALF YEAR RESULTS
 2021
 17th June 2021

Commercial in Confidence
OUR VISION

                               A DIGITAL WORKFORCE
                               FOR EVERY ENTERPRISE

2   Commercial in Confidence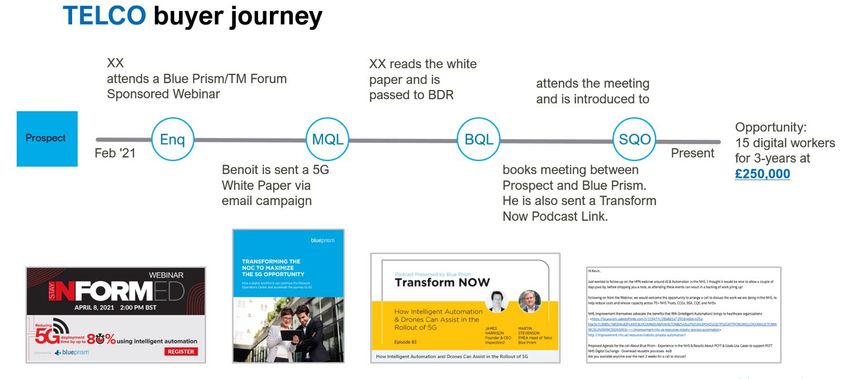
Building a global
    software company

          >2,000
          CUSTOMERS
                                     ● On track for cash break even
                                                                                                                                      BOOKINGS GROWTH ACCELERATING
           65%
           GROWTH IN BLUE PRISM
                                     ● 98% recurring revenue
                                     ● Top 50 customers $1.5m ARR                                                                                                 +35% (39% ex FX)

           CLOUD (NEW BOOKINGS)
                                     ● Commitment to innovation
                                                                                                                                                         +11%               97.8
                                         ● Building deep relationships with
                                           customers
           £311m                     ● Gartner: Moved Blue Prism from 4th
                                       to 3rd place in the RPA market*
                                                                                                                                                  65.1
                                                                                                                                                                72.5

           REMAINING PERFORMANCE
           OBLIGATIONS               ● IDC placed Blue Prism 2nd place
                                       2020 for growth**

           98%                       ● Awards for innovation, customer
                                       choice and technology for pandemic                                                                         H119          H120        H121

           GROSS REVENUE RETENTION
                                      *2021 Gartner Market Share Analysis: Robotic Process Automation
                                      ** IDC Semiannual Software Tracker, 2H 2020
                                      The GARTNER PEER INSIGHTS CUSTOMERS’ CHOICE badge is a trademark and service mark of Gartner,
                                      Inc. and/or its affiliates and is used herein with permission. All rights reserved. Gartner Peer Insights
                                      Customers’ Choice constitute the subjective opinions of individual end-user reviews, ratings, and data
3   Commercial in Confidence          applied against a documented methodology; they neither represent the views of, nor constitute an
                                      endorsement by, Gartner or its affiliates.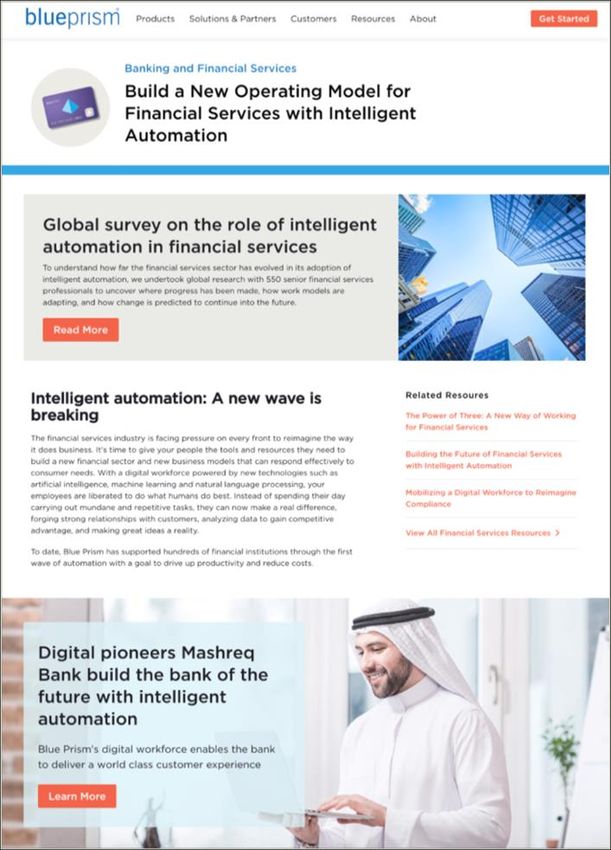
Company development

    Go to market                     Product                           People                           Customers
    ● Martech and SalesTech          ● Product group from 5            ● Pat Finn – new GM for US       ● Customer Advisory Boards
                                       separate groups                 ● “Great Place to Work” survey     all main territories
    ● Demand gen and demand
      models                         ● Realigned CS and BPC            ● New global HR head to join     ● Customer Success model
    ● Vertical alignment of sales      operations                                                       ● New service models for
                                                                       ● Global level set on salaries
      teams and partner teams        ● 9 products in last 6 months –     and career structures            COE and customer scale-
                                       10 with V7                                                         ups
    ● New revenue group – new                                          ● Three additions to Board
      ventures with partner model    ● Vertical Alignment Service        members                        ● New model for Customer
                                       Assist                                                             support
    ● Demand gen and buyer journey                                     ● Internal Comms - BPTV
    ● Alignment with tech partners                                                                      ● CS aligned with licensing
                                                                       ● Post covid working models        model
      and referral schemes
                                                                                                        ● Zero-based design
                                                                                                          methodology for
                                                                                                          automation acceleration

4   Commercial in Confidence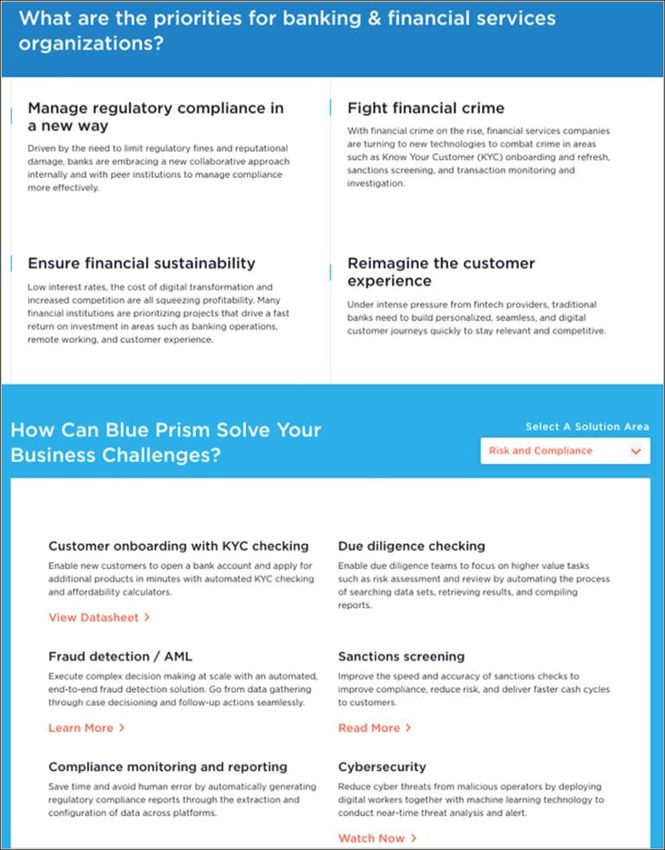
Blue Prism World May 18-20

     Blue Prism World Announcements
     Blue Prism Launches Version 7 – Next Generation of Intelligent Automation
     Blue Prism Announces Comprehensive New Enterprise Contact Center Offering
     with Amazon Connect
     Blue Prism Builds on New Era of Growth
     StarLink Becomes Blue Prism’s First Value-added Distributor in the Middle East

     Available On Demand until June 4

        Attendees                                      Sessions                            Engagement
        Registrations: 8,092                           Day 1 Keynote: 2,063                Blue Prism Virtual Room: 1,083
        Attendees: 4,666 (+24% Y/Y)                    Day 2 APAC: 197                     Joined any Virtual Room: 593
        Type: 43% Customer, 18% Prospect, 17%          Day 2 Keynote: 1,352                Messages sent in Connection Zone: 5,000+
        Partner, 22% other                             Day 3 Keynote: 1,054                Digital Worker: 1,515 Operations
        Level: 7% C-Level, 44% Business, 49%           On demand sessions watched: 5,234   completed; 21 hours saved
        Technical                                      LinkedIn Live: 2.5k views
        Region: 45% EMEA, 16% APAC, 39% AMER

5   Commercial in Confidence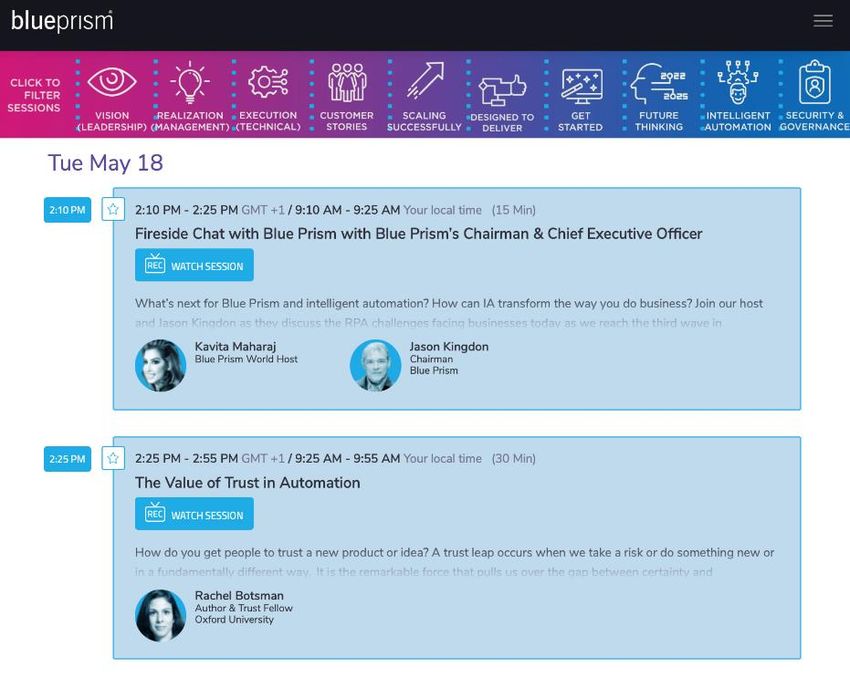
Version 7
                                                                    Easily Manage the
                                                                    Digital Workforce
                               WAY BEYOND RPA:                      at Scale

                               ● Cloud First
                               ● Intelligent automation             Grow Your Digital
                                                                    Workforce Faster
                               ● Business users
                               ● Extension of core infrastructure

                                                                    Make Your Digital
                                                                    Workforce
                                                                    Data Driven

                                                                    Expand Your
                                                                    Digital Workforce
                                                                    Scope

6   Commercial in Confidence
Product reach

                               Accelerate Amazon Connect and Amazon ElastiCache, with Blue Prism
                               Service Assist for AWS combines intelligent automation and multiple API integrations with AWS for a solution that enables
                               Blue Prism’s digital workers to assist and accelerate contact center transformation - instantly retrieving customer
                               information in near real-time for every incoming call” Madhu Raman Worldwide Head of Intelligent Automation, AWS

                               Accelerate World Leading Process Mining

7   Commercial in Confidence
Pinnacle Winners 2021
                               Annual Filing - Automated
                               All 2,524 listed companies - must
                                                                                                      OCR
                               maintain compliance and the data in the
                               annual report filed with the Exchange is
                               key indicator of that compliance.                                      NLP

                               On Boarding – Intelligent Processing to scan:                      Machine
                                                                                                   Vision
                               ● listing documents
                               ● annual reports
                               ● for names, ages of directors, other directorships, stock           Entity
                                 codes, subsidiary and associated companies.                      Recognition
                               ● Background checks and automated compliance                 OCR NLP

                               Personal Services – Automated
                               Personal Contact Manager: Automating of all
                               reading all emails to determine sentiment and
                               trigger the appropriate next actions;

                               Agent Support - Automated
                               Automating support for agents with 360 data
                               sets and customer history

8   Commercial in Confidence
Opportunity

                    85 %                         ~50 %                    69 %+                ~60 %

                               of enterprises will   of work activities     of organizations select   of all jobs have
                               have deployed RPA     globally are           process automation        30% of tasks that
                               technology by 2022    automatable today      as key driver for         can be automated
                                                                            digital transformation

9   Commercial in Confidence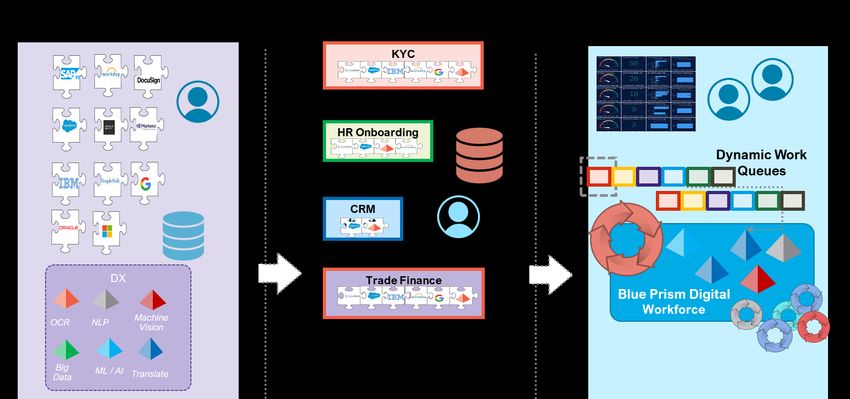
Annual US Spend on
       Data Collection and
       Processing that is
       Automatable

                                $1.3Tn
                                 Morgan Stanley
                                     2020

10   Commercial in Confidence
FINANCIAL & INSURANCE
Blue Chip
Global Enterprise
Customer Base
HEALTHCARE
2,000+ 70+
INDUSTRIES
CUSTOMERS
CONSUMER
170
COUNTRIES
60%
EUROPE’S TOP 20 BANKS
ARE CUSTOMERS GOV. / NGO
~$1.5m >50%
INDUSTRIALS
AVG SPEND P.A BY TOP 50 CUSTOMERS
TOP 50 CUSTOMERS UPSOLD IN ’21
TMT
As of 30 April 2021
11 Commercial in Confidence60% of Europe’s top 20
Target Sectors & Use Cases banks use Blue Prism
FS&I CMT PUBLIC SECTOR ENERGY MANUFACTURING
% revenue
(2021) 46% 16% 6% 7% 7%
Market size* £5.7bn £2.1bn £1.7bn £4.6bn £11.7bn
Onboarding & KYC Future operating model Serve citizens better Aging infrastructure Optimise supply chain
Future operating model Customer experience Leverage technology Regulatory compliance Financial sustainability
Hyper Compliance Operationalise 5G Personalised healthcare Customer experience Regulatory changes
Digital claims New revenue streams Regulatory compliance Innovate for climate change Future operating model
● Automated the payment of COVID - ● 266 digital workers covering 163 ● Digital workers take referrals to ● Digital workers automated text ● Digital workers automated 50
19 response small business loans discrete processes hospitals & gather supporting data alerts for appointments processes across SAP systems
● Payment in 3 minutes from ● Saving 20,000 labour hours a to provide an information pack to ● Takes one digital worker 30 ● Enabled HR audits to be run in SAP
application month consultants minutes to achieve the work of 8 ● Added 16 hours to the average
● Would have taken 30 FTE from ● Saved £220k, released 500 hours FTEs workday
other duties to patient care and reduced
completion from 20 to 5 mins
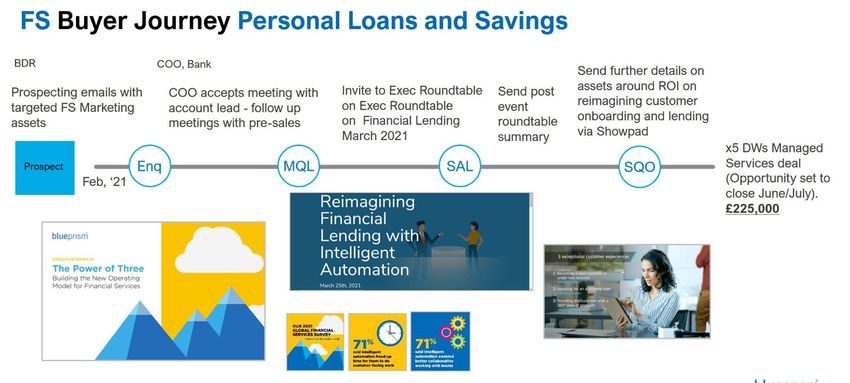
12 Commercial in Confidence *Market of G10k customers in the sector, assumes long term digital worker opportunity of 1,000Sector marketing 13 Commercial in Confidence
Sector marketing
                 Faced by new competition, changing consumer
     Why         demands

                 Targeted high but micro messaging into different market
     Who         segments – Retail banks, Lending, Wealth & Asset
                 Management and Building Societies (UK) and
                 FinTechs/neobanks
                 ●    T1: C-Suite, Function/ Regional Heads
                 ●    T2: Board and C-suite

                 Under the three thirds model, include:
     What
                 ●    Organizational agility and resiliency
                 ●    Building for scale
                 ●    Reimagining Compliance/CX/etc.
                 ●    Harnessing the power of data through connectivity

     How         ●    Providing an exec series of assets based on the
                      global survey. Promoting through corporate
                      channels, partners and paid social
                 ●    Elevating content to support Field Marketing events

14    Commercial in Confidence
What’s next?
R&D Investment for Product Drive
Solution selling & customer intimacy
Optimizing Go To Market
15 Commercial in ConfidenceFINANCIALS
Ijoma Maluza, CFO
16 Commercial in ConfidenceBlue Prism Key Performance Indicators
£311m £162m 98%
H1-21 ARR1
H1-21 RPO H1-21
(22% y-o-y constant
(Remaining Performance Obligation) Gross Retention2
currency growth)
£98m £80.4m (£8.0)m (£8.1)m
H1-21 Revenue
H1-21 TCV H1-21 Adj. EBITDA H1-21 cash from
(24% y-o-y constant
(£m) operations (£m)
currency growth)
>2,000 22% 1,037
Number of Customers Number of
Customers Upsold3 Employees
Notes:
(1) H1-21 ARR calculated as exit monthly recurring revenue multiplied by 12 months(2) Based on ARR at the beginning of FY21 less ARR lost with lost customers (3) Number of customers upsold as %
of customers at the beginning of the FY21.
17 Commercial in ConfidenceBuilding a diverse, high quality revenue base
REVENUE BY TYPE REMAINING PERFORMANCE OBLIGATION
Recurring licence 98% £311M
Prof services 2%
REVENUE BY GEOGRAPHY ANNUAL RECURRING REVENUES
£162.0m
£38.2m £153.6m
£139.2m
£31.6m £127.2m
£32.6m
£25.8m £91.2m
£18.8m
£16.2m
£10.6m
£8.2m
£5.4m
1H19 1H20 (re-stated) 1H21 1H19 FY19 1H20 FY20 1H21
EMEA Americas APAC
18 Commercial in Confidence All numbers as reportedTotal Contract
Value (TCV) BOOKINGS (‘TCV’) (£m)
growing
120
New business (upsells and
new customer wins) grew
8% in the period, including 100 1.7
Services
FX headwinds 56.3
Strong retention and 80
positive momentum around 1.9
New business
growth 1.9 52.0
Four fifths of new business 60 53.1
from upselling
Total bookings growth 40
experienced a c. 4% 39.8
headwind y/y due to FX Renewal
20
18.6
10.1
0
1H19 1H20 1H21
19 Commercial in ConfidenceGross margins
COST OF SALES
Gross margins before £M 1H21 1H20 % MOVEMENT
amortisation remain
Direct cloud costs 1.2 1.0 20%
robust
% of revenue 1.5% 1.5%
Sales commissions are
Amortisation of costs to obtain In accordance
amortised over the life of contracts
7.8 6.1 28%
with IFRS 15
the contract
% of revenue 9.7% 9.2%
Technology
Direct employee costs of expense
5.2 3.3 58%
delivery previously
included in opex
% of revenue 6.5% 5.0%
Total cost of sales 14.2 10.4 37%
20 Commercial in ConfidenceCost base
Operating costs down OPERATING COSTS
23%: £M 1H21 1H20 %
MOVEMENT
• Strong cost controls Travel, slightly lower
Sales & marketing 47.1 69.0 (32)%
headcount
• Lower T&E
Research & development 9.0 6.4 41%
• R&D expense General & admin 13.3 15.3 (13)%
growing
Op costs (excl. SBP & D&A) 69.4 90.7 (23)%
• Phasing
D&A 2.9 3.2 (9)% Reduced lease costs
R&D of £9m relates to FX 3.8 (2.2) (273)%
operating costs only,
Share based payments 5.7 7.0 (19)%
including cost of sales
R&D is £14.2m Exceptional costs 4.4 10.7 (59)%
Total operating costs 86.2 109.4 (21)%
21 Commercial in ConfidenceProduct spend 18% of revenues
Plan to double Product function headcount by calendar year end
PRODUCT SPEND (£M)
2021 product expense
£14.2m
consists of:
- £9.0m operating costs
(slide 21)
£9.7m
- £5.2m cost of sale
(direct employee cost
of delivery on slide 20)
£3.5m
£1.6m
1H18 1H19 1H20 1H21
(reported) (reported) (reclassified)
22 Commercial in ConfidenceCash flow
On target to reach break-even by end of 2021
SUMMARY CASHFLOW
£M 1H21 1H20 FY20
restated
Adjusted EBITDA (8.0) (32.8) (42.8)
Trade & other receivables (2.1) (7.3) (2.8)
Contract assets 0.1 0.7 (2.3)
Trade & other payables 0.9 (4.8) (5.9)
Deferred revenue 1.0 12.1 18.4
Working capital movement (0.1) 0.7 7.4
Cash used in operations (8.1) (32.1) (35.4)
PP&E (0.1) (0.3) (0.3)
Other movements (2.9) 77.7 127.8
Opening cash 137.6 45.5 45.5
Closing cash 126.5 90.8 137.6
23 Commercial in ConfidenceRetention Rates
Are Market Leading ~£220k ~£100k
~£100k £13.5m
Gross retention rate ~£40k £12.8m
continues to be robust in the Revenue £11.6m
£10.6m
high 90s retention
by MRR GRR:
2,000+ customer base and GRR: GRR: GRR:
growing 99% 98% 98% 98%
FY19 FY20 H1-20 H1-21
Over 20% of customer base
upsold in the last 6 months
143%
113% 110% 115%
Net
retention
rate
FY19 FY20 H1-20 H1-21
24 Commercial in ConfidenceGroup cohort progression
COHORT GROWTH
1H21 H1 2021 -
2H20
1H20 H2 2020 1x
2H19
H1 2020 2x
1H19
H2 2019 2x
2H18
H1 2019 2x
1H18
H2 2018 2x
H1 2018 3x
2H17
1H17
H2 2017 3x
H1 2017 4x
2H16
H2 2016 7x
1H16
2H15 H1 2016 6x
1H15
H2 2015 10x
Note: H1 2015 3x
1. The chart shows the total revenue growth, inclusive of losses, for the group of customers that joined Blue Prism in each respective half of the year.
The H2 2019 cohort includes the addition of Blue Prism Cloud customers
2. Growth multiple (x) is based on dividing the H1 2021 exit revenue rate with the revenue rate in the first cohort half year
25 Commercial in ConfidenceFY21 financial outlook
● No change from May Trading Update
● Based on H1 reported ARR of £162m, the Board believes FY21
revenue is likely to be towards the lower end of the £170-
180m guidance range. FX is estimated to have negatively impacted
the original guidance by ~£2m.
● The Group continues to expect an EBITDA loss for the year of
c. £25m
The guidance provided above is forward-looking in nature.
Actual results may differ materially. See the cautionary note
regarding forward-looking statements below, under
“Disclaimer”.
26 Commercial in ConfidenceCONCLUDING
REMARKS
Jason Kingdon, CEO & Chair
27 Commercial in ConfidenceIn conclusion
● Blue Prism digital workers are defining a clear model for
Intelligent Automation, which moves beyond early days
of RPA and towards intelligent digital workforce
working within all businesses
● We are doubling down on R&D investment, becoming a
product-led global software company
● Focused on building long-term strategic customer
relationships
28 Commercial in ConfidenceAPPENDICES 29 Commercial in Confidence
A differentiated approach to RPA
                                         Tech Estate
                                 COBOL                 FORTRAN
                                                                            ..
                                                                             .

                  Conventional
                                                   Blue Prism Intelligent
                     RPA
                                                        Automation

30   Commercial in Confidence
Headcount
EMPLOYEES
Number of employees at 30
During the period the Group has continued to evolve the
1H21 1H20 organisational structure to effectively align go to market
April 2021
Sales & marketing 598 647 and product development and maintenance.
Research & development 316 255
Consequently, it has established a Chief Revenue Office
(CRO) which includes all the functions associated with the
General & admin 123 108
execution of the GTM strategy including Sales, Field
Total operating costs 1,037 1,010
Marketing and Field Services.
The Product Group has been expanded to include product
strategy, development, support and education services.
The Group has continued to prioritise investment into the
product function build capability and capacity.
31 Commercial in ConfidenceA Digital Workforce for Every Enterprise
© 2021 Blue Prism Limited. “Blue Prism”, the “Blue Prism” logo and Prism device are either
32 Commercial in Confidence trademarks or registered trademarks of Blue Prism Limited and its affiliates. All Rights Reserved.Disclaimer
This document comprises the slides for a presentation concerning Blue Prism Group Plc (the “Company”) and its interim results for the first half of its 2021 financial
year (the “Presentation”).
No reliance may be placed for any purposes whatsoever on the information in this Presentation or on its completeness. The Presentation is intended to provide a
general overview of the Company’s business and does not purport to deal with all aspects and details regarding the Company. Accordingly, neither the Company
nor any of its directors, officers, employees or advisers nor any other person makes any representation or warranty, express or implied, as to, and accordingly no
reliance may be placed on, the fairness, accuracy or completeness of the information contained in the Presentation or the views given or implied. Neither the
Company nor any of its directors, officers, employees or advisers nor any other person shall have any liability whatsoever for any errors or omissions or any loss
howsoever arising, directly or indirectly, from any use of this information or its contents or otherwise arising in connection therewith.
This Presentation does not and is not intended to constitute, and should not be construed as, an offer, inducement, invitation or commitment to purchase, subscribe
to, provide or sell any securities, services or products of the Company in any jurisdiction, or any part of any solicitation of any such offer, inducement, invitation or
commitment, or to provide any recommendations for financial, securities, investment or other advice or to take any decision. You are encouraged to seek individual
advice from your personal, financial, legal, tax and other advisers before making any investment or financial decisions subscribing for or purchasing any securities.
Certain statements in this Presentation regarding the Company are, or may be deemed to be, forward-looking statements (including such words as “believe”,
“expect”, “estimate”, “intend”, “anticipate” and words of similar meaning). These forward-looking statements are neither historical facts nor guarantees of future
performance. Such statements are based on current expectations and belief and, by their nature, are subject to a number of known and unknown risks,
uncertainties and assumptions which may cause the actual results, events, prospects and developments of the Company and its subsidiaries to differ materially from
those expressed or implied by the forward-looking statements. Forward-looking statements contained in this Presentation regarding past trends or activities should
not be taken as a representation that such trends or activities will continue in the future. Except as required by applicable law or regulation, neither the Company
(nor its members, directors, officers, employees, agents or representatives) undertakes any obligation to update or revise any forward-looking statements, whether
as a result of new information, future events or otherwise.
The information contained in this Presentation is for background purposes only. The subject matter of the Presentation may be subject to change and the Company
does not take any responsibility for updating or amending the contents to reflect such changes. The material contained in this Presentation reflects current
legislation and the business and financial affairs of the Company, which are subject to change without notice.
This Presentation summarises information contained in the 2021 interim results. No statement in this Presentation is intended to be a profit forecast and no
statement in this Presentation should be interpreted to mean that earnings per Company share for current or future financial years would necessarily match or
exceed the historical published earnings per Company share.
The information contained in this Presentation has been obtained from Company sources and from sources which the Company believes to be reliable but it has not
independently verified such information and does not guarantee that it is accurate or complete.
33 Commercial in ConfidenceYou can also read