Q3FY21 Investor Presentation Adani Total Gas Limited

Page created by Herman Perez
 
CONTINUE READING
Q3FY21 Investor Presentation Adani Total Gas Limited
Investor Presentation
        Q3FY21

Adani Total Gas Limited
Q3FY21 Investor Presentation Adani Total Gas Limited
Contents
01       ATGL Promoters Profile

     a   Adani Group

            B
     b   TOTAL Group

02       About Adani Total Gas

         Adani Total Gas Business and Financial
03
         Profile

         Operational & Financial Highlights – Q3 &
04
         9MFY21

05       Annexures
Q3FY21 Investor Presentation Adani Total Gas Limited
01
ATGL Promoters Profile
Q3FY21 Investor Presentation Adani Total Gas Limited
01a
 About Adani Group
Q3FY21 Investor Presentation Adani Total Gas Limited
Adani Group: A world class infrastructure & utility portfolio

                                                                                                                       Energy & Utility
                                                                                                                                                         Adani
          Transport & Logistics
               Portfolio                                                                                                  Portfolio                       •   Marked shift from B2B to
                                                                                                                                                              B2C businesses–
 63.5%                                100%                                                      75%                           55%                             •   ATGL – Gas distribution
                                                                                                                                                                  network to serve key
     APSEZ                                  SRCPL                                                     ATL                        AGEL                             geographies across India
 Port & Logistics                            Rail                                                     T&D                      Renewables
                                                                                                                                                              •   AEML – Electricity
                100%                                                                                                 75%                37.4%                     distribution network
                                                                                                                                               ATGL3              that powers the
                     NQXT2                                                                                             APL
                                                                                                                                            Gas DisCom            financial capital of
                                                                    75%                                                IPP                                        India
                                                                       AEL                                                                                    •   Adani Airports – To
                                                                    Incubator                                                                                     operate, manage and
                                                                                                                                                                  develop eight airports in
                                                                                                                                                                  the country

                                                                                                                                                          •   Locked in Growth 2020 –
  100%                        100%                                                                       100%                 100%                            •   Transport & Logistics -
                                                                                                                                                                  Airports and Roads
      AAHL                         ARTL                                                                        AWL                Data
     Airports                      Roads                                                                       Water             Centre                       •   Energy & Utility –
                                                           ~USD 59                     bn1                                                                        Water and Data Centre
                                                             Combined Market Cap

              Opportunity identification, development and beneficiation is intrinsic to diversification and growth of the group.

          1 . As on Jan 29, 2021, USD/INR – 73 | Note - Percentages denote promoter holding
          2. NQXT – North Queensland Export Terminal | Light purple color represent public traded listed verticals
          3. ATGL – Adani Total Gas Ltd
Q3FY21 Investor Presentation Adani Total Gas Limited
Adani Group: Decades long track record of industry best growth rates across sectors
Port Cargo Throughput (MT)                                        Renewable Capacity (GW)                                                 Transmission Network (ckm)                                                 CGD7 (GAs8 covered)

                                                                                                     161%                                                                                                                                     45%
                                     12%                                                                                                                                       21%

                     2.5x                                                              6x                                                                     3x                                                        30%
                                                                                                                                                                                                                                   1.5x

            5%
                                                                                                                                                   7%
                                                                            25%

          Industry                 Adani
                                   APSEZ                                  Industry                   AGELAdani                                   Industry                      ATL                                    Industry                AGL

2014        972 MT                  113 MT                     2016             46 GW                    0.3 GW                        2016         320,000 ckm              6,950 ckm                     2015            62 GAs              6 GAs
2020       1,339 MT                 223 MT                     2020             114 GW                  14.2 GW6                       2020         423,000 ckm              14,837 ckm                    2020            228 GAs            38 GAs

                 APSEZ                                                                   AGEL                                                                    ATL                                                             ATGL
       Highest Margin among                                            Worlds largest                                                          Highest availability                                             India’s Largest private CGD
       Peers globally                                                  developer                                                               among Peers                                                      business
       EBITDA margin: 70% 1,2                                          EBITDA margin:89% 1,4                                                   EBITDA margin: 92%1,3,5                                          EBITDA margin: 31%1
       Next best peer margin: 55%                                      Next best peer margin: 53%                                              Next best peer margin: 89%                                       Among the best in industry

                                                                      Transformative model driving scale, growth and free cashflow
                     Note: 1 Data for FY20; 2 Margin for ports business only, Excludes forex gains/losses; 3 EBITDA = PBT + Depreciation + Net Finance Costs – Other Income; 4 EBITDA Margin represents EBITDA earned from power sales
                     and exclude other items; 5 . EBITDA margin of transmission business only, does not include distribution business. 6. Contracted & awarded capacity 7. CGD – City Gas distribution 8. Geographical Areas - Including JV
Q3FY21 Investor Presentation Adani Total Gas Limited
Adani Group: Repeatable, robust & proven transformative model of investment

               Phase                                                  Development                                       Operations                      Post Operations

                  Origination                   Site Development                                     Construction              Operation                     Capital Mgmt
 Activity

                                              • Site acquisition                          • Engineering & design                                       • Redesigning the
               • Analysis & market                                                                                     • Life cycle O&M
                                                                                                                                                         capital structure of
                 intelligence                                                             • Sourcing & quality           planning
                                              • Concessions and                                                                                          the asset
               • Viability analysis             regulatory agreements                       levels                     • Asset Management
                                                                                                                                                       • Operational phase
                                                                                          • Equity & debt funding        plan
               • Strategic value              • Investment case                                                                                          funding consistent
                                                development                                 at project                                                   with asset life

               India’s Largest                  Longest Private HVDC                       Largest Single Location   6 4 8 MW Ultra Mega         In FY20 seven international
               Commercial Port                  Line in Asia                               Private Thermal IPP       Solar Power Plant           bond issuances across the yield
 Performance

               (at Mundra)                      (Mundra - Mohindergarh)                    (at Mundra)               (at Kamuthi, TamilNadu)     curve totalling~USD4Bn
                                                                                                                     Constructed  and
               Highest Margin                        Highest line                           High declared            Commissioned  in            All listed entities maintain
               among Peers                           availability                           capacity of 89%1         nine months                 liquidity cover of 1.2x- 2x
                                                                                                                                                 as a matter of policy.

                                                                                                                                                 14%                         33%
                                                                                                                                                                     47%
                                                                                                                                               31%     55%
                                                                                                                                                                            20%

                                                                                                                                               March 2016           March 2020
                                                                                                                                               PSU     Pvt. Banks   Bonds

                  1. FY20 data for commercial availability declared under long term power purchase agreements;
Q3FY21 Investor Presentation Adani Total Gas Limited
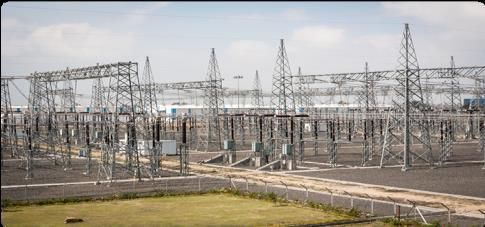
01b
 About Total Group
Q3FY21 Investor Presentation Adani Total Gas Limited
MAJOR ENERGY PLAYER

             Total is a major energy player, that produces and markets
             fuels, natural gas and low-carbon
             electricity.

             Our100,000           employees are committed to better
             energy that is safer, more affordable, cleaner and accessible
             to as many people as possible.

             Active in more than   130 countries, our ambition is to
             become the responsible energy major.
Q3FY21 Investor Presentation Adani Total Gas Limited
MEETING A GROWING DEMAND
                                                                                                     Our activities span the entire value chain:
                                                                ENERGY EFFICIENCY
                                                                    SERVICES
                                                                                                        - from the production of energy
                                                                   CARBON SINKS
                                                                                                          (natural gas, solar and wind power,
                                                                                                          oil, biomass),
                                             STORAGE
                                                                                                        - through to the transport and
                                                                                    FUEL                  transformation of energies into
       NATURAL
         GAS
                              LOW-CARBON
                               ELECTRICITY
                                                              PETROLEUM
                                                               PRODUCTS
                                                                                    LUBRICANTS
                                                                                                          intermediate or final goods,
                                                                                    POLYMERS

                                                                                    CHEMICAL BASES
                                                                                                        - to the storage and distribution of
                                                                                                           products to meet the needs of our
                                                                                                           individual and business customers.

                          POWER PLANTS                 REFINERIES, PETROCHEMICAL
                             (CCGT)                       AND BLENDING PLANTS
                                                                                                     We have also been developing businesses
                                                                                                     that will help achieve carbon neutrality
  LIQUEFIED NATURAL GAS
           (LNG)
                                                                           BIOMASS
                                                                                                     through providing energy efficiency
                                                                                                     services and investing in carbon sinks
                                                                                                     (natural sinks, CCUS).

                                RENEWABLE
        NATURAL GAS              ENERGIES                          OIL
TAKING CLIMATE CHALLENGES INTO ACCOUNT
Becoming the responsible energy major means integrating climate into our strategy and
providing more environmentally friendly energy.
Global energy demand                                            Our objective is to cut the greenhouse gas emissions of our
Mboe/d                                                          operations by 15% between 2015 and 2025. Our ambition is
                                                                to reduce by 15% the carbon intensity of the energy products
   300
                                                                we sell our clients between 2015 and 2030.
                                                  Renewables

                                                                4 strategic focuses integrating the climate:
                                                  Nuclear
                            IEA
                                                  Coal
                                                                n    atural Gas: expanding our presence across the entire chain
                                                                    N
                            2°C                                 n   L ow-Carbon Electricity: developing an integrated business on the
                         scenario*
                                                  Oil               unregulated portion of the value chain
                                                                n   P etroleum Products: avoiding expensive oil, reducing our emissions,
                                                  Natural Gas
                                                                     and promoting both sparing oil use and sustainable biofuels
               2017                        2040                 n   C ontributing to Carbon Neutrality through energy efficiency and
* I EA Sustainable Development Scenario                             carbon sinks
KEY FIGURES
         11.8 bn $
          adjusted net income in 2019 - best-
          in-class profitability among majors

                  >25 GW
                                                    The world
                                                           no.   2      1.5-2 bn $                   3 mboe/day
                                                   liquefied natural        invested in          of production in 2019,
       production capacity of                                          low-carbon electricity       of which > 50%
                                                      gas operator
renewable electricity by 2025                                                each year                natural gas
                                                         (LNG)

          6refining
               major integrated                   A global top10                                 8
                                                                                         More than millon customers

          complexes
                    & petrochemical               refiner and petrochemical
                                                  manufacturer
                                                                                                     15,000
                                                                                         served in our
                                                                                         service stations each day

                                                                                More than
                                                                                                       ̴ 1 bn $
        No.   4                                 135 millon tons                 4,000                  spent on
        lubricant retailer                      of crude & refined              researchers            R & D in 2019
        in the world                            oil shipped by sea              in our 18              including 40%
                                                                                R & D centers          on low-carbon
02
About Adani Total Gas Limited
Adani Total Gas Journey so far…
ATGL has undergone transformation in terms of operational scale and will continue to scale up significantly in the
coming decade
                                                                                              Adani Total Gas Limited
                          • First Domestic Connection   • Entered into a strategic                  Listed Entity
Incorporation of            at Ahmedabad                  50:50 JV with IOCL              • Won & got authorization for 13
  the Company             • Received Supreme Court      • Won & got authorization           GAs
                            Order for Faridabad           for 2 GAs as JV                 • Won & got authorization for 11
                                                                                            GAs in JV with IOCL
     2001                        2005                         2013                            2018

                   2003                         2012                       2015                             2019
             • Received State           • Got authorization          • Won & got                     • Won & got
               NOC for CGD                for Khurja                   authorization                   Authorization for
               Business for                                            for 5 GAs in                    2 Gas & 1 GA in
               Ahmedabad &                                             JV with IOCL                    JV with IOCL –
               Baroda                                                                                  10th Round

                                                                                             2021               2020
                                                                                       • Name Change         • Supermajor
                                                                                         from AGL to ATGL      TOTAL inducted
                                                                                                               as a Strategic
                                                                                                               Investor
About Adani Total Gas Limited (ATGL)
ATGL has multipronged presence across Natural Gas Value Chain in India, has a JV with India’s largest downstream PSU
and one of the world’s largest IOCs as a strategic partner in ATGL

                                                                                                                                      Public
                                           37.4%                      37.4%                                                           25.2%

                                                                                                                                                      Combined

      LNG Tanker                 LNG Terminal                                                                                                         38*

                                                                                            19 Authorized areas 19 Authorized areas
                                                                                                                   CGD Network
                                                      NG
                                                 Transportation

         Domestic Gas           Pipeline Entities
        (ONGC, Reliance etc.)     (GAIL, GSPC.etc)
                                                                      50%

                                                                                               CGD Network
                                                                                                                                                                 Domestic/
                                                                                                                                                                 Households

                                                                                                                                               Serviced by
                                                                                                                                                Segments
                                       50%                                                                                                                       Transport

                                                                                                                                                  CGD
                                                                                                                                                                 Industrial

                                                                                                                                                                 Commercial

                                                     * 19 ATGL + 19 IOAGPL Authorized GAs
Adani Total Gas – India’s Largest Private City Gas Distribution Company

                                                                        1,550+
         14
                                                                          Industrial           0.46
                               151               7,800+                                        Million
                                                                                                                   1.78
   ATGL Operational
         GAs
                            CNG stations          Kms pipeline
                                                   network
                                                                        3,100+                Residential
                                                                                                              Average mmscmd gas
                                                                                                                     supply
                                                                         Commercial           customers

                          Largest private player in India’s City Gas space with over a decade of experience

       425+                  >INR   2,000 cr             ~INR   2000 cr                >28%+                         AA-
    Human Capital                Asset base                  Revenue*                       RoE                  External Rating

                                     Balanced growth across customer segment and geography
 As on 31 December 2020
 *As on 31 March 2020
Adani Total Gas Landscape (including JV – IOAGPL )
ATGL has a geographically diversified portfolio in the CGD sector that includes major commercial, industrial and
residential hubs

                                                                                                 15 States
                                GA Spread
                                                                                                71 Districts

                                                                                              8% Population

                                                                                      Largest Private CGD Entity

                                                                             Only Private CGD Entity Listed on Indian
                                                                                         Stock Exchange

                                                                                        38 Geographical Areas

                                                                           • * 19 ATGL + 19 IOAGPL Authorized GAs

                                                                           **IOAGPL – Indian Oil-Adani Gas Pvt. Ltd. – 50-50 JV of
                                                                           Indian Oil Corporation Limited & Adani Total Gas

                         Largest private sector CGD player poised to leverage growth opportunity
Adani Total Gas Limited: Current Infrastructure and Trends

                                                         7,660+ Kms of     0.44
                                                                            4.4 Lakh
                                                                                 LakhDomestic
                                                                                     Domestic                                                          2976 Commercial
                                                       Pipeline Networks        Customers                                                                 Customers
                  Sales Volume (MMSCM)                 (including MDPE)                             Financial Performance

                                                           3 Yr. CAGR                                                                                        3 Yr. CAGR
700                                                                          2500                                                        31.4%       32.0%
                                                 582                                                                                                 31.0%
600                                540                                       2000                                      1823                  1991    30.0%
                       479                                    9.6%                                    29.0%                                                      19.7%
500                                                                                                                                                  29.0%
        408                                                                  1500
                                                 291                                                                                                 28.0%
400                                264                                              1162                 1385                 28.3%
                       231                                   15.9%                     26.4%                                                         27.0%       26.3%
300     187                                                                  1000
                                                                                                                                             639     26.0%
                                                                                                                         541
200                                                                                                     445                                    436   25.0%
                                                                              500     317
                                                             12.6%                                                            229                                62.8%
                       248         276           291                                      101              162                                       24.0%
100     221
                                                                               0                                                                     23.0%
 0                                                                                  2016-17          2017-18            2018-19        2019-20

       2016-17     2017-18     2018-19       2019-20                                 Revenue from operations(INR Cr)      EBIDTA

                                                                                     PAT (INR Cr)                         EBIDTA Margin(%)
                 CNG         PNG         Total

                                                                                                                                                             As of March’20

      CAGR – 20% Topline & 60%                               o ATGL has witnessed profitable growth in the last 3 years with robust
                   Bottom Line                                 Topline and Bottom-line growth
03
Adani Total Gas - Business and Financial Profile
Resilient Operations Resulting into Strong Financial & Operating Performance

                     Sales Volume Mix (MMSCMD)                                         EBITDA (INR Cr), PAT (INR Cr) & Margin (%)
     1.80               1.12          1.31          1.48      1.60    2.00
             1.04                                                                700                                                 31%         40%
                                                                                                    26%       29%         28%
     1.60                                                             1.00              23%
                                                                                 600                                                             30%
     1.40                                                     0.80
                                                    0.72              0.00                                                                       20%
     1.20                                                                        500                                                       436
                                      0.63                                                                                                       10%
     1.00                                                             (1.00)     400
                       0.51                                                                                                                      0%
             0.47
     0.80                                                             (2.00)     300                                               639           -10%
     0.60                                           0.76      0.80                                                      541 229
                                      0.68                            (3.00)                                 445 165                             -20%
                       0.61                                                      200
     0.40     0.57                                                                     288 81      317 101                                       -30%
     0.20                                                             (4.00)     100                                                             -40%
     0.00                                                             (5.00)      0                                                              -50%
             FY16      FY17           FY18          FY19      FY20                      FY16        FY17      FY18       FY19        FY20

                               CNG         PNG       Total                                       EBITDA      PAT       EBITDA Margin (%)

                                RoCE & RoNW                                    Steady Growth in Gas Distribution Infrastructure
                                                                     40%                                                                   115
                                                             34%                Retail Outlets                          61
                                                                     35%
                                                   29%
                                                                     30%
            24%       24%                                                                                                                  484
                                     23%                      30%    25%                                               362
                                                   23%               20%        Steel Network
                                     21%
                                                                     15%        (Kms)
                      15%
            14%                                                      10%
                                                                                                                                           4.4
                                                                     5%

                                                                     0%         Households (Lac)                       2.06
            FY16      FY17           FY18          FY19      FY20
                                                                                                                       2015              2020
                                 ROCE            RoNW
Diversified Geographic & Customer base with Prudent Gas Sourcing

                               Diversified customer base                              Balanced geographic spread
                                         Commercial
                            Domestic                                                                      Faridabad,
                                            3%
                              9%                                                                             27%

                                                                                                                 Khurja, 5%
                                       Customer                                              Geographic
               Industrial              Segment        CNG                                      Spread              Vadodara, 5%
                  38%                                 50%                    Ahmedabad,
                                                                                58%
                                                                                                              New GAs, 4%

                                            Prudent Gas Sourcing Strategy and Pricing Mechanism

    • Government allocates gas for CNG & domestic as priority sector
    • Gas for other customer segments bought from open market
    • Multiple Suppliers mitigates dependency on single entity
    • Strategic and Agile Gas Sourcing Function to respond to immediate market dynamics
    • Strategic Choice of Price Index based on the GA Segmentation , customer portfolio & Outlook

    As on March 2020
Automation & Digitization of Customer Facing Processes
 ATGL has witnessed a significant growth in the share of Digital Transactions significantly over the years due to the
 various initiatives

1. POS – Card payments                   4. Cashback and promotional offers
POS – card payment receipt for
                                                                                ATGL has adopted a structured     −   Call Center
after sales services , gas bill           To boost digital transactions, ATGL   and process-driven approach to
payments at Customer Care offices         tied up with different wallets for    ensure       best      customer   −   24*7 Consumer Care
and Recovery agent collects the           cashback and promotional offers                                             Center
payment by POS machine
                                                                                experience for all segments
                                                                                                                  −   Social Media /
2. Digital Signing                        5. Spot billing of House lock cases                                         Whatsapp
Use of e-signatures (digital signs)
in each and every communication           Generation and delivery of the          Customer                        −   Mobile App
of Billing.                               estimated spot bill in case of          Centricity :   A
                                          house lock                                                  through
                                                                                  Well-defined                    −   Chat Bot
                                                                                  Approach
3. Ease of payment in Rural areas         6. Gas Bills on WhatsApp                                                −   Website
Banking correspondence model              Send Gas bills on WhatsApp to
implemented to collect cash               go green initiative and reduce                                          −   Email
against gas bills in rural areas. It      carbon footprint
is an S2S transaction to get real                                                                                 −   SMS & Missed Call
time updates

                       7. Real time payment updates
                                                                                                                                  Improve
                                                                                ATGL works towards Customer                      consumer
                       Building the confidence in                               Experience from the customer’s                  touchpoints
                       customers to increase the digital
                       transactions by API integration                          Expectations
04
Operational & Financial
Highlights – Q3 & 9M FY21
Operational and Financial Highlights

  Operational Highlights
  ➢    Uninterrupted gas supply (24X7) maintained during the quarter
  ➢    Combined volume of CNG and PNG achieved 153 MMSCM in Q3 FY21 vs 154 MMCM in Q3 FY20
  ➢    Commenced additional 17 New CNG stations in Q3 and has increased its network to 151 CNG Stations,
  ➢    PNG Home Connection increased to 4.57 Lacs (10346 New Connections added in Q3 FY21)
  ➢    Commercial & Industrial connection now increased to 4737

      Financial Highlights

  ➢ Q3 FY21 Revenue from Operations increased by 1% Y-o-Y to INR 522 Cr vs. INR 519 Cr

  ➢ Q3 FY21 EBIDTA has increased by 33% Y-o-Y to INR 222 Cr vs. INR 166 Cr

  ➢ Q3 FY21 Revenue from Operations increased by 18% Q-o-Q to INR 522 Cr vs. INR 441 Cr

  ➢ Q3 FY21 EBIDTA has increased by 2% Q-o-Q to INR 222 Cr vs. INR 218 Cr

  ➢ 9M FY21 EBIDTA has increased by 14% Y-o-Y to INR 525 Cr vs. INR 459 Cr
Key Milestones

➢ CNG network Expands to 151 Stations , Added 17 New CNG Stations in Q3FY21

➢ Achieved Highest Ever Quarterly EBITDA of INR 222 Crs

➢ Crossed 2 MMSCMD Volume in January 2021

➢ Company has signed Share Purchase Agreement on 21st Jan’21 for acquisition of 5% Stake of

  Indian Gas Exchange Limited from Indian Energy Exchange Limited.

Other Updates

➢ Change of Name from Adani Gas Limited to Adani Total Gas Limited w.e.f. 1st January 2021

➢ PNGRB has granted ~ 129 days extension for the 14 New GAs towards Force Majeure Claim by

   ATGL.
Key Financials – Quarter Wise Performance (1/2)

                            Volume Comparison Q3FY21 vs Q2FY21 (MMSCM)
                                                                                                   ➢ CNG       Volume      has

            CNG                                 PNG                               Total              increased    Q-o-Q     on

                   68                                   85                                 153       account     of    recovery
    59                                  72                                131
                                                                                                     due to Covid-19 and
                                                                                                     addition of New CNG
            16%                                 18%                               17%
                                                                                                     stations in New GAs
                                                                                                     while     Y-o-Y      CNG
   Q2FY21         Q3FY21               Q2FY21         Q3FY21             Q2FY21           Q3FY21     volume has decreased
                                                                                                     due to ongoing partial
                           Volume Comparison Q3FY21 vs Q3FY20 (MMSCM)                                restrictions across GAs
            CNG                                 PNG                               Total
    75                                                  85                                         ➢ PNG       Volume      has
                   68                   79                                154              153
                                                                                                     increased due to on
            9%                                  9%                                0.2%
                                                                                                     recovery of Economic
                                                                                                     Activities which was
                                                                                                     affected due to Covid-
  Q3FY20          Q3FY21               Q3FY20         Q3FY21             Q3FY20           Q3FY21     19 and addition of New
                                                                                                     Customers
Key Financials – Quarter Wise Performance (2/2)

                                                                 33%                      Increase of EBITDA by
               GA wise Volume                                                             33% on account of
                                                              EBITDA
                                                                            222
                       4%                                                                 ➢ Gas              Sourcing
                                                      166                                    efficiency which has
                                                                                             led   in    increase    in

                             29%                                                             Gross Margins
                                                                                          ➢ Cost         Optimization
            50%
                                                     Q3FY20                Q3FY21            initiatives          have
                                                                                             resulted      into   lower
                       10%         8%                          PBT & PAT
                                                                                             Operational
                                                                            195
                                                                                             Expenditure
                                                      144                           145
                                                              114
Ahmedabad   Vadodara   Faridabad   Khurja   New GA                                        PBT      and     PAT      has
                                                                                          increased by 35% and

                                                        Q3FY20                  Q3FY21
                                                                                          27% respectively
                                                                    PBT   PAT
Legal Disclaimer
Certain statements made in this presentation may not be based on historical            ATGL assumes no responsibility to publicly amend, modify or revise any forward-
information or facts and may be “forward-looking statements,” including those          looking statements, on the basis of any subsequent development, information or
relating to general business plans and strategy of Adani Total Gas Limited             events, or otherwise. Unless otherwise stated in this document, the information
(“ATGL”), its future outlook and growth prospects, and future developments in its      contained herein is based on management information and estimates. The
businesses and competitive and regulatory environment, and statements which            information contained herein is subject to change without notice and past
contain words or phrases such as ‘will’, ‘expected to’, etc., or similar expressions   performance is not indicative of future results. ATGL may alter, modify or
or variations of such expressions. Actual results may differ materially from these     otherwise change in any manner the content of this presentation, without
forward-looking statements due to a number of factors, including future changes        obligation to notify any person of such revision or changes. No person is
or developments in its business, its competitive environment, its ability to           authorized to give any information or to make any representation not contained
implement its strategies and initiatives and respond to technological changes          in and not consistent with this presentation and, if given or made, such
and political, economic, regulatory and social conditions in India. This               information or representation must not be relied upon as having been authorized
presentation does not constitute a prospectus, offering circular or offering           by or on behalf of ATGL. This presentation is strictly confidential. This
memorandum or an offer, or a solicitation of any offer, to purchase or sell, any       presentation does not constitute an offer or invitation to purchase or subscribe
shares and should not be considered as a recommendation that any investor              for any securities in any jurisdiction, including the United States. No part of its
should subscribe for or purchase any of ATGL’s shares. Neither this presentation       should form the basis of or be relied upon in connection with any investment
nor any other documentation or information (or any part thereof) delivered or          decision or any contract or commitment to purchase or subscribe for any
supplied under or in relation to the shares shall be deemed to constitute an offer     securities. None of our securities may be offered or sold in the United States,
of or an invitation by or on behalf of ATGL. ATGL, as such, makes no                   without registration under the U.S. Securities Act of 1933, as amended, or
representation or warranty, express or implied, as to, and does not accept any         pursuant to an exemption from registration therefrom. This presentation is
responsibility or liability with respect to, the fairness, accuracy, completeness or   confidential and may not be copied or disseminated, in whole or in part, and in
correctness of any information or opinions contained herein. The information           any manner. This presentation contains translations of certain Rupees amounts
contained in this presentation, unless otherwise specified is only current as of       into U.S. dollar amounts at specified rates solely for the convenience of the
the date of this presentation.                                                         reader.

   Investor Relations
   Mr. Priyansh Shah
   Investor Relations
   Priyansh.shah@Adani.com
   +91 79 2555 7139
Annexures
Key Financials : Income Statement Summary – Standalone (INR Cr)

                                              Quarter Ended                Nine Months Ended      Year Ended
            Particulars
                                  31-Dec-20     30-Sep-20     31-Dec-19   31-Dec-20   31-Dec-19   31-Mar-20
Revenue from Operations             522            441          519         1170        1501        1991
Operating Expenses                  260            181          312         526          926        1176
Administrative & other Expenses      49             51           51         145          148         220
Total Expenditure                   310            232          363         670         1074        1396
Op.EBITDA                           213            210          156         500          427         595
Other Income                          9              8           10          25           33         44
EBITDA                              222            218          166         525         459          639
Interest Expenses                    10             10           10          29           31          41
Depreciation & Amortization
                                     16             15           13          45          37          51
Expenses
Profit before Tax                   195            192          144         450         391          547
Exceptional Item                      0            (10)           0         (10)          0            0
Total tax expense                    50             47           29         113          77          111
Profit After Tax                    145            136          114         327         314          436
Other Comprehensive Income         (0.08)          0.12        (0.27)      (0.24)      (0.80)       (1.11)
Total Comprehensive Income          145            136          114         327         313          435
Earning Per Share (INR)             1.32           1.23         1.04        2.97        2.86         3.97
Key Financials : Income Statement Summary – Consolidated (INR Cr)

                                                   Quarter Ended                Nine Months Ended      Year Ended
            Particulars
                                       31-Dec-20    30-Sep-20      31-Dec-19   31-Dec-20   31-Dec-19   31-Mar-20
Revenue from Operations                  522           441           519         1170        1501        1991
Operating Expenses                       260           181           312         526          926         1176
Administrative & other Expenses           49            51            51         145          148         220
Total Expenditure                        310           232           363         670         1074        1396
Op.EBITDA                                213           210           156         500          427         595
Other Income                               9             8            10          25           33          44
EBITDA                                   222           218           166         525         459          639
Interest Expenses                         10            10            10          29           31          41
Depreciation & Amortization Expenses      16            15            13          45           37          51
Profit before Tax                        195           192           144         450          391         547
Exceptional Item                           -           (10)            -         (10)           -           -
Total tax expense                         50            47            29          113          77          111
Profit After Tax                         145           136           114         327          314         436
Share in Profit/ (Loss) from JV          0.74         (1.36)         1.07       (8.04)       0.74        0.08
Other Comprehensive Income              (0.08)         0.12         (0.27)      (0.24)      (0.80)       (1.10)
Total Comprehensive Income               146           134           115         319          314         435
Earning Per Share (INR)                  1.33          1.22          1.05        2.90        2.86         3.97
Thank you
You can also read