BMO Capital Markets 2018 Chemicals Conference - JUNE 26, 2018 - Calumet ...
←
→
Page content transcription
If your browser does not render page correctly, please read the page content below
BMO Capital Markets 2018
 Chemicals Conference
       JUNE 26, 2018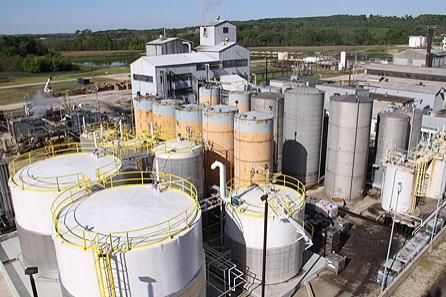
Forward-Looking Statements
This Presentation has been prepared by Calumet Specialty Products Partners, L.P. (the “Company” or “Calumet”) as of June 6, 2018. The information
in this Presentation includes certain “forward-looking statements.” These statements can be identified by the use of forward-looking terminology
including “may,” “intend,” “believe,” “expect,” “anticipate,” “estimate,” “forecast,” “continue” or other similar words. The statements discussed in this
Presentation that are not purely historical data are forward-looking statements. These forward-looking statements discuss future expectations or state
other “forward-looking” information and involved risks and uncertainties. When considering forward-looking statements, you should keep in mind the
risk factors and other cautionary statements included in our most recent Annual Report on Form 10-K and Quarterly Report on Form 10-Q. The risk
factors and other factors noted in our most recent Annual Report on Form 10-K and Quarterly Report on Form 10-Q could cause our actual results to
differ materially from those contained in any forward-looking statement.

Our forward-looking statements are not guarantees of future performance, and actual results and future performance may differ materially from those
suggested in any forward-looking statement. All subsequent written and oral forward-looking statements attributable to us or to persons acting on our
behalf are expressly qualified in their entirety by the foregoing. Existing and prospective investors are cautioned not to place undue reliance on such
forward-looking statements, which speak only as of the date of this Presentation. We undertake no obligation to publicly release the results of any
revisions to any such forward-looking statements that may be made to reflect events or circumstances after the date of this Presentation or to reflect
the occurrence of unanticipated events.

The information contained herein has been prepared to assist interested parties in making their own evaluation of the Company and does not purport
to contain all of the information that an interested party may desire. In all cases, interested parties should conduct their own investigation and analysis
of the Company, its assets, financial condition and prospects and of the data set forth in this Presentation. This Presentation shall not be deemed an
indication of the state of affairs of the Company, or its businesses described herein, at any time after the date of this Presentation nor an indication that
there has been no change in such matters since the date of this Presentation.

This Presentation and any other information which you may be given at the time of presentation, in whatever form, do not constitute or form part of any
offer or invitation to sell or issue, or any solicitation of any offer to purchase or subscribe for any securities of the Company, nor shall it or any part of it
form the basis of, or be relied upon in connection with, any contract or commitment whatsoever. Neither this Presentation nor any information included
herein should be construed as or constitute a part of a recommendation regarding the securities of the Company. Furthermore, no representation or
warranty (express or implied) is made as to, and no reliance should be placed on, any information, including projections, estimates, targets and
opinions contained herein, and no liability whatsoever is accepted as to any errors, omissions or misstatements contained herein. Neither the
Company nor any of its officers or employees accepts any liability whatsoever arising directly or indirectly from the use of this Presentation.

                                                                                                                                                                    2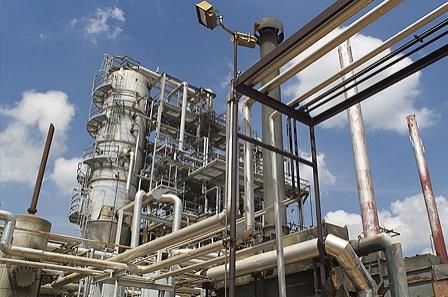
Calumet Investment Summary

    Specialty Products Focus
      − High margin, high touch, tailored products for long-term customers

    Turnaround Strategy Progressing Well
      − Executed two non-core asset divestitures in 4Q17
      − Redeemed 11.5% secured notes and renewed revolver
      − Committed to further leverage reduction and balance sheet improvement

    “Self-Help” Driving EBITDA Improvement
      − Realigned organizational structure and rebuilt culture around P&L ownership and accountability
      − Targeted cost reductions, raw materials optimization, margin enhancements, opportunistic
        growth projects and new product introductions

    Investing In Our Future
      − Recently launched state of the art Innovation Center
      − Introduced new products (Group III Synthetic Base Oil & Uninhibited Transformer Oil)
      − Expanded capacity to grow high margin Finished Lubricants & Specialty Chemicals division
      − Complementing with opportunistic M&A (Biosynthetic Technologies, LLC closed Mar’18)

                                                                                                         3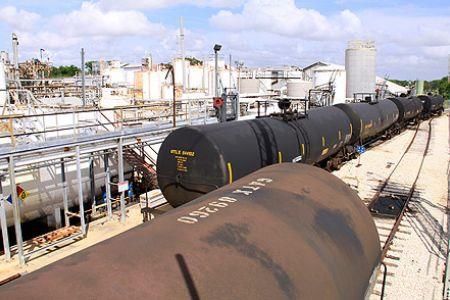
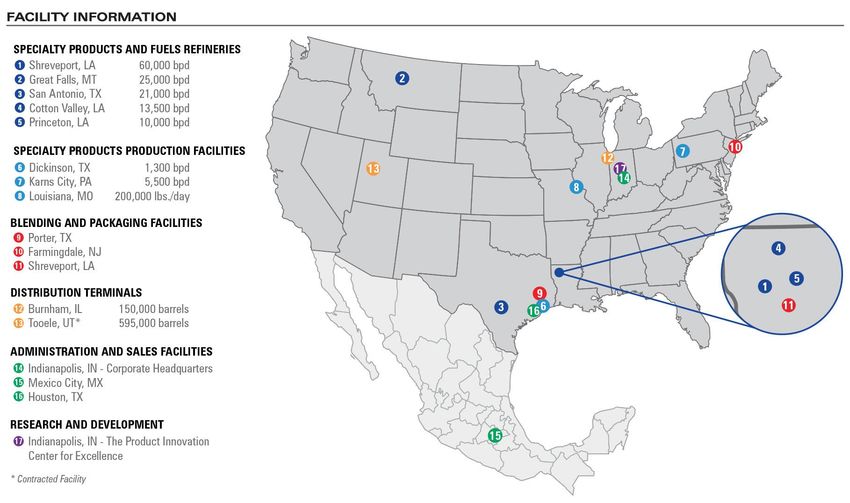
Calumet at a Glance

• NASDAQ: CLMT       • HQ: Indianapolis, IN       • 11 manufacturing facilities in 6 states
• Established 1919   • New Leadership 2016/2017   • Production capacity ~140,000 bpd

         A leading independent producer of high-quality, specialty
                          hydrocarbon products                                                4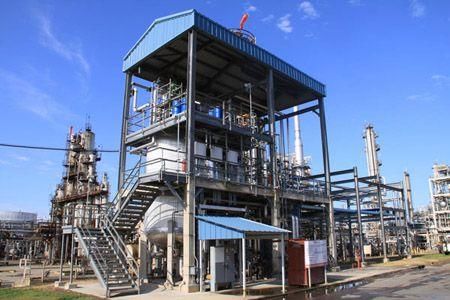
Product Portfolio Supports The Things You Use Every Day

    ▪ Manufacturer of key components and solutions for numerous branded products that consumers use
      every day

         −   Highly customized formulations

         −   Stringent certifications, approvals and qualification requirements

         −   Very strong and sticky/loyal customer base

                                                                           NOTE: The above customer trademarks are the property of their respective owners.

Proud to partner with the world’s best companies to help deliver some of
                    the world’s most trusted brands.                                                                                                          5
Our Transformation

         2016: Reset                     2017: Execute                      2018      Transform
                                                                          & Beyond:

▪ Refocused operations on what Calumet does best – creating premium, specialty products

     −    Rationalized asset portfolio

     −    Reduced exposure to commodity-oriented businesses

     −    Initiated corporate culture change focused on cost and capital discipline

▪ Restructured specialty segment to focus on four product lines

     −    Appointed dedicated general managers to drive P&L ownership and accountability

     −    Supported by realigned sales teams, business development and analytical support

▪ Instituted three-year self-help program to realize $150-$200 million of additional EBITDA by 2019

▪ Refocused business on product innovation to grow EBITDA

                                                                                                      6
Calumet is First and Foremost a Specialty Company
                                                                                                           1,2
       TTM ADJUSTED EBITDA BY SEGMENT                                                                                   TTM SPECIALTY SALES BY PRODUCT
                                                                                                                                                                      1,2

                                                                                                                                                            Brand-
                                                                                                                                                            Driven
                                                                                                                                                            ~20%
                                                                                  Specialty                                                Price-
                                    Fuel
                                                                                  Products                                                 Driven
                                 Products
                                                                                                                                           ~40%
                                   25%                                              75%                                                                    Quality-
                                                                                                                                                           Driven
                                                                                                                                                            ~40%

                                                           LOWER MARGIN                                                                               LOWER VOLUME

                                                        “PRICE-DRIVEN”                          “QUALITY-DRIVEN”                       “BRAND-DRIVEN”
                                                        ▪ Solvents                              ▪   Naphthenic Base Oils
                                                                                                                           3
                                                                                                                                       ▪ Finished Lubricants &
                                                                               3
                                                        ▪ Paraffinic Base Oils                  ▪   White Oils 3                         Chemicals (Royal Purple,
                                                                                                ▪   Petrolatums                          Bel-Ray, TruFuel)
                                                                                                ▪   Esters                             ▪ Cosmetic and Pharma
                                                                                                                                                              3
                                                                                                ▪   Waxes                                white oils (Penreco)
                                                                                              Prioritizing Higher Margin Initiatives

                                                           HIGHER VOLULME                                                                             HIGHER MARGIN

1   Adjusted for 2017 asset divestitures
2   Trailing Twelve Months ended March 31, 2018                                                                                                                             7
3   Lubricating Oils = Paraffinic Base Oils + Naphthenic Base Oils + White Oils
Participating in Multiple Attractive End Markets

                                                   Paints                                               Industrial &
                                        Auto                 Pharma & Fine     Dietary     U.S. Water                   Personal Care
                                                     &                                                  Institutional
                                    Aftermarket                Chemicals     Supplements   Treatment                     Chemicals
                                                  Coatings                                                Cleaning

         Large Global Addressable
                  1                   $650B       $180B         $80B           $39B          $13B          $12B             $8B
         Markets

         Attractive
                            1         4-5%         5-6%          6%             5-6%          6%           4-5%            5-6%
         Growth Profiles

         Base Oils                     ✓                                                                    ✓
         Solvents                      ✓            ✓                                         ✓             ✓               ✓
         White Oils & Petrolatums                                ✓              ✓                           ✓
         Waxes                                      ✓                                                       ✓               ✓
         Finished Lubricants &
         Chemicals                     ✓                                                                    ✓

1   Guggenheim Securities
                                                                                                                                        8
Our Strategy & Roadmap for Growth
OUR VISION
To be the premier specialty petroleum
products company in the world.
OUR MISSION
We build high-return niche businesses through innovation,
unmatched customer service and best-in-class operations Focus portfolio on high-return,
to deliver quality products that meet the unique needs and niche specialty markets where
specifications of our customers. We capture attractive Strategic we are competitively advantaged
opportunities where others do not. M&A
Capture one-to-two-year
Opportunistic Growth payouts with low capital
Projects investment requirements
Reduce costs, optimize
raw materials and
Operations Excellence enhance margins
9
Specialty Segment: Overview

Shreveport, Louisiana                Dickinson, Texas                          Porter, Texas
Paraffinic lubricating oils, waxes   White mineral oils, natural petroleum     Synthetic industrial lubricating oils,
                                     sulfonates, compressor lubricants         gear oils

Princeton, Louisiana                 Louisiana, Missouri                       Farmingdale, New Jersey
Naphthenic lubricating oils          Polyolester based synthetic               Synthetic, industrial and commercial
                                     lubricants                                lubricating oils

Cotton Valley, Louisiana             Karns City, Pennsylvania                  San Antonio, Texas
Aliphatic solvents                   Petrolatums, white oils, solvents, gels   Solvents                                 10
Specialty Segment Provides Stable EBITDA Margins
SPECIALTY ADJUSTED EBITDA MARGIN %
▪ Base business of ~$200 million
annually and growing
25%
▪ Seasonally strongest during Q1 & Q2 Quarterly
Margin %
20%
▪ Directional trend in crude oil prices TTM
(primary feedstock) impacts quarterly 15%
Margin %
margins
10%
▪ Pricing adjustments typically have 8-12
week lag time
5%
▪ Margins average ~15% on a TTM
basis, showing significant stability 0%
across the context of the full-year
11Finished Lubricants & Chemicals Opportunity
▪ Consumer-facing branded products
▪ Commands premium pricing
▪ Significantly higher EBITDA margins
▪ Growth focused opportunities
− Expanding into previously untapped markets (e.g. Royal
Purple into industrial applications)
− Recent expansions to production capacity for TruFuel
and Royal Purple
− Introduced several new products in 2017 (Group III
Synthetic Base Oil & Uninhibited Transformer Oil)
12Fuels Segment: Cost-Advantaged Crude Opportunities
▪ Three facilities: One pure-play fuels refinery & two integrated facilities (specialty chemicals and fuels products)
▪ Seasonally strongest in Q2 & Q3 (summer driving season)
▪ Focused on capturing cost-advantaged crude opportunities
− Heavy Canadian: Processing ~25,000 bpd of WCS-priced crudes
− Permian: Processing ~7,000 bpd of Midland-WTI priced crudes and targeting 17,000 bpd in 2H18
Shreveport, Louisiana Great Falls, Montana San Antonio, Texas
▪ Capacity: 60,000 bpd ▪ Capacity: 25,000 bpd ▪ Capacity: 21,000 bpd
▪ Specialty & Fuels facility ▪ Fuels refinery ▪ Historically Fuels focused, becoming
more integrated as Specialty
▪ Lower utilization rates as primary ▪ Runs up to 100% cost-advantaged
segment grows
Specialty facility in system WCS-priced crudes
13Self-Help in Action: Delivering Results
▪ Delivered $8.3 million in “self-help” during 1Q18, driven by:
− Crude sourcing and inbound logistics
− New product introductions and product upgrades
− Supply chain efficiencies
▪ Surpassed low end of original program target goal of $150-200 million
▪ Expecting to capture $40-$50 million of “self-help” in FY’18
− Opportunistic growth projects
• New Isomerate unit at San Antonio
• Naphtha upgrade project at Great Falls
− Continued growth expected in Finished Lubricants & Chemicals
− Additional raw material and supply chain initiatives, many driven
by new ERP system
14Committed to Continued Balance Sheet Improvement
NET DEBT TO LTM ADJUSTED EBITDA (LEVERAGE) RATIO
21.8x
▪ Recent S&P upgrade to B- from
CCC+
12.9x
▪ Credit metrics remain strong 9.0x
7.6x
6.6x
▪ Committed to long-term deleveraging 4.8x 4.9x
3Q16 4Q16 1Q17 2Q17 3Q17 4Q17 1Q18
LIQUIDITY AVAILABILITY ($MM) FIXED CHARGE COVERAGE RATIO (1)
(2)
(2) $458 1.7x 1.7x 1.7x
$413 $416
$388 1.5x
$365 $363 $369
1.3x
1.0x
0.6x
3Q16 4Q16 1Q17 2Q17 3Q17 4Q17 1Q18 3Q16 4Q16 1Q17 2Q17 3Q17 4Q17 1Q18
(1) Fixed Charge Coverage Ratio is defined as Adjusted EBITDA divided by consolidated interest expense (plus capitalized interest),
neither of which has been pro-forma adjusted for acquisitions or refinancing activity 15
(2) Excludes $350 million of restricted cashMultiple Expansion Opportunity
EV/EBITDA (2018E)
13x
▪ Significant discount relative to a 12x
blended multiple (Specialty & Fuels) 11x
▪ Valuation still more in line with 10x
merchant refiners today 9x
▪ Remain focused on growing higher- 8x
margin, higher-valued Finished 7x
Lubricants
6x
Merchant Calumet Specialty Finished /
Refining Chemicals Branded
Products
Source Data: Capital IQ, as of 5/30/2018. Calumet EV pro-forma to reflect redemption of senior secured notes.
Merchant Refiners consist of CVRR and VLO.
Specialty Chemicals consists of EMN, FPE3, HUN, NGVT, IPHS, IOSP, KOP, NEU, NXEO, and KWR.
16
Finished / Branded Products consists of CBT, CSWI, ECL, ITW, KMG, KRA, OMN, VVV, and WDFC.Calumet Investment Summary
Specialty Products Focus
− High margin, high touch, tailored products for long-term customers
Turnaround Strategy Progressing Well
− Executed two non-core asset divestitures in 4Q17
− Redeemed 11.5% secured notes and renewed revolver
− Committed to further leverage reduction and balance sheet improvement
“Self-Help” Driving EBITDA Improvement
− Realigned organizational structure and rebuilt culture around P&L ownership and accountability
− Targeted cost reductions, raw materials optimization, margin enhancements, opportunistic
growth projects and new product introductions
Investing In Our Future
− Recently launched state of the art Innovation Center
− Introduced new products (Group III Synthetic Base Oil & Uninhibited Transformer Oil)
− Expanded capacity to grow high margin Finished Lubricants & Specialty Chemicals division
− Complementing with opportunistic M&A (Biosynthetic Technologies, LLC closed Mar’18)
17APPENDIX
Supplemental Financial Data
18EXHIBIT A: Biosynthetic Technologies: Overview
▪ Proprietary technology converts renewable plant oils into high-performance specialty products
− Exceptional qualities for high performance synthetic lubricants
− Extremely rigorous environmental specifications
Renewable − Industrial proof-of-concept at commercial scale to be
plant oils conducted at Calumet’s existing esters plant in
Missouri
Proprietary
technology − Diverse specialty product applications under
development at our New Product Innovation Center
Exceptional − Calumet and The Heritage Group are actively
product qualities exploring third party commercial participation
19Biosynthetic Technologies: Opportunity
▪ Products deliver exceptional technical performance:
− Increased oil longevity and low evaporation rates, while maintaining safety and high viscosity
index in high temperature environments
▪ Also meets stringent environmental specifications for biodegradability, bioaccumulation and toxicity
Market/Product Applications & Total Addressable Market (1)
Automotive Industrial Marine Personal Care
▪ Passenger Car Motor Oil ▪ Process Oil ▪ Hydraulic ▪ Cosmetics
▪ Truck Engine Oil ▪ Hydraulic Oil ▪ Grease ▪ Emollients
▪ Scooter / Motorcycle Oil ▪ Compressor Fluid ▪ Gear Oil ▪ Other Products
▪ Transmission Fluid ▪ Grease ▪ Trunk Piston Oil
▪ Gear Oil;Grease ▪ Metalworking Fluid ▪ Cylinder Oil
Total Addressable
Market
$87.1B $64.5B $13.1B $12.0B
(1) Sources: Accuray Research LLP for Automotive market, Markets and Markets for Industrial market and Global Market Insights for Marine and Personal Care
20
markets. Estimate years range from 2021 to 2025.Biosynthetic Technologies: Robust IP Portfolio
▪ BT Patents: 71 issued patents
Oleic-based
Estolide molecules
− 54 issued U.S. patents
Non-oleic based − 17 issued Int’l patents
Estolide molecules − 22 pending U.S. patent applications
Catalysts
− 54 pending Int’l applications
for Estolide synthesis
− None expire before 2032
Continuous and semi-continuous
Estolide production process ▪ Exclusive licensee of 2 original estolide patents
By-products from USDA
from Estolide synthesis
▪ Patent portfolio creates a broad and deep barrier to
Varying Estolide entry, protecting the company and our customers
viscosity grades
▪ BT continues to file patent applications to extend its
Estolide end product formulations
IP ownership in the bio-based synthetic oils sector
Estolide end product applications ▪ All IP now owned exclusively by Calumet and
The Heritage Group
21Exhibit B: Historical Adjusted EBITDA by Segment ($MM)
$101.6
$95.7
$70.0 $78.7 $75.0
$34.0
$18.9 $46.3
$6.6 $53.9 $36.8
$38.7
$13.8 $41.2
($37.6) $27.7
$67.1 $10.7
$58.5 $59.0 $3.2 $43.0
$45.6
$43.4 $37.7
$28.0 $30.8
$29.3
$0.5
$6.4
($7.1) ($5.9) ($7.9)
($3.3) ($3.5) ($3.7) ($0.3) ($1.4)
($46.0)
($59.8)
4Q15 1Q16 2Q16 3Q16 4Q16 1Q17 2Q17 3Q17 4Q17 1Q18
Discontinued Operations Specialty Products Segment Fuel Products Segment
22Exhibit C: Adjusted EBITDA Bridge – 1Q17 vs. 1Q18 ($MM)
$29.1
$8.9
$78.7 $16.6 $8.3 $75.0
($28.7)
($10.9)
($8.0)
($19.0)
1Q17 YTD Adj Divestitures Fuels Specialty Other (1) Volume Operating SG&A "Self-Help" 1Q18 YTD Adj
EBITDA Margin Margin Costs (2) Program Benefit EBITDA
(1) Includes mark-to-market, LCM, acquisition costs, hedging activities, and Superior Renewable
Identification Numbers (“RINs”) exemption.
(2) Includes RINs costs.
23Exhibit D: Cash Bridge – 4Q17 vs. 1Q18 ($MM)
$31.5 $28.0
$514.3 $496.6
$(47.4) $(28.2) $(1.6)
4Q17 Cash Operating Cash Flow Proceeds from sale of Working Capital Capital Expenditures Other 1Q18 Cash
business
24Exhibit E: Historical and Projected Capital Spending ($MM)
$425 ▪ 2018 CapEx forecast of $80-$90 million
▪ Heavier turnaround and maintenance
activity for the full-year, concentrated in
Q1 & Q3 timeframes
$122
$80
$80
$23 to
$90
2015 Capital 2016 Capital(1) 2017 Capital Spending 2018 First Quarter 2018 Forecast Capital
Spending Spending Spending Capital Spending
Spending
(1) Includes $36 million of contributions to DPR and $29 million of proceeds related to the sale of unconsolidated affiliates
25Exhibit F: Hedged a Portion of Anticipated 2019 WCS
Purchases & 2019 Diesel Sales
Average WCS % of WTI: 65.25% Average Diesel Crack % of WTI: 137.28%
BPD BPD
3,000 3,000
2,500 2,500
2,000 2,000
1,500 1,500
1,000 2,000 1,000 2,000
500 500
0 0
2019 2019
26EXHIBIT G: Capital Structure Overview
Actual Actual Actual Actual Actual Actual Actual Actual
($ in millions) 6/30/16 9/30/16 12/31/16 3/31/17 6/30/17 9/30/17 12/31/17 3/31/18
Cash $ 32.2 $ 17.8 $ 4.2 $ 4.6 $ 26.6 $ 26.5 $ 514.3 $ 496.6
ABL Revolver Borrowings $ 0.1 $ 0.1 $ 10.2 $ 39.2 $ 0.4 $ 0.1 $ 0.2 $ -
7.625% Senior Notes due 2022 $ 350.0 $ 350.0 $ 350.0 $ 350.0 $ 350.0 $ 350.0 $ 350.0 $ 350.0
6.50% Senior Notes due 2021 $ 900.0 $ 900.0 $ 900.0 $ 900.0 $ 900.0 $ 900.0 $ 900.0 $ 900.0
7.75% Senior Notes due 2023 $ 325.0 $ 325.0 $ 325.0 $ 325.0 $ 325.0 $ 325.0 $ 325.0 $ 325.0
11.50% Senior Secured Notes due 2021 $ 400.0 $ 400.0 $ 400.0 $ 400.0 $ 400.0 $ 400.0 $ 400.0 $ 400.0
Note Payable - related party $ 40.7 $ 19.6 $ - $ - $ - $ - $ - $ -
Capital Leases $ 45.6 $ 47.5 $ 46.5 $ 45.9 $ 45.2 $ 44.7 $ 44.0 $ 43.7
Other $ - $ 4.6 $ 8.0 $ 7.6 $ 7.3 $ 6.9 $ 6.6 $ 6.3
Total Debt $ 2,061.4 $ 2,046.8 $ 2,039.7 $ 2,067.7 $ 2,027.9 $ 2,026.7 $ 2,025.8 $ 2,025.0
Partners’ Capital $ 331.5 $ 294.2 $ 218.7 $ 213.3 $ 224.0 $ 201.6 $ 119.9 $ 115.4
Total Capitalization $ 2,392.9 $ 2,341.0 $ 2, 258.4 $ 2, 281.0 $ 2,251.9 $ 2,228.3 $ 2,145.7 $ 2,140.4
LTM Adjusted EBITDA (as reported) $ 114.4 $ 92.9 $ 158.2 $ 230.3 $ 261.9 $ 303.7 $ 317.2 $ 313.5
Net Debt / LTM Adjusted EBITDA (as reported) 17.7 x 21.8 x 12.9 x 9.0 x 7.6 x 6.6 x 4.8 x 4.9 x
Net Debt / Total Capitalization 85% 87% 90% 90% 89% 90% 93% 93%
27EXHIBIT H: Reconciliation of Segment Adjusted EBITDA to Net
Income (Loss)
12/31/15 3/31/16 6/30/16 9/30/16 12/31/16 3/31/17 6/30/17 9/30/17 12/31/17 3/31/18
($ in millions)
Segment Adjusted EBITDA
Specialty products Adjusted EBITDA $ 29.3 $ 58.5 $ 59.0 $ 43.4 $ 28.0 $ 45.6 $ 67.1 $ 43.0 $ 30.8 $ 37.7
Fuel products Adjusted EBITDA (59.8) (46.0) 18.9 13.8 3.2 36.8 34.0 46.3 10.7 38.7
Discontinued operations Adjusted EBITDA (7.1) (5.9) (7.9) (3.3) (3.5) (3.7) 0.5 6.4 (0.3) (1.4)
Total segment Adjusted EBITDA $ (37.6) $ 6.6 $ 70.0 $ 53.9 $ 27.7 $ 78.7 $ 101.6 $ 95.7 $ 41.2 $ 75.0
Less:
Unrealized (gain) loss on derivative
Instruments $ 11.8 $ (4.6) $ (23.8) $ 4.9 $ 3.6 $ (10.6) $ (1.3) $ - $ (1.4) $ (2.0)
Realized gain (loss) on derivatives, not
included in net income (loss) or settled in
a prior period (1.6) (2.1) (2.3) (4.8) 2.8 - - 9.7 - -
Amortization of turnaround costs 9.6 9.1 8.3 7.9 7.9 7.4 6.6 6.4 3.9 3.3
Debt extinguishment costs - - - - - - - - - 0.6
(Gain) loss on the sale of businesses, net - - - - - - - - (173.4) -
Impairment charges - - 33.4 - 2.5 0.4 - - 206.9 -
Loss on sale of unconsolidated affiliate - - 113.9 - - - - - - -
Non-cash equity based compensation and
other non-cash items 3.0 2.6 1.5 (2.2) 3.1 2.8 2.2 7.3 3.6 3.2
EBITDA $ (60.4) $ 1.6 $ (61.0) $ 48.1 $ 7.8 $ 78.7 $ 94.1 $ 72.3 $ 1.6 $ 69.9
Less:
Interest expense $ 25.0 $ 30.3 $ 42.8 $ 44.6 $ 44.0 $ 43.9 $ 44.5 $ 47.4 $ 47.3 $ 45.2
Depreciation and amortization 38.0 38.8 43.8 44.5 44.0 41.1 40.9 48.6 37.9 29.7
Income tax expense (benefit) (6.6) 0.2 0.3 (7.6) (0.6) (0.1) (0.9) (0.1) - (0.2)
Net income (loss) $ (116.8) $ (67.7) $ (147.9) $ (33.4) $ (79.6) $ (6.2) $ 9.6 $ (23.6) $ (83.6) $ (4.8)
28CONTACT INFORMATION
Joe Caminiti or Chris Hodges
Alpha IR
312-445-2870
Email: CLMT@alpha-ir.com
29You can also read