Influence of O2 on the Erosion-Corrosion Performance of 3Cr Steels in CO2 Containing Environment - MDPI
←
→
Page content transcription
If your browser does not render page correctly, please read the page content below
materials
Article
Influence of O2 on the Erosion-Corrosion Performance
of 3Cr Steels in CO2 Containing Environment
Lei Xia 1 , Yan Li 2,3, *, Leilei Ma 4 , Hongmei Zhang 1 , Na Li 1 and Zhengyi Jiang 1,5, *
 1   School of Material and Metallurgy, University of Science and Technology Liaoning, Anshan 114051, China;
     xialei0627@163.com (L.X.); lilyzhm68@163.com (H.Z.); huatsing2006@163.com (N.L.)
 2   State Key Laboratory of Metal Material for Marine Equipment and Application, Anshan 114009, China
 3   Iron & Steel Research Institutes of Ansteel Group Corporation, Anshan 114009, China
 4   Department of Information Engineering, Hebei GEO University, Shijiazhuang 050031, China;
     leilma@126.com
 5   School of Mechanical, Materials, Mechatronic and Biomedical Engineering, University of Wollongong,
     Wollongong, NSW 2522, Australia
 *   Correspondence: 2323liyan@sina.com (Y.L.); jiang@uow.edu.au (Z.J.); Tel.: +86-0412-5929551 (Z.J.)

 Received: 14 January 2020; Accepted: 4 February 2020; Published: 9 February 2020

 Abstract: With the introduction of O2 during oil and gas production, the erosion-corrosion rate of
 tubing steels increases; the objective of this report is to explore the reason for this. Erosion–corrosion
 experiments were performed in environments of CO2 and CO2 –O2 , respectively. Macrographs,
 microstructures, and the compositions of erosion-corrosion scales were investigated using a digital
 camera, scanning electron microscope (SEM), Kevex-SuperDry energy spectrometer (EDS) and X-ray
 diffraction (XRD). The results show that the erosion-corrosion products are composed of large FeCO3
 particles and some amorphous product in the CO2 environment, while they are made up of FeCO3 ,
 Fe2 O3 , Fe3 O4 , and bits of amorphous product in the CO2 –O2 environment. The interface between
 erosion-corrosion scales and the substrate of 3Cr steel is smooth, and Cr enrichment obviously exists
 in the erosion-corrosion products in the CO2 condition. However, the erosion-corrosion scale is loose
 and porous with little Cr enrichment in the CO2 –O2 environment, which makes the protectiveness of
 the erosion–corrosion scale weak, and pitting corrosion occurs. The addition of O2 may destroy the
 protective FeCO3 scale and Cr enrichment in the erosion-corrosion scale, which may be the main
 reason for the decline in the level of protectiveness of the erosion-corrosion scale, making it weak in
 terms of preventing the corrosive medium from diffusing to the substrate.

 Keywords: erosion-corrosion; 3Cr steel; CO2 ; O2

1. Introduction
      In the later stages of oilfield development, the addition of an oil displacement agent into the oil
well is a common technology used to increase oil recovery [1]. Carbon dioxide (CO2 ) has been studied
for many years as a widely-used oil displacement agent [2]. It can expand the volume and reduce
the viscosity of crude oil [3]. Much equipment employed in the production of oil and gas is made up
of steel, such as pipelines. Dry CO2 does not corrode steel. However, there is formation water in oil
and gas extraction, and this can significantly promote electrochemical corrosion in steel in humid or
water-containing environments, leading to uniform and/or local corrosion [4].
      CO2 corrosion is an important degradation mechanism for tubing in the oil and gas industries.
It could shorten the service life of pipelines and affect normal production [5–9]. In flow systems, erosion
occurs between corrosive media and pipeline materials due to their relative motion. Corrosion and
erosion will affect each other, resulting in faster failure of the pipeline. A certain amount of alloying

Materials 2020, 13, 791; doi:10.3390/ma13030791                               www.mdpi.com/journal/materials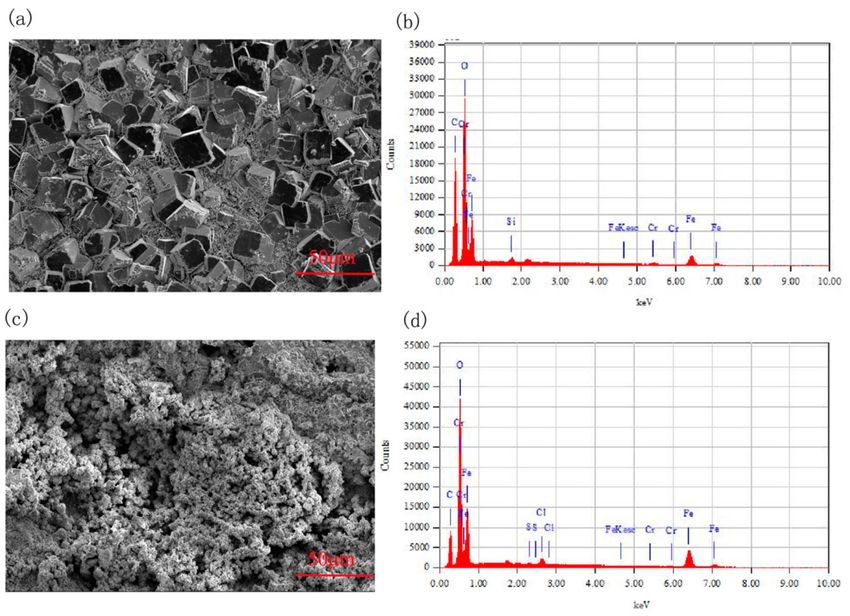
Materials 2020, 13, 791                                                                             2 of 12

elements can be doped in the steel to enhance erosion-corrosion resistance. The first choice should be
elements with good corrosion resistance and low price. Steel doped with chromium (Cr) is frequently
employed to significantly increase the anti-CO2 corrosion ability of the tubing material and decrease
the probability of local corrosion and/or pitting. The service time of the material can be significantly
extended by increasing the concentration of Cr. When the concentration of Cr reaches 3%, the corrosion
rate decreases significantly [10]. Therefore, 3Cr steel has been widely used as pipeline steel.
      O2 contamination will inevitably occur during oil and gas production by adding chemicals,
shutdowns of newly-installed piping, leaky fittings, and oil recovery [11,12]. In addition, in the process
of thickened oil thermal extraction, a high-temperature fluid which contains a great deal of oxygen (O2 )
as well as water (H2 O), CO2 , and nitrogen (N2 ) is injected into oil wells [13]. O2 coexisting with CO2
can make environmental corrosiveness more severe and cause an increase in the erosion-corrosion rate
of tubing steels [14]. Great efforts have been made to minimize CO2 corrosion [5–9], but research on
the erosion-corrosion performance of tubing steels under a CO2 –O2 condition is far from adequate,
especially in terms of erosion-corrosion performance comparisons between aqueous CO2 systems with
and without O2 . In this paper, the erosion-corrosion performance of 3Cr steel in a CO2 –O2 environment
was investigated in comparison with that of a CO2 environment. The erosion-corrosion rates were
obtained by observing weight loss. Macrographs of the erosion-corrosion scale were obtained using a
digital camera. The microstructures and compositions of the erosion-corrosion scale were analyzed by
scanning electron microscopy (SEM), energy spectrometer (EDS), and X-ray diffraction (XRD).

2. Materials and Methods
     The erosion-corrosion test was conducted using high-temperature and high-pressure equipment
(HTHPE) in environments of CO2 and CO2 –O2 , respectively. Figure 1 displays a schematic diagram
of the HTHPE. It is principally composed of a gas control system, a heating system, a temperature
control system, and a rotating system. The gas control system comprises an inlet pipe, an exhaust pipe,
and a pressure gage. CO2 and/or O2 can enter the HTHPE through the air inlet pipe, and they can be
discharged from the HTHPE through the exhaust pipe. The pressure of CO2 and/or O2 in the HTHPE
is controlled by the pressure gage. The heating system can heat the HTHPE to elevate the system
temperature; the temperature is controlled by a temperature control system. There is a rotating rod
in the rotating system, and there are two stirring blades at the bottom of the rotating rod to stir the
solution in the HTHPE. Specimens can be fixed on the rotating rod and rotate with it. The shape and
size of the specimens are shown in Figure 2; they comprised a 45◦ stepped circular arc with an inner
diameter of 96 mm and a thickness of 4 mm. The width of the outer ring was 15 mm and that of the
inner ring was 12 mm.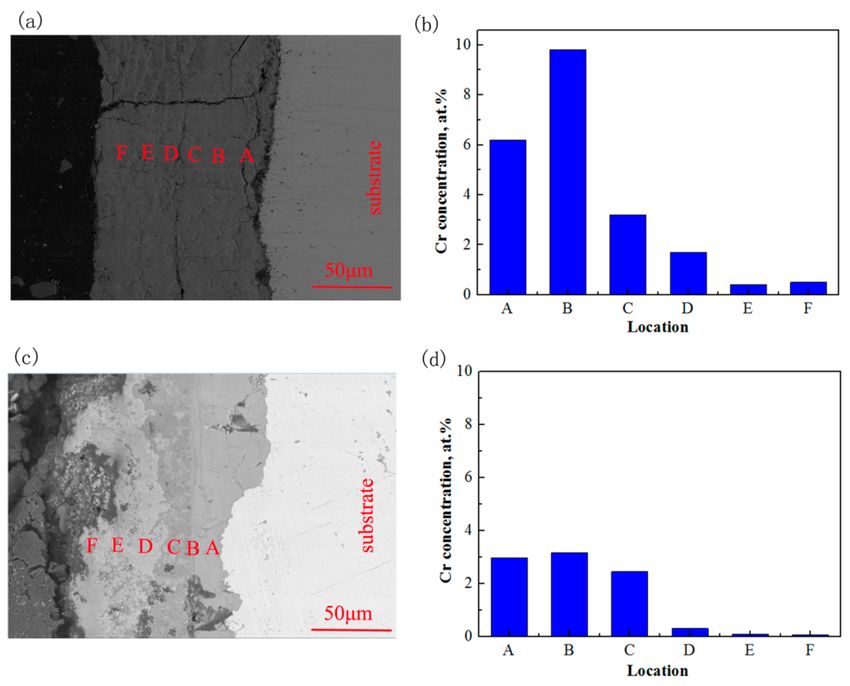
Materials 2020, 13, 791                                                                               3 of 12

                                      Figure 1. Schematic diagram of the HTHPE.

                          Figure 2. The shape and size of specimen (a) side view; (b) top view.

      The specimens were made of 3Cr steel. The chemical compositions of the tested material are as
follows: C 0.37 at.%, Si 0.48 at.%, Mn 0.51 at.%, S < 0.009 at.%, P < 0.02 at.%, Cr 3.37 at.%, Ni 0.03 at.%,
Ti 0.01 at.%; the rest is Fe. Figure 3 shows the microstructure of the specimen, which reveals acicular
ferrite. Before the experiments, the working surface of the specimens was ground with silicon carbide
paper to 800 grit. The specimens were cleaned with an ultrasonic cleaning device (GA008, Shenzhen
Guanboshi industrial technology co. LTD, Shenzhen, China) for 20 min in acetone to remove grease,
and then cleaned with alcohol and dried. They were weighed using an electronic analytical balance
with an accuracy of 0.1 mg. The surfaces of the specimens, except for the working surface, were coated
with 704 silicone rubber (Guangdong Hengda new material technology co. LTD, Huizhou, China),
so that they would be isolated from the corrosive environment. The specimens were then fixed onto
a rotating rod. Three of them are employed to study the average erosion-corrosion rate. The others
were used for analyses of the structure and composition of the erosion-corrosion products. A certain
amount of simulated solution was added to the HTHPE to simulate the water conditions of an oil
and gas field. The component concentration of the test solution is given in Table 1, which ignores
oily compounds in water extracted from the oil and gas field. The specimens were submerged in the
solution. The experiment conditions are given in Table 2. The flow velocity given in Table 2 means that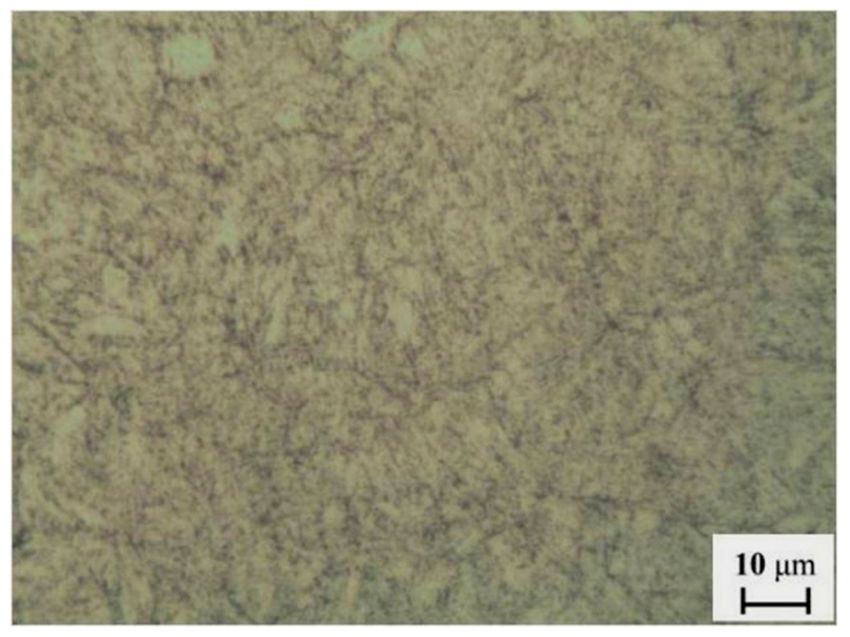
Materials 2020, 13, 791                                                                                    4 of 12

the linear velocity of the sample rotation was used to approximate the relative velocity between the
samples and the liquid.

                                        Figure 3. Microstructure of 3Cr steel.

                     Table 1. Chemical composition of formation water drawn from the oil field.

                                            Composition         Content (mg/L)
                                             MgCl2 .6H2 O             73.8
                                               CaCl2                 49.9
                                              Na2 CO3                383.6
                                              NaHCO3                1022.7
                                              Na2 SO4                 7.1
                                               NaCl                  543.2
                                                KCl                   1.8

                                            Table 2. Experimental parameters.

                          Pressure of CO2      Pressure of O2     Temperature    Flow Velocity     Time
          Test No.
                               (MPa)               (MPa)             (◦ C)           (m/s)        (Hour)
              A                 2.5                  0                120             1            120
              B                 2.5                 0.2               120             1            120
              C                 2.5                 0.4               120             1            120
              D                 2.5                 0.6               120             1            120

     After the erosion-corrosion experiment, the specimens were removed from the HTHPE.
The specimens were washed with deionized water and analytically pure alcohol, and then
dried. Macrographs of the erosion-corrosion scales and the metal substrate after removal of the
erosion-corrosion scales were obtained using a digital camera. The erosion-corrosion products of
three specimens were removed by chemical cleaning. The cleaning solution was made up of 500 mL
deionized water, 500 mL HCl, and 3.5 g urotropine (C6 H12 N4 ). The specimens were weighed after
wiping; the average erosion-corrosion rate was calculated using Equation (1):

                                                    8.76 × 10⁴ × (m0 − m1 )
                                             CR =                                                             (1)
                                                              Stρ

where CR is the average erosion-corrosion rate, mm/a; m0 is the weight of original specimen, g;
m1 is the weight of the specimen after removing the erosion-corrosion product film, g; t is the
erosion-corrosion time, h; ρ is the density of the specimen, g/cm3 ; and S is the erosion-corrosion surface
area of specimens, cm2 .
     The microstructure and elemental composition of the erosion-corrosion scales on the specimen
surface under different conditions were analyzed using a SEM (ULTRA 55 SEM, Carl Zeiss AG, Jena,
Germany) and EDS (INCA X-MAX 50 EDS, Oxford Instruments, Oxford, UK). The erosion-corrosion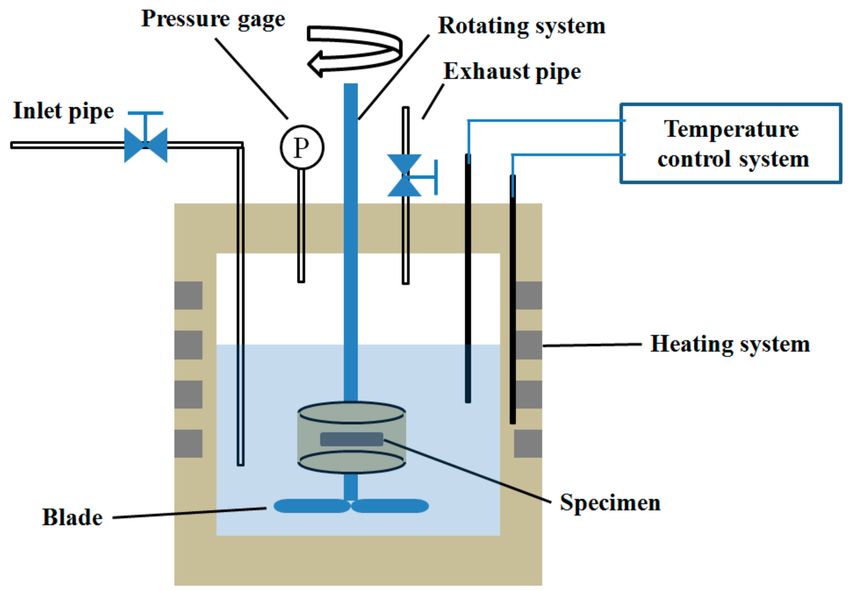
Materials 2020, 13, 791 5 of 12
product powder was prepared by scraping the erosion-corrosion product off the surface of the specimens
with a blade, and a semiquantitative analysis of the erosion-corrosion product film was carried out
by XRD (D8 Advance XRD, Bruker Corporation, Karlsruhe, Germany) with the internal standard of
ZnO [15]. The mass ratio of ZnO and erosion-corrosion products was 3:7.
3. Results and Discussion
The average erosion-corrosion rate of the 3Cr steel was calculated after the erosion-corrosion
experiments; the results are shown in Figure 4. It turns out from the data in Figure 4 that the
erosion-corrosion rate increased as the O2 partial pressure went up. There was a significant difference
in the erosion-corrosion rate of 3Cr steel comparing the CO2 and the CO2 –O2 conditions. It was only
about 0.5 mm/a in the CO2 environment, but increased significantly when there was 0.2 MPa O2 in
the environment, reaching about 4.3 mm/a. Compared with the change from 0 MPa to 0.2 MPa in the
partial pressure of O2 , the erosion-corrosion rate of 3Cr steel increased slowly when the O2 partial
pressure increased from 0.2 MPa to 0.6 MPa.
Figure 4. Average erosion-corrosion rate of 3Cr steel.
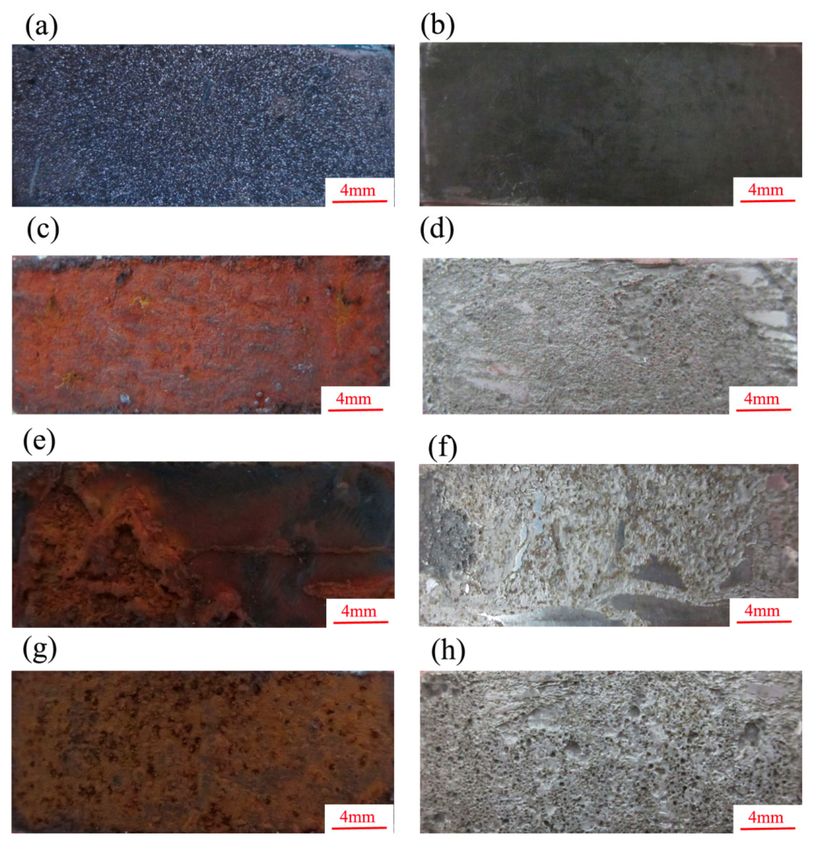
The macrostructure of the erosion-corrosion scales and the substrate after the removal of the
erosion-corrosion products are presented in Figure 5. As shown, the erosion-corrosion products were
dense, and the substrate was flat and smooth under the condition of CO2 (Figure 5a,b). In the CO2 –O2
environment, the erosion-corrosion product was loose and reddish-brown (Figure 5c,e,g); the surface
of the substrate after their removal was quite rough, with several pits of different sizes (Figure 5d,f,h).
A certain amount of erosion-corrosion product fell off the surface of the specimens when the pressure
of O2 was 0.6 MPa in the environment.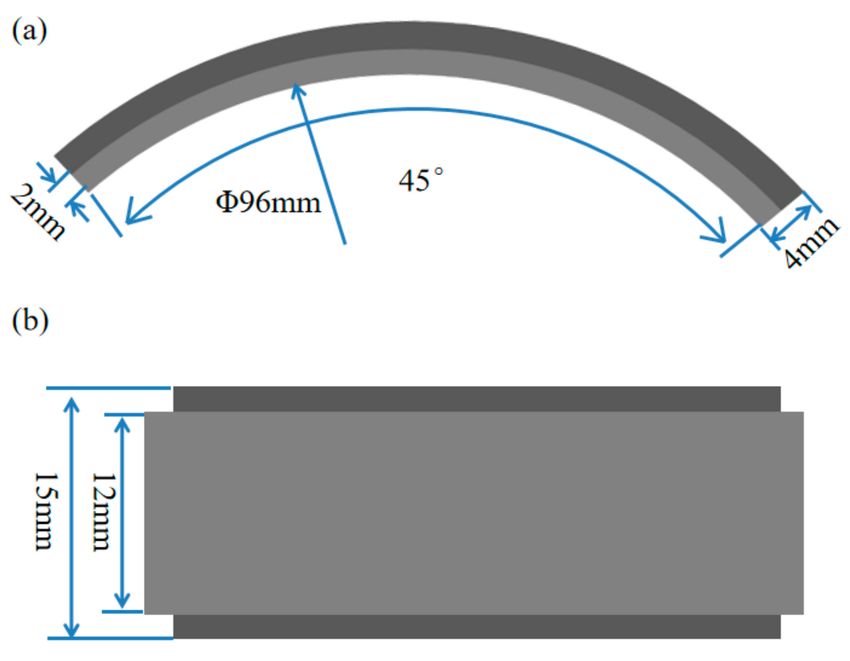
Materials 2020, 13, 791                                                                                         6 of 12

      Figure 5. Macrostructure of erosion-corrosion products and substrates after removal erosion-corrosion
      products under different conditions (a) PCO2 : 2.5 MPa, erosion-corrosion product, (b) PCO2 : 2.5 MPa,
      substrate, (c) PCO2 : 2.5 MPa, PO2 : 0.2 MPa, erosion-corrosion product, (d) PCO2 : 2.5 MPa, PO2 : 0.2 MPa,
      substrate, (e) PCO2 : 2.5 MPa, PO2 : 0.4 MPa, erosion-corrosion product, (f) PCO2 : 2.5 MPa, PO2 : 0.4 MPa,
      substrate, (g) PCO2 : 2.5 MPa, PO2 : 0.6 MPa, erosion-corrosion product, (h) PCO2 : 2.5 MPa, PO2 : 0.6
      MPa, substrate.

     To further explore the microstructure and components of the erosion-corrosion products in CO2
and CO2 –O2 environments, SEM and EDS analysis were performed. The micro image and elemental
composition are set out in Figure 6 and Table 3. From Figure 6, we can see that grains of different sizes
are stacked tightly on the sample surface in the CO2 environment, while there are no obvious grains on
the surface of the specimen; the shape of the erosion-corrosion products is irregular in the CO2 –O2
environment. The components of the erosion-corrosion scales were mainly elemental C, O, and Fe in
the CO2 and CO2 –O2 environments. The atomic ratio of elemental O and Fe was about 3 under the
condition of CO2 , while it was about 1.7 in the CO2 –O2 environment. The elemental Cr content in
the erosion-corrosion products was obviously lower than that in the substrate of 3Cr steel under the
conditions of CO2 and CO2 –O2 .
Materials 2020, 13, 791 7 of 12
Figure 6. SEM and elemental analysis of erosion-corrosion products in CO2 and CO2 –O2 environments
(a) PCO2 : 2.5 MPa, surface morphology, (b) PCO2 : 2.5 MPa, elemental analysis, (c) PCO2 : 2.5 MPa, PO2 :
0.6 MPa, surface morphology, (d) PCO2 : 2.5 MPa, PO2 : 0.6 MPa, elemental analysis.
Table 3. Quantitative EDS results of erosion-corrosion products of the tested material under
different conditions.
Elements Concentration, at.%
Conditions
C O S Cl Cr Si Fe
PCO2 : 2.5 MPa 50.23 37.79 - - 0.65 0.29 11.04
PCO2 : 2.5 MPa PO2 : 0.6 MPa 28.54 43.96 0.10 0.90 0.13 - 26.36
The composition of the erosion-corrosion products under different conditions was also analyzed
by XRD, as set out in Figure 7. The data obtained from Figure 7 indicates that the erosion-corrosion
scale was generally made up of FeCO3 in the CO2 environment, which is consistent with the atomic
ratio of elemental O and Fe in Table 3. In addition to FeCO3 , there were also Fe2 O3 and Fe3 O4 in
the erosion-corrosion products under the condition of CO2 –O2 . There was also a certain amount
of amorphous erosion-corrosion product in the CO2 and CO2 –O2 environments. Kermani et al.
demonstrated that doping steel with Cr causes the erosion-corrosion product film to transform from a
crystalline to an amorphous state, the composition of which is mainly Cr(OH)3 , Cr2 O3 and/or some
FeCO3 [16]. Comparing with the CO2 environment, there were fewer amorphous erosion-corrosion
products in the CO2 –O2 environment. A semiquantitative calculation of the crystalline erosion-corrosion
scales of the tested steels is presented in Table 4. The data shows that the quantity of FeCO3 decreases,
and the amount of Fe2 O3 and Fe3 O4 increases when the O2 pressure rises from 0 MPa to 0.4 MPa.
However, there was some increase for the amount of FeCO3 , while the amount of Fe2 O3 and Fe3 O4
decreased when the O2 pressure reached 0.6 MPa.Materials 2020, 13, 791 8 of 12
Figure 7. XRD analysis of erosion-corrosion products of 3Cr steel under different conditions (a) PCO2 :
2.5 MPa, (b) PCO2 : 2.5 MPa, PO2 : 0.2 MPa, (c) PCO2 : 2.5 MPa, PO2 : 0.4 MPa, (d) PCO2 : 2.5 MPa, PO2 :
0.6 MPa.
Table 4. XRD semiquantitative calculation data of erosion-corrosion scales of tested steels in
different conditions.
XRD Results, wt %
Tested Conditions
FeCO3 Fe3 O4 Fe2 O3
PCO2 : 2.5 MPa 100 – –
PCO2 : 2.5 MPa, PO2 : 0.2 MPa 33.2 19.0 47.8
PCO2 : 2.5 MPa, PO2 : 0.4 MPa 24.0 26.2 49.8
PCO2 : 2.5 MPa, PO2 : 0.6 MPa 34.5 33.4 32.1
Figure 8 displays the cross-section morphologies and the concentration of Cr in the erosion-
corrosion products under CO2 and CO2 –O2 environments. As shown in Figure 8, the interface between
the erosion-corrosion products and the substrate was flat in the CO2 environment. The concentration
of Cr increases and then decreases gradually with the erosion-corrosion product from inside to outside.
Comparing with the Cr element concentration in the steel substrate, it was obviously higher in the
erosion-corrosion product near the substrate. The erosion-corrosion products may be divided into two
distinct layers, and the interface between erosion-corrosion products and the substrate is relatively
rough in the CO2 –O2 environment. The concentration of Cr in the inner erosion-corrosion product
was similar to that of the substrate. However, there was only a small amount of Cr in the outer
erosion-corrosion product under the condition of CO2 –O2 .Materials 2020, 13, 791 9 of 12
Figure 8. Cross-section morphologies and Cr elements concentration of erosion-corrosion product
(a) PCO2 : 2.5 MPa, Cross-section morphology, (b) PCO2 : 2.5 MPa, Cr element concentration,
(c) PCO2 : 2.5 MPa, PO2 : 0.6 MPa, Cross-section morphology, (d) PCO2 : 2.5 MPa, PO2 : 0.6 MPa,
Cr element concentration.
In the CO2 environment, CO2 can react with H2 O to form H2 CO3 , and some H2 CO3 will be
further dissociated to H+ , HCO3 - , and CO3 2− in the solution (Equation (2)–(4)). Therefore, the solution
is slightly acidic. A lot of micro-corrosion cells can be formed at the interface between the 3Cr steel
and the solution. The H+ is oxidized to hydrogen (H2 ), and Fe and Cr are reduced to Fe2+ and Cr3+
(Equation (5)–(7)). The solution on the steel surface gradually becomes slightly alkaline as the reaction
progresses. The OH− can react with Cr3+ to form Cr(OH)3 near the 3Cr steel surface (Equation (9)).
Because the solubility product (Ksp ) of Cr(OH)3 is quite small, i.e., 6.3 × 10⁻³¹ , some Cr(OH)3 may
further react to form Cr2 O3 , according to Equation (10). Fe2+ can react with CO3 2− to form FeCO3
(Equation (11)), and the FeCO3 will be deposited on the surface of metal to form an erosion-corrosion
product film. However, the generation of FeCO3 occurs later than that of Cr(OH)3 , because the
Ksp of FeCO3 (3.2 × 10⁻¹¹ ) is larger than that of Cr(OH)3 . That may be the reason why there is Cr
enrichment in the inner erosion-corrosion scale in Figure 8b. Cr(OH)3 and Cr2 O3 are amorphous,
so they are not recognized by XRD in Figure 7. The erosion-corrosion scale is dense and stable in
terms of preventing the corrosive medium from reaching the surface of the substrate effectively [17].
Therefore, the erosion-corrosion rate of 3Cr steel is quite low under the condition of CO2 (Figure 4).
H2 O + CO2 → H2 CO3 (2)
H2 CO3 → H+ + HCO−
3 (3)
+
HCO− 2−
3 → H + CO3 (4)
2H+ + 2e → H2 (5)
Fe − 2e → Fe2+ (6)Materials 2020, 13, 791 10 of 12
Cr − 3e → Cr3+ (7)
H2 O → H+ + OH− (8)
Cr3+ + 3OH− → Cr(OH)3 (9)
2Cr(OH)3 → Cr2 O3 + 3H2 O (10)
Fe2+ + CO2−
3 → FeCO3 (11)
O2 may react with H2 O and form OH- near the 3Cr steel surface (Equation (12)). The solution will
become alkaline. Fe2+ can be oxidized to Fe3+ by O2 (Equation (13)). Fe2+ and Fe3+ react with OH- to
form Fe(OH)2 and Fe(OH)3 (Equation (14), (15)). Some Fe(OH)2 will be further oxidized to Fe(OH)3
by O2 (Equation (16)). Fe2 O3 and Fe3 O4 can be formed through Equation (17) and (18). Some FeCO3
may be oxidized to Fe2 O3 according to Equation (19). Cr(OH)3 , Fe2 O3 and/or Fe3 O4 may deposit
on the surface of 3Cr steel simultaneously, which is not conducive to the formation of a dense and
protective erosion-corrosion scale film. The erosion-corrosion scale will be loose and porous, so that a
corrosive medium cannot be prevented from reaching the substrate of the steel under the condition of
CO2 –O2 . Thus, the erosion-corrosion rate increases significantly when O2 is present in the environment
(Figure 4). There will be more dissolved O2 in the solution and at the interface of 3Cr steel and the
solution, with the partial pressure of O2 increasing. This is conducive to the formation of Fe2 O3
and/or Fe3 O4 according to Equation (12)–(19) (Table 4), which will accelerate the erosion-corrosion
of 3Cr steel. The outer erosion-corrosion product is mainly loose Fe2 O3 and/or Fe3 O4 , which easily
falls off the surface of 3Cr steel under the action of scouring. More Fe2 O3 and/or Fe3 O4 falls off the
erosion-corrosion scales when the partial pressure of O2 reaches 0.6 MPa, resulting in a lower quantity
of Fe2 O3 and Fe3 O4 (Table 4).
2H2 O + O2 → 4OH− (12)
4Fe2+ + O2 + 2H2 O → 4Fe3+ + 4OH− (13)
Fe2+ + 2OH− → Fe(OH)2 (14)
Fe3+ + 3OH− → Fe(OH)3 (15)
4Fe(OH)2 + O2 + 2H2 O → 4Fe(OH)3 (16)
2Fe(OH)3 → Fe2 O3 + 3H2 O (17)
2Fe(OH)3 + Fe(OH)2 → Fe3 O4 + 4H2 O (18)
4FeCO3 + O2 + 4H2 O → Fe2 O3 + 4H2 CO3 (19)
4. Conclusions
The erosion-corrosion rate of 3Cr steel apparent increases when there is O2 in the CO2 environment;
this rate correlates with the partial pressure of O2 .
The erosion-corrosion product is uniform with obvious Cr enrichment in a CO2 environment,
composed of large FeCO3 particles and some amorphous erosion–corrosion products. However,
the erosion-corrosion scale is loose and porous with little Cr enrichment in CO2 –O2 environments. It is
made up of FeCO3 , Fe2 O3 , Fe3 O4 , and a bit of amorphous erosion-corrosion products.
3Cr steel exhibits excellent erosion-corrosion performance under the condition of CO2 . However,
mixing with O2 may destroy the dense and protective FeCO3 and Cr enrichment in the erosion-corrosion
product. The erosion-corrosion products become loose and porous, which is favorable for the corrosive
medium to diffuse into the steel surface and the erosion-corrosion product. Thus, the erosion-corrosion
rate increases significantly, and pitting corrosion may occur under the condition of CO2 –O2 .Materials 2020, 13, 791 11 of 12
Author Contributions: Conceptualization, Z.J.; methodology, L.X.; validation, L.X., Y.L., H.Z. and Z.J.; formal
analysis, L.X. and Y.L.; investigation, L.X., L.M. and Y.L.; resources, L.X., H.Z. and Z.J.; data curation, L.X. and
L.M.; writing—original draft preparation, L.X.; writing—review and editing, Y.L. and N.L.; visualization, L.X. and
N.L.; supervision, H.Z.; project administration, L.X. and L.M.; funding acquisition, L.X. and Z.J. All authors have
read and agreed to the published version of the manuscript.
Funding: This research was funded by the Natural Science Foundation of China (NSFC; No.51671100), the State
Key Laboratory of Metal Material for Marine Equipment and Application-School of Material and Metallurgy,
University of Science and Technology Liaoning Co-project (No. SKLMEA-USTLN 201905), the University of
Science and Technology Liaoning TalentProject (No.601010314) and the University of Science and Technology
Liaoning Young Teachers Fund (No.2019QN08).
Conflicts of Interest: The authors declare no conflict of interest.
References
1. Zhang, F.; Ouyang, J.; Ma, X.; Zhang, H.; Wang, D.; Feng, X. Enhanced oil recovery from heavy oil reservoirs
utilizing a displacement agent. Chem. Tech. Fuels Oil 2012, 48, 202–207. [CrossRef]
2. Harris, T.V.; Irani, C.A.; Pretzer, W.R. Enhanced Oil Recovery Using CO2 Flooding. U.S. Patent 4913235A,
3 April 1990.
3. Yu, B.; Li, D.Y.; Grondin, A. Effects of the dissolved oxygen and slurry velocity on erosion-corrosion of carbon
steel in aqueous slurries with carbon dioxide and silica sand. Wear 2013, 302, 1609–1614. [CrossRef]
4. Sim, S.; Bocher, F.; Cole, I.S.; Chen, X.B.; Birbilis, N. Investigating the effect of water content in supercritical
CO2 as relevant to the corrosion of carbon capture and storage pipelines. Corrosion 2014, 70, 185–195.
[CrossRef]
5. Dugstad, A. Fundamental aspects of CO2 metal loss corrosion—Part 1: Mechanism. In Proceedings of the
61st NACE Anneal Conference, San Diego, CA, USA, 12–16 March 2006.
6. Nesic, S.; Lee, K.L.J. A mechanistic model for carbon dioxide corrosion of mild steel in the presence of
protective iron carbonate films—Part 3: Film growth model. Corrosion 2003, 59, 616–628. [CrossRef]
7. Ogundele, G.I.; White, W.E. Some observations on corrosion of carbon steel in aqueous environments
containing carbon dioxide. Corrosion 2012, 42, 71–78. [CrossRef]
8. Zheng, D.; Che, D.; Liu, Y. Experimental investigation on gas-liquid two-phase slug flow enhanced carbon
dioxide corrosion in vertical upward pipeline. Corros. Sci. 2008, 50, 3005–3020. [CrossRef]
9. Farelas, F.; Galicia, M.; Brown, B.; Nesic, S.; Castaneda, H. Evolution of dissolution processes at the interface
of carbon steel corroding in a CO2 environment studied by EIS. Corros. Sci. 2010, 52, 509–517. [CrossRef]
10. Nice, P.I.; Ueda, M. The effect of microstructure and chromium alloying content to the corrosion resistance
of low-alloy steel well tubing in seawater injection service. In Proceedings of the 53rd NACE Anneal
Conference, Houston, TX, USA, 22–27 March 1998.
11. Martin, R.L. Corrosion consequences of oxygen entry into sweet oilfield fluids. In Proceedings of the SPE
Permian Basin Oil and Gas Recovery Conference Society of Petroleum Engineers, New Orleans, LA, USA,
30 September–3 October 2001.
12. Martin, R.L. Corrosion consequences of oxygen entry into oilfield brines. In Proceedings of the 57th NACE
Anneal Conference, Denver, CO, USA, 7–11 April 2002.
13. Ma, Z.H.; Sun, Y.T.; Lin, T.; Wang, S.H.; Liu, H.T.; Sun, Y.B. Investigation of corrosion behaviors of different
steels in multi-component thermal fluent. Petrochem. Ind. Appl. 2012, 31, 60–63.
14. Durr, C.L.; Beavers, J.A. Effect of oxygen on the internal corrosion of natural gas pipelines. In Proceedings of
the 51st NACE Anneal Conference, Denver, CO, USA, 24–29 March 1996.
15. Davis, B.L. Semiquantitative XRD analysis with the aid of reference intensity ratio estimates. Powder Diffr.
1998, 13, 185–187. [CrossRef]
16. Kermani, B.; Perez, T.; Morales, C.; Pigliacampo, L.; Gonzales, J.; Turconi, G. Window of application and
operational track record of low carbon 3Cr steel tubular. In Proceedings of the 61st NACE Anneal Conference,
San Diego, CA, USA, 12–16 March 2006.Materials 2020, 13, 791 12 of 12
17. Sun, J.B.; Liu, W.; Chang, W.; Zhang, Z.H.; Li, Z.T.; Yu, T.; Lu, M.X. Characteristics and formation mechanism
of corrosion scales on low-chromium X65 steels in CO2 environment. Acta Metall. Sin. 2009, 45, 84–90.
© 2020 by the authors. Licensee MDPI, Basel, Switzerland. This article is an open access
article distributed under the terms and conditions of the Creative Commons Attribution
(CC BY) license (http://creativecommons.org/licenses/by/4.0/).You can also read