PERFORMANCE AND EFFICIENCY OF A BI-FUEL BIO METHANE/GASOLINE VEHICLE
←
→
Page content transcription
If your browser does not render page correctly, please read the page content below

European Association for the                            International Conference on Renewable Energies and Power Quality
            Development of Renewable Energies,                                                    (ICREPQ’11)
          Environment and Power Quality (EA4EPQ)                           Las Palmas de Gran Canaria (Spain), 13th to 15th April, 2011

                    PERFORMANCE AND EFFICIENCY OF A BI-FUEL BIO
                           METHANE/GASOLINE VEHICLE
                           Brenda S. Lemke1, Nolan McCann2, and Ahmad Pourmovahed, Ph.D3

                                              Mechanical Engineering Department
                                                       Kettering University
                                     1700 W. University Avenue Flint, Michigan, 48504 U.S.A.
                                                                  1
                                                           Lecturer
                             Phone number: 810-762-9500 ext. 5833, e-mail: blemke@kettering.edu
                                                           2
                                                      Mechanical Engineer
                                  Phone number: 989-948-1026, e-mail: nmccann@kettering.edu
                                                                  3
                                                           Professor
                                 Phone number: 810-762-9758, e-mail: apourmov@kettering.edu

Abstract             Compressed natural gas (CNG) vehicles have               biogas in transportation and power generation
been utilized in fleet applications in the United States for                  applications. This project involved the selection and
decades. However, vehicles capable of running on both gasoline                outfitting of a vehicle with a bi-fuel CNG kit. After
and CNG are uncommon, with very few applications intending to                 investigating various vehicles and conversion
use bio methane instead of CNG. This paper discusses the                      technologies, a 2009 Chevrolet 2500 HD gasoline truck
conversion of a production vehicle running on gasoline, CNG,                  and a bi-fuel CNG conversion kit were purchased, and
and bio methane, the product of upgraded biogas. The technology               the conversion was completed at Kettering University
used in this application allows the vehicle to switch
instantaneously between the liquid and gaseous fuels without
                                                                              (Figure 1).
affecting drivability. The CNG tank is mounted in the bed of the
truck and is plumbed to the engine bay, where the fuel is injected
into the engine via natural gas fuel injectors. The vehicle is tested
for exhaust gas emissions (CO, CH4, CO2, NOx, and HC). This
article will present a detailed description of the bi-fuel vehicle,
the CNG fuel system, the test procedures followed, the
aforementioned test data, analysis of the test results, and a
comparison of the results for CNG and gasoline as fuels.

Key Words
Natural Gas Vehicle, Bi-Fuel, Biogas, Emissions

1. Introduction
                                                                                             Figure 1 - Bio Methane Truck
Kettering University (formerly GMI Engineering &
                                                                              While biogas produced through anaerobic digestion at the
Management Institute) is a fully cooperative private
                                                                              Flint Wastewater Treatment Plant is indeed a
institution that offers degree programs in engineering,
                                                                              combustible fuel, it must be upgraded to bio methane
sciences and business. In 2010, Kettering University
                                                                              before it can be used in an internal combustion engine.
received a research grant from the United States
                                                                              Biogas is about 62% methane, 37% carbon dioxide, and
Department of Energy (DOE) through the Michigan
                                                                              may have small amounts of chemical compounds
Economic Development Corporation (MEDC) to verify
                                                                              (specifically hydrogen sulfide) that can be harmful to the
and improve process parameters for the production of
                                                                              metal in an internal combustion engine. Thus, it must be
biogas at the Flint, Michigan Wastewater Treatment Plant
                                                                              upgraded to bio methane, a fuel that is 95% (or greater)
(WWTP) and to determine the feasibility of utilizing
                                                                              methane and has a reduced hydrogen sulfide content. The
bio methane can then be used in place of natural gas in the     tank, $7,900 for the conversion kit, and $4,000 for
bi-fuel truck. The only difference between bio methane          additional installation hardware and tools.
and natural gas is the source of the methane; otherwise
they are chemically interchangeable.                            The tank chosen for the bio methane truck is made of a
                                                                carbon fiber composite. It measures 21 in. x 60 in. and is
2. Brief History                                                rated for 3600 psi. The energy content of the fuel when
                                                                the tank is filled is equivalent to the energy content of 21
Although internal combustion engines were being                 gallons of gasoline (see section 8 for further detail). The
developed back into the mid 1800s, natural gas was not          mounting of the CNG fuel tank in the bed of the truck
considered as a fuel for these engines until the 1930s.         required metal straps with reinforced steel strips on the
After World War II, crude oil demand grew and the use of        underside of the bed. The composite fuel storage tank
natural gas faded. The U.S. government was evaluating           requires protection from the weather. A cover was
natural gas as a valid alternative to gasoline for vehicles     fabricated which also allows the bed to be used without
back in the 1980s. However, U.S. automakers never               worry about damage to the tank (Figure 2).
moved forward with producing natural gas vehicles
(NGVs) due to concerns regarding both profitability and
demand. Today, NGVs still only represent a fraction of all
national vehicles. [1].

Currently, the only offering from an Original Equipment
Manufacturer (OEM) in the U.S. for an NGV is the 2010
Honda Civic GX (which represents 0.3% of all 2010
Hondas sold). However, NGVs are far more prevalent in
fleet applications (such as waste trucks, service vans, etc).
But, outside of the U.S., NGVs are much more widely
used. While the number of CNG vehicles in North
America has remained relatively flat over the previous two
decades, significant growth has occurred in the Asia-
                                                                        Figure 2 - CNG Tank and Protective Cover
Pacific and Latin American regions, especially in the last
ten years [2].                                                  The CNG fuel receptacle and a second fuel door were
                                                                installed next to the gasoline fuel door for a professional
3. Vehicle Conversion                                           and factory-looking installation. Figure 3 shows both fuel
                                                                doors.
Although OEM offerings for NGVs in the U.S. are limited,
there are many available options for aftermarket
conversion. The majority of these are for trucks intended
for government and corporate fleet applications; however
there are common passenger car conversion kits available.
Without a well-developed infrastructure for NGV fuelling
in the U.S., many companies with multiple NGVs opt to
install a fuelling station on-site.

Vehicle conversion kits are available for dedicated systems
that convert the vehicle to run exclusively on CNG.
Conversely, bi-fuel conversion kits require additional fuel
and control systems be added along with the factory
system. Bi-fuel kits offer the benefit of extending the total
vehicle range. The Kettering University bio methane truck,
with both the CNG and gasoline tanks full has a range of                      Figure 3 - Dual Fuel Fill Doors
approximately 730 highway miles (240 miles on CNG and
490 miles on gasoline).                                         For a short video highlighting the main focal points of the
                                                                vehicle conversion project, visit the following link:
Conversion kits generally range from USD $7,000 to
$20,000, depending on many factors. These include, but          http://www.kettering.edu/futurestudents/undergraduate/
are not limited to, emissions certification levels, hardware    cng_truck_video.jsp
used in the fuel system, and factory electronics integration
and refinement. It is common for conversion kit companies       4. Emissions Test Procedure
to offer kits downstream of the fuel pressure regulator,
leaving the high-pressure lines and tank mounting up to         The truck was evaluated for tailpipe emissions based on a
the installer. The cost of the system used on the bio           modified EPA FTP-75 drive cycle (Figure 4). This is the
methane truck was approximately (USD) $4,100 for the            primary cycle used in vehicle emissions certification.
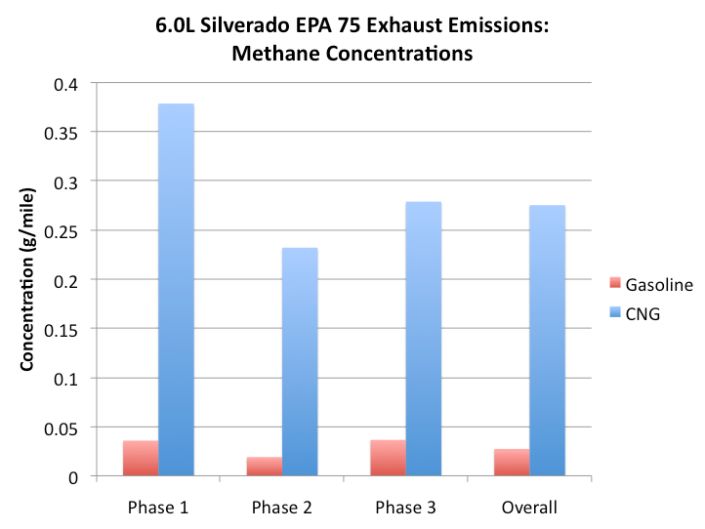
HC levels both increased by 0.24 g/mile when running on
                                                                 CNG. This is not a significant concern; the slight increase
                                                                 of CH4 output is grossly offset by the 170 g/mile
                                                                 reduction in CO2.

              Figure 4 - FTP-75 Drive Cycle [3]

Three distinct phases make up the FTP-75 cycle. The cold
start phase (phase 1) represents starting a vehicle and
almost instantly driving onto the highway. The transient
phase (phase 2) occurs immediately following the cold
start phase and consists of low speed driving. At the end of
the transient phase, the vehicle is shut off for 10 minutes,
restarted, and the hot start phase (phase 3) is then                              Figure 5 - CO Emissions
completed. This represents parking and shutting the
vehicle off for several minutes, restarting, and then
continuing to drive. The hot start phase profile is identical
to that of the cold start phase [3]. Loading coefficients
derived from vehicle coast down testing were input into
the chassis dynamometer to accurately simulate the
aerodynamic drag and rolling resistance the vehicle
experiences during on-road driving.

The natural gas conversion kit installed on the truck forces
the engine to start on gasoline, even when the natural gas
is switched on. This prevents old gasoline from remaining
in the fuel lines, clogging the gasoline fuel system if it is
not used for long periods of time. When the engine is
started, the vehicle will run on gasoline until the operating
temperature is reached and then it will switch to natural
gas. If the engine temperature is already at operating
temperature prior to start-up, the vehicle will run for 30
seconds on gasoline prior to switching to natural gas. This
                                                                             Figure 6 - Methane Concentrations
required a slight modification to the FTP-75 cycle by not
using a true “cold start” to allow the engine to run on CNG
for as much of the test duration as possible. Instead of the
test beginning as soon as the vehicle was started, it was left
to idle until the engine reached operating temperature and
the system switched to CNG as the combusted fuel.

5. Emissions Data
Figures 5 through 10 contain exhaust emissions data for
CO, CH4, CO2, NOx, hydrocarbon (HC), and non-methane
hydrocarbon (NMHC) levels measured during the testing
procedure when running on gasoline and when running on
CNG. Additionally, the applicable EPA SULEV (Super
Ultra Low Emissions Vehicle) maximum certification
level values are included for comparison where
appropriate [4]. All pollutant levels were reduced when
burning CNG as compared to gasoline with the exception
of methane and total hydrocarbon levels. CO levels were
decreased by 45%, NOX by 54%, CO2 by 22%, and                            Figure 7 - Carbon Dioxide Concentrations
NMHC by 13%. As compared to gasoline, CH4 and total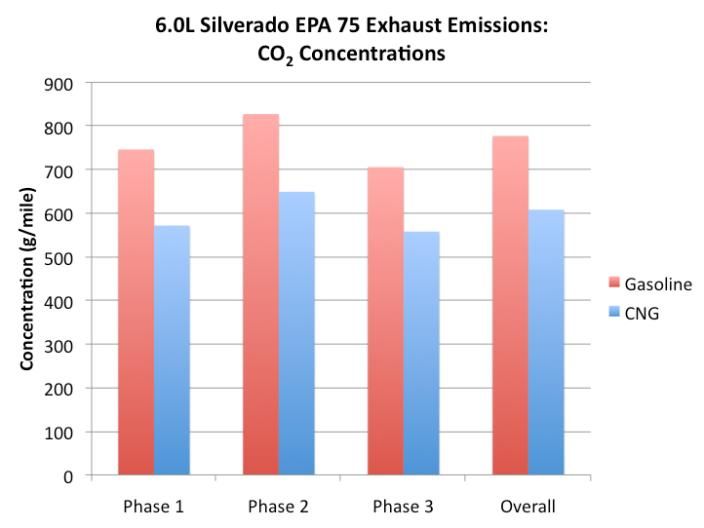
Courtesy of NGV Technologies
Figure 11 - USPS CNG Conversion Emissions [5]
Figure 8 - Nitrogen Oxide Concentrations
6. Fuel Economy
Acquiring a “city” fuel economy value for natural gas
vehicles as it is typically measured on a chassis
dynamometer during the FTP-75 drive cycle requires
significant modification of the calculations used in
producing this number. Specific fuel data (such as H:C
ratio, density, heating value, etc) are required inputs as
the fuel economy is determined based on exhaust CO2.
Although indirect, because of the accuracy of the exhaust
gas measurement instrumentation, this is a very
repeatable method of measurement and far more
convenient than attempting to directly meter fuel
consumption. The truck averaged 11.4 miles/gallon
(MPG) on gasoline and 10.7 miles per gasoline gallon
equivalent (MPGGE) on CNG based on the FTP-75 cycle
(Figure 12). Based on approximately 1100 miles of actual
Figure 9 - Hydrocarbon Concentrations highway driving, the highway fuel economy average was
14.7 MPGGE on CNG and 14.4 MPG on gasoline.
Figure 12 - Fuel Economy from FTP-75 Cycle
Figure 10 - Non-Methane Hydrocarbon Concentrations
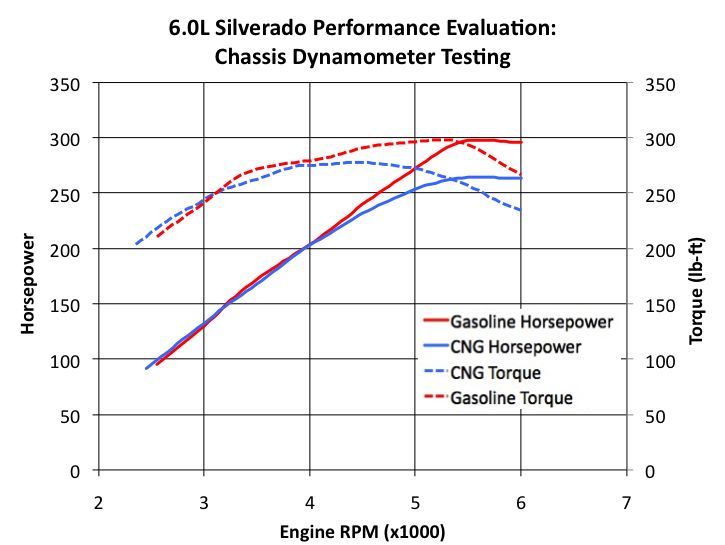
7. Performance Analysis
Emissions changes between fuels in the vehicle tested are
comparable to those of a natural gas vehicle conversion Power and torque output were measured on a chassis
done by the U.S. Postal Service in 1992 (see Figure 11) dynamometer (Figure 13) while running on CNG and
[5]. In their conversion, NMHC levels increased by 37%, gasoline. Because of natural gas being a gaseous fuel, air
but CO and NOx levels were reduced by 31% and 51%, is displaced in the higher engine RPM range and torque
respectively. This vehicle met the ULEV certification decreases. This ultimately results in around a 10%
standard in 1992 when running on CNG. decrease of peak power output. It is noteworthy that rated
engine power (353 horsepower) drops by about 15% when The following formula is used to calculate the
measured at the rear wheels while running on gasoline. temperature rise when the CNG tank is filled [7]:
This is due to driveline losses. The torque lines below
represent effective engine torque once it has gone through p2 cP Tin
the driveline losses; horsepower is measured directly at the T2 1
rear wheels, and torque is calculated based on this cv ( p2 p1 ) ( p1 c p Tin / T1 )
measurement.
Where
T2 = Final Gas Temperature
T1 = Initial Gas Temperature
Tin = Inlet (Fill) Gas Temperature
P1 = Initial Tank Pressure
P2 = Final Tank Pressure
Cp = Heat capacity at constant pressure of methane =
0.035 kJ/(mol•°K)
Cv = Heat capacity at constant volume of methane =
0.027 kJ/ (mol•°K)
This formula is used to generate a chart used for
determining the final gas temperature for a range of
initial tank pressures and initial gas temperatures (see
Figure 15.) Because this formula is applicable to ideal
gases and neglects the compressibility factor, there will
Figure 13 - Chassis Dynamometer Peak Output Plot be an anticipated margin of error.
Vehicle acceleration was also tested using a Race
Technology DL1 data logger/GPS/two axis accelerometer.
From a standing start to 60 MPH, the truck took roughly
0.7 seconds longer to accelerate while running on CNG as
compared to gasoline (Figure 14). This is expected due to
the 10% decrease in power output.
Figure 15 - Temperature Rise from Filling with CNG
Figure 14 - 0-60 MPH Acceleration Test Once the gas temperature immediately after being filled
has been found, the tank pressure can be used to find the
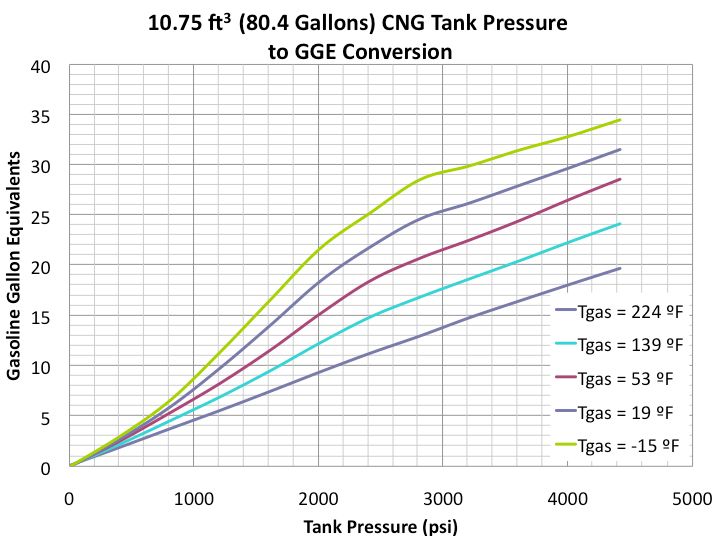
number of GGEs in the tank. Figure 16 has been
generated using basic thermodynamics, a compressibility
8. CNG Energy Content chart, fuel characteristic values, and the CNG tank
volume. The graph would be a single line strictly based
While it is known that 126 cubic feet of CNG at STP on the tank pressure, volume, and heating value of CNG
contains the same amount of energy as 1 gallon of gasoline if the fuel compressed linearly and was not affected by
(approximately 115,000 BTU) [6], estimating the number the temperature. However, because this is not true,
of gasoline gallon equivalents (GGEs) in the CNG tank multiple curves are required to convert the tank pressure
involves more than simply reading the pressure gauge after gauge reading into the number of GGEs. This is
a fill-up. Because methane is not an ideal gas, it must be accomplished by also factoring in the gas temperature
treated as having a compressibility factor. Additionally, rise as a result of filling the tank and the compressibility
the gas temperature rise during fill-up results in a pressure of the gas. The increasing nonlinearity of the curves as
increase, causing an error in energy content based on the temperature drops is due to the increasing
pressure alone. compressibility of the methane.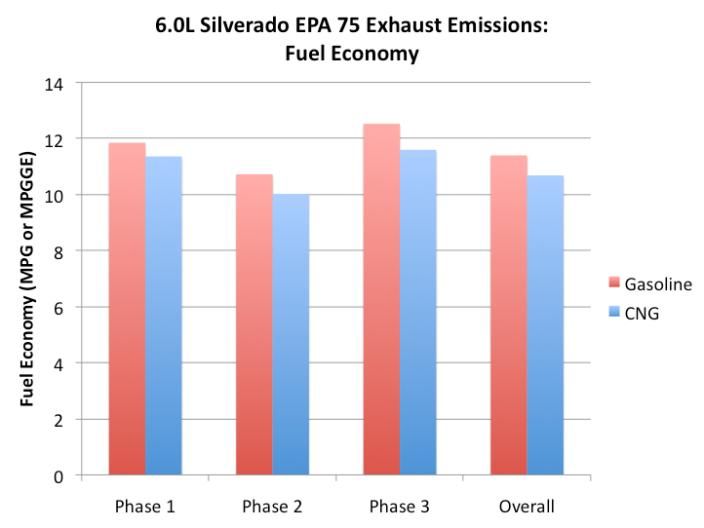
The vehicle will continue to be used both for utility and
                                                               demonstration, from the classroom to conferences to car
                                                               shows (Figure 17).

      Figure 16 - Conversion of Tank Pressure to GGE

9. Conclusions

Kettering University has acquired much new knowledge
following the completion of the bi-fuel conversion on the
                                                                 Figure 17 - Bio Methane Truck at 2011 North American
2009 Chevrolet Silverado truck. At first glance, it’s quite
                                                                      International Auto Show, Detroit, Michigan
difficult to see why natural gas vehicles have not gained
momentum and popularity in years past and why OEMs
have not brought more CNG-ready vehicles to market.
There are some performance losses which are not
insignificant, especially in an age where marginal gains in
power output are paramount to manufacturers. Yet, from         Acknowledgements
an end user standpoint, a bit of performance and fuel
economy loss are willingly absorbed when the fuel cost is      This research project was funded by the Biogas Center of
significantly lower and the pollutant output greatly           Energy Excellence grant from the United States
reduced.                                                       Department of Energy (DOE) through the Michigan
                                                               Economic Development Corporation (MEDC). The
Unfortunately, the large initial cost and poor refueling       authors are also grateful to Swedish Biogas International
infrastructure tend to deter individuals from converting to    and the City of Flint, Michigan for their support.
natural gas. Even with cost savings due to reduced fuel
prices, the return on investment where the conversion
results in a net gain can be longer than the number of miles   References
most individuals keep a vehicle. It ultimately depends on
market conditions and fuel costs, making the choice a bit      [1] History of Natural Gas Vehicles, (2008), Retrieved
of a risk in terms of cost. However, CNG conversion            January 18, 2011,
systems remain very viable alternatives to gasoline            http://www.randomhistory.com/2008/09/08_ngv.html.
vehicles for government and corporate fleet applications       [2] Natural Gas Vehicle Statistics, (2011), Retrieved
where vehicles are driven frequently and are returned to a     January 18, 2011, http://www.iangv.org/tools-
central location daily for refueling.                          resources/statistics.html.
                                                               [3] Drive Cycles, (2010), Retrieved January 18, 2011
Subjectively, this project has been very successful. Except    http://www.daham.org/basil/leedswww/emissions/drivec
for a few difficulties during the emissions evaluation, the    ycles.htm.
project went quite smoothly and resulted in a reliable         [4] Cars and Light Trucks – US EPA, (2010), Retrieved
vehicle and a quality conversion.                              January 18, 2011, http://www.epa.gov/OMS/ld-hwy.htm.
                                                               [5] Clean Vehicle Education Foundation, (2010)
Additionally, the aim of the vehicle conversion process        Retrieved January 18, 2011 www.cleanvehicle.org.
was to allow Kettering University to be a knowledge            [6] Methane, CH4, Physical Properties, (2009), Retrieved
center to support local municipalities should they opt for     January 18, 2011, http://encyclopedia.airliquide.com
CNG vehicle conversion for fleet vehicles. After the           Encyclopedia.asp?GasID=41.
completion of this project, the University is comfortably      [7] Huang, Francis, Engineering Thermodynamics. 2nd
prepared to assist in these areas. When the Flint WWTP is      ed, Macmillan Publishing Company, New York (1988),
capable of producing a sufficient quantity of bio methane,     pp. 351-353.
the performance and effects on engine wear with this new
fuel will be evaluated.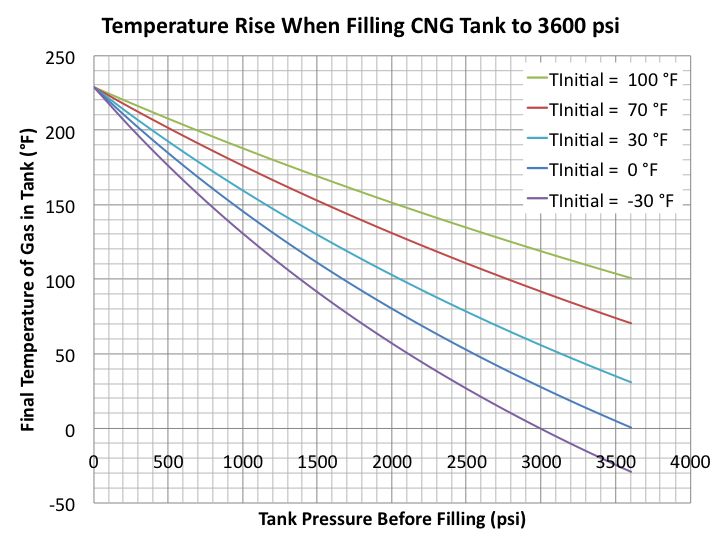
You can also read