Colorimetric Amine Detection by Vanillin-Hydrazone Derivatives during Chicken - UKM
←
→
Page content transcription
If your browser does not render page correctly, please read the page content below
Sains Malaysiana 50(4)(2021): 989-996
http://doi.org/10.17576/jsm-2021-5004-09

 Colorimetric Amine Detection by Vanillin-Hydrazone Derivatives during Chicken
                                Meat Spoilage
         (Pengesanan Amina Colorimetrik oleh Terbitan Vanilin-Hidrozon semasa Kerosakan Daging Ayam)

                          B AMBANG P URWONO*, B ETA A CHROMI N UROHMAH & S UHARMAN

                                                         ABSTRACT
Two vanillin-hydrazone compounds as the colorimetric amine detection during chicken meat spoilage are described. Two
hydrazone compounds (1 and 2) have been synthesized from the condensation reaction of vanillin with phenylhydrazine
and 2,4-dinitrophenylhydrazine. Their properties for colorimetric recognition of amine were determined by the naked
eye and UV-vis spectra. Their properties as amine indicators were investigated toward primary amine: butylamine (BA);
secondary amine: dimethylamine (DMA), diethylamine (DEA); tertiary amine: triethylamine (TEA), and also ammonia
(Amm). The hydrazone 1 in DMSO showed no significant color changes (colorless) after the addition of amines solution.
Hydrazone 2 (5×10⁻⁵ M in DMSO) showed color changes from yellow to violet in the presence of ammonia, DEA and
BA, to reddish-violet for DMA, and light brown after addition of TEA solutions. The colorimetric amine detection by
vanillin-hydrazone 2 could recognize the real amine during chicken meat spoilage from yellow to light brown after 24
h storage at room temperature.
Keywords: Colorimetric; food spoilage; hydrazone; indicator

                                                         ABSTRAK
Dua sebatian vanilin-hidrazon sebagai pengesanan am kolorimetrik semasa kerosakan daging ayam dijelaskan.
Dua sebatian hidrazon (1 dan 2) telah disintesis daripada tindak balas pemeluwapan vanilin dengan fenilhidrazin dan
2,4-dinitrofenilhidrina. Sifat mereka untuk pengecaman amina kolorimetrik ditentukan oleh mata kasar dan spektrum UV-
vis. Sifat mereka sebagai petunjuk amina dikaji terhadap amina primer: butilamina (BA); amina sekunder: dimetilamina
(DMA), dietilamina (DEA); amina tertier: trietilamina (TEA) dan juga amonia (Amm). Hidrazon 1 dalam DMSO tidak
menunjukkan perubahan warna yang ketara (tidak berwarna) setelah penambahan larutan amina. Hidrazon 2 (5 × 10⁻⁵
M dalam DMSO) menunjukkan perubahan warna daripada kuning ke ungu dengan adanya amonia, DEA dan BA, menjadi
ungu kemerahan untuk DMA dan coklat muda setelah penambahan larutan TEA. Pengesanan amina kolorimetrik oleh
vanilin-hidrazon 2 dapat mengenali amina sebenar semasa kerosakan daging ayam daripada kuning ke coklat muda
setelah penyimpanan 24 jam pada suhu bilik.
Kata kunci: Hidrazon; kerosakan makanan; kolorimetrik; penunjuk

                      I NTRODUCTION                             vomiting, fever, hypertension, and hard in breathing (Naila
A safety measurement in the consumption of food is              et al. 2010).
essential because it is related to human health. The                   Total volatile base-nitrogen (TVB-N) is described as
freshness indicators of food can be seen from the appearance,   a combination of the total amount of ammonia (Amm),
texture, color, and odor changes. Food spoilage on meat and     dimethylamine (DMA), and trimethylamine (TMA). A
fish-based food commonly occur due to the production of         high-level amount of biogenic amines and TVB-N can
biogenic amines that formed from microorganism activity.        increase as a consequence of microbial contamination or
Biogenic amines are a low molecular weight of organic           unhygienic circumstances during the manufacturing and
bases generated from decarboxylation of amino acids.            processing, as well as an inappropriate handling and storage
The formation of biogenic amines can initiate an allergic       condition (Bóka et al. 2012).
reaction in humans, characterized by itching, rash in skin,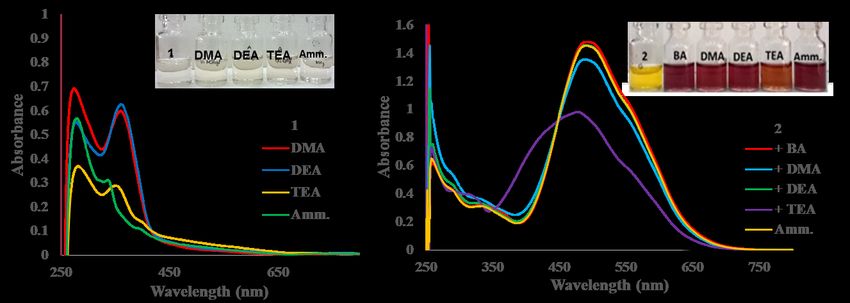
990

       Biogenic amines serve as a potential chemical           amine indicators were investigated toward primary
indicator of poor quality of meat and fish-based products      amine: butylamine (BA); secondary amine: dimethylamine
along with TVB-N and TMA. Analytical methods have              (DMA), diethylamine (DEA); tertiary amine: triethylamine
been developed for detecting to TVB-N and biogenic             (TEA), and also ammonia (Amm). Furthermore, their
amines. The amines level in food are analyzed by thin-         potential as a food spoilage indicator was performed to
layer chromatography (TLC), enzymatic, high-performance        breast chicken meat after storage for 24 and 48 h at room
liquid chromatography (HPLC), gas chromatography               temperature conditions.
(GC) , flow injection analysis (FIA), colorimetric, and
fluorometric methods (Arulkumar et al. 2017; Ruiz-Capillas                   M ATERIALS AND M ETHODS
& Herrero 2019). The identification of meat spoilage is
                                                               The chemicals used in this study were vanillin,
also developed through polymerase chain reactions (PCR),
                                                               phenylhydrazine, 2,4-dinitrophenyl hydrazine, glacial
spectroscopy, and odor sensor device (Fletcher et al. 2018).
                                                               acetic acid ( A c OH ), ethanol, ethanol, butylamine,
Polymerase chain reactions (PCR) are used to detect the
                                                               diethylamine, dimethylamine (40%), triethylamine, and
presence of some bacteria that can spoil meat samples
                                                               ammonia (32%). As for spectroscopic studies, dimethyl
such as Salmonella strains (Rodriguez-Lazaro et al.
                                                               sulfoxide (DMSO) was used as a solvent. All reagents and
2014), Brochothrix species (Gribble & Brightwell 2013),
                                                               solvents used were of analytical grade and purchased
Clostridium species (Brightwell & Clemens 2012; Reid
                                                               from E.Merck without further purification.
et al. 2017). An electronic nose (e-nose) as the gas sensor
monitored the freshness of chicken meat by employing
metal oxide sensor (MOS) system and comparing the result                          INSTRUMENTATION
with other methods (Raudienė et al. 2018).                     Structural elucidation of the prepared compound was
       Among the various detection methods, an optical         performed with Spectrophotometer FT-IR (Shimadzu
sensor is the most convenient technique of all (Chen et        Prestige-21), Spectrophotometer 1H- and 13C-NMR (Liquid
al. 2010). These methods offer a simple, rapid, and also       State-500 MHz/125 MHz), and GC-MS (Shimadzu
cost-effective method for detection of BAs, TVB-N, and         QP -2010S). Melting points were measured using
TMA. The design of a colorimetric sensor is fundamentally      Electrothermal-9100 in open capillary tubes without any
based on supramolecular chemistry, which depends on the        correction. UV-visible absorption spectra were recorded
interaction between the molecules such as the formation        with Spectrophotometer UV-Vis (Shimadzu UV-1800
of hydrogen-bonding, acid-base interaction, dipole-dipole,     Eng. 240 V) at room temperature (path length 1 cm).
and van der Waals interaction (Janzen et al. 2006).
        The lone electron pair of nitrogen in amine                       SYNTHESIS OF HYDRAZONE 1 AND 2
molecules could favor the nitrogen as a nucleophile or         Synthesis of hydrazone 1 and 2 was conducted according
base. Moreover, it could highly bind with hydrogen ion to      to the previously reported method (Li et al. 2010).
make a quaternary ammonium ion. Most of the aliphatic          Vanillin (0.31 g; 2 mmol) was dissolved with 50 mL of
amines can form hydrogen bonds. In addition, amine sensor      ethanol in a base-round three-neck flask with a cooler
mechanisms also involve acid-base equilibrium between          condenser. The 2 mmol of hydrazine (phenylhydrazine or
amines and sensor compound. Sensor sensitivity can be          2,4-dinitrophenylhydrazine) was added along with 8-10
improved by increasing of acid-base interaction. Amines        drops of glacial acetic acid to produce compound 1 and 2,
such as ammonia is weak base. It can be detected by            respectively. The mixture was stirred and refluxed for 2-4
acidic sensor. Acid properties of sensor compounds can         h. After the completion of the reaction, the mixture was
be increased by inserting of electron withdrawing group        poured into crushed ice, and the precipitate formed was
substituent in the sensor compound structure (Duong &          filtered, washed with distilled water, and dried for further
Rhee 2014). Based on those mechanisms, an optical sensor       analysis.
for amines could be developed. Moreover, amine sensor
compounds have been developed and used as a sensor for
spoiled food indicators (Basavaraja et al. 2020).                 SYNTHESIS OF 2-METHOXY-4-PHENYLHYDRAZONE
       In this work, we studied vanillin-hydrazone                                 PHENOL (1)
derivatives (1 and 2) as potential of amine sensors for        Brownish white solid, m.p.: 95.6 - 96.8 °C, yield 70.25%.
food spoilage indicators in chicken meat. Compounds            FTIR (KBr) cm-1: 3487 (O-H); 3317 (N-H); 3047 (Csp2-H),
1 and 2 were prepared through a condensation reaction          2924 and 2854 (Csp3-H); 1597 (C=N); 1157 and 2337 (C-
of vanillin with phenylhydrazine and 2,4-dinitrophenyl         N); 1273 (C-O-C). 1H-NMR (500 MHz; acetone-d6): δ/ppm
hydrazine, respectively (Figure 1). Their properties as        9.23 (OH, s, 1H); 7.80 (CH=N, d, J = 2.6 Hz, 1H); 7.39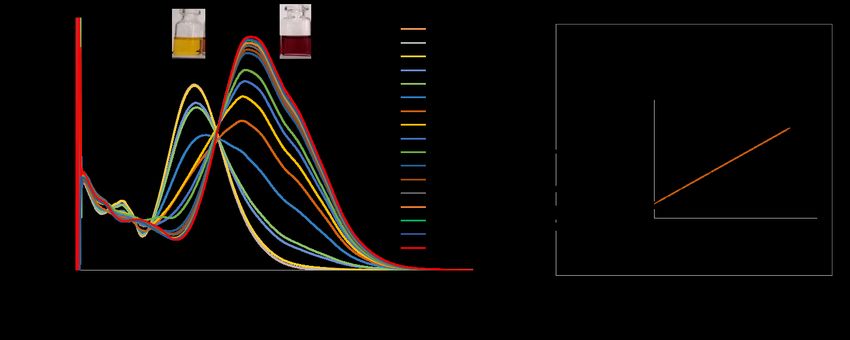
991

(aromatic, d, J = 1.95 Hz, 1H); 7.20 (aromatic, m, 2H);        to the Benesi-Hildebrand plot. A and A0 are described as
7.16 (aromatic, m, 1H); 7.04 (aromatic, dd, J = 1.95 and       the absorbance of 2 after and before the addition of amine.
8.45 Hz,1H); 6.83 (aromatic, d, J = 8.40 Hz, 1H); 3.91
(-OCH3, s, 3H). 13C-NMR (125 MHz; acetone-d6): δ/ppm            PREPARATION OF PAPER-BASED COLORIMETRIC STRIP
153.7; 149.1; 132.2; 130.3; 130.1; 127.1; 123.5; 122.4;                              TEST
116.0; 112.5; 110.9; 56.3. GC-MS (m/z): 242 (M+).
                                                               The paper-based indicator test was prepared, according
                                                               to Gao et al. (2016) with some modifications. The filter
SYNTHESIS OF 4-((2-(2,4-DINITROPHENYL) HYDRAZONE)              paper (Whatman 42) with diameter of 2 cm was immersed
         METHYL)-2-METHOXYPHENOL (2)                           in a 1 mL solution of 2 (DMSO; 1×10⁻³ M) for 15 min and
Red solid, m.p.: 268.8-270.2 °C, yield 79%. IR cm-1:           then dried in an oven for overnight at 55 °C.
3394 (O-H); 3278 (N-H); 3109 (Csp2-H), 2924 and 2854
(Csp3-H); 1612 (C=N); 1512 and 1334 (NO2); 1419                 PAPER-BASED COLORIMETRIC STRIP TEST FOR AMINES
(CH3); 1273 (C-N); 1134 and 1087 (C-O-C). 1H-NMR                                 COMPOUNDS
(DMSO-d6): δ/ppm 11.58 (OH, s, 1H); 9.71 (NH, s, 1H);
                                                               Colorimetric strip test was conducted by adding one drop
8.86 (aromatic, d, J = 2.6 Hz, 1H); 8.58 (CH=N, s, 1H);
                                                               of amine solutions (BA, DEA, and TEA without dilution)
8.35 (aromatic, dd, J = 2.6 and 9.7 Hz, 1H); 8.09 (aromatic,
                                                               into paper-loaded hydrazone 2. The colour response was
d, J = 9.7 Hz), 1H); 7.39 (aromatic, d, J = 1.3 ,1H); 7.17
                                                               observed and recorded.
(aromatic, dd, J = 1.95 and 8.7 Hz, 1H); 6.87 (aromatic,
d, J = 8.5 Hz, 1H); 3.86 (-OCH3, s, 3H). 13C-NMR (125
MHz, DMSO-d6): δ/ppm 150.2; 149.6; 148.1; 144.4;                AMINE DETECTION ON REAL SAMPLE CHICKEN MEAT
136.5; 129.7; 128.9; 125.1; 123.1; 122.6; 116.7; 115.6;        The real sample of boneless chicken breast was purchased
109.6; 55.6.                                                   from local market without special treatment. The sample
                                                               was only sliced into small pieces and stored at chilled
                SPECTROSCOPIC STUDIES                          condition until it was ready to use. The vials used in this
                                                               study have been sterilized using ethanol and dried in an
The spectroscopic studies of 1 and 2 were carried out
                                                               oven. The vial was divided into three categories (A, B,
in a concentration of 5×10⁻⁵ M from the stock solution
                                                               and C) with 5 g of chicken meat sample in each vial. Vial
(1×10⁻³ M) in DMSO. The UV-Vis titrations were recorded
                                                               A was used to detect the amine by immersing the sample
from 2 mL of both 1 and 2 after addition of 50 µL amines
                                                               with hydrazone solution and vial B was prepared to
solution. Amines solutions were prepared in distilled water
                                                               make an extract of chicken meat in water (water extract).
at various concentration (ranges from 1×10⁻⁵ to 1 M).
                                                               Meanwhile, vial C was prepared to detect amine using a
Amine solutions were prepared from ammonia (Amm)
                                                               colorimetric paper-based strip. The samples were observed
and butylamine (BA) as the primary amine, diethylamine
                                                               at three different storage time courses, i.e. 0, 24, and 48 h
(DEA), and dimethylamine (DMA) as the secondary amine,
                                                               at room temperature.
and triethylamine (TEA) for a tertiary amine.
                                                                     The hydrazone 2 (5×10⁻⁵ M, 3 mL) was added into
      Limit of detection (LOD) as determined by measuring
                                                               vial A until all of the samples immersed in the solution.
the absorbance at the maximum wavelength after the
                                                               The sample was stirred for a while, let it stand for 15 min
addition of amine at different concentrations (range from
                                                               at room temperature, and filtered to obtain a clear filtrate.
1×10⁻⁵ to 4×10⁻² M). LOD was calculated with a formula of
                                                               The colour changes were observed, and the UV-Vis spectra
3 σm-1, where σ represents the standard deviation (SD) of
                                                               were also recorded using UV-Vis spectrophotometer.
the blank measurements and m is the slope from the plot
                                                                     Extract of chicken meat in water was prepared by
of the absorbance ratio versus concentration of the sample
                                                               adding 10 mL of water into vial B and stirred for a while
(Boruah et al. 2019). In this work, the SD was calculated
                                                               before allowed to stand for 15 min at room temperature.
from 10 times the measurement of the absorption of 2
                                                               The sample was then filtered to get the extracts and to
without amine.
                                                               remove the matrix. The amount of 75 µL of this extract
      Job’s plot was studied to determine the binding
                                                               was added into 3 mL of hydrazone 2 (5×10⁻⁵ M). The color
stoichiometry of 2 toward butylamine (BA) by plotting the
                                                               response was observed, and the UV-Vis spectra were
mole fraction of 2 ([2]/[2]+[BA]) versus Absorbance at
                                                               recorded using a UV-Vis spectrophotometer.
490 nm (A490 nm) with the total concentration of [2]+[BA]
                                                                     The paper-based colorimetric was tested into the
was maintained constant at 2×10⁻⁴ M. Association constant
                                                               chicken meat sample in two ways. Firstly, the chicken meat
(Ka) of 2 was determined from the absorbance in titration
                                                               extract from a sample in vial B (0.1 mL) was dropped into
plot 1/(A-A0) as a function of 1/[Amine] in M-1 according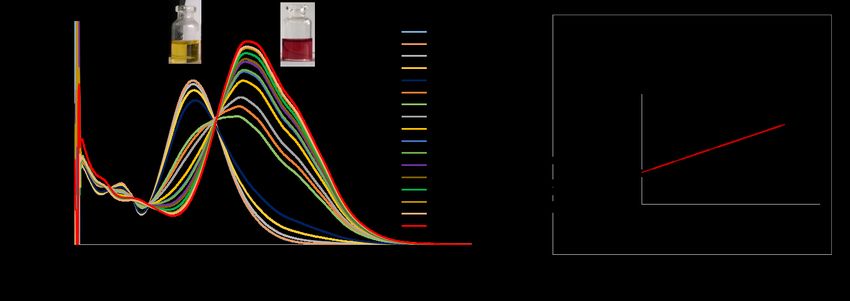
992

the paper strip, and secondly, the strip test was inserted    As a result, hydrazone 2 has the ability and sensitivity
into vial C to detect amine in the gas phase. The colour      to detect amine through colorimetric responses with the
responses from the test were then observed and recorded.      naked eye.
                                                                    Ratiometric responses of hydrazone 2 as the
               R ESULTS AND D ISCUSSION                       concentration of amines gradually increasing was studied
                                                              toward primary, secondary, and tertiary amines. The colour
          SYNTHESIS OF HYDRAZONE 1 AND 2                      responses over the addition of butylamine as a primary
                                                              amine were presented in Figure 3(A). It was noticed
The synthesis of hydrazone 1 and 2 was conducted              a colour changes from yellow to reddish-brown after
through Schiff base-imine condensation reaction between       addition 50 µL of 2×10⁻³ M butyl amine solution. The
vanillin and amine derivatives (phenyl hydrazine and          colour intensity turns into a red and reddish violet as the
2,4-dinitrophenyl hydrazine) in the presence of glacial       concentration of BA was increasing gradually.
acetic acid as catalyst (Figure 1). The chemical structure          The presence of butylamine solution could make a
of the prepared compounds 1 and 2 were confirmed by           redshift of the UV-Visible absorbance spectra, as shown in
spectroscopic analysis.                                       Figure 3(A). The maximum wavelength (λmax) was shifted
                                                              from 415 to 479-490 nm, accompanied by the increase
          SPECTROSCOPIC SENSORY STUDIES                       of the absorbance intensity. According to the spectra
The color responses of hydrazone 1 and 2 were observed        (Figure 3(B)), limit of detection (LOD) of hydrazone 2 to
in a preliminary experiment in the presence of 1000 moles     butylamine was 3.676×10⁻⁶ M (3.676 µM).
equivalent (eq.) (1 M) amines solution. Figure 2(A) shows           Similar response was observed in the presence of
there were no significant color changes of 1 upon addition    diethylamine (DEA) solution. The colour of the solution
of amines. Therefore, UV-Vis spectra of 1 approved that       turns reddish-brown and gradually to be reddish
no maximum wavelength (λmax) was shifted to the visible       violet after addition of DEA in various concentrations
area. The presence of amine (DEA and DMA) only shifted        (Figure 4(A)). The UV-Vis spectra showed a redshift
the λmax from 352 to 360 nm indicating interaction between    in the presence of diethylamine solution. The maximum
1 with amines via hydrogen bonding formation. Thus, the       wavelength (λmax) was shifted from 415 to 477-490 nm,
hydrazone 1 was almost colorless. This result showed the      accompanied by the colour changes from yellow to red-
low color responses of 1 to the amines.                       violet. As the λmax was shifted to the visible wavelength
      The preliminary studies of hydrazone 2 showed           area, it was also noticed the increase of the absorbance
noticeable color changes upon the addition of 1000 moles      intensity as the DEA concentrations were increasing.
equivalent (eq.) amines solution (1 M). Figure 2(B) shows     However, these responses were slightly lower than those
the color of the solution changes from yellow to reddish-     to butylamine. The spectra also displayed the LOD of
violet (with slightly different intensity) upon addition of   hydrazone 2 to diethylamine was 5.451×10⁻⁶ M (5.451
butylamines (BA), dimethylamine (DMA), diethylamine           µM) (Figure 4(B)).
(DEA) and ammonia (Amm). Meanwhile, the solution to                 The lower colour change responses were observed
reddish-brown after the addition of triethylamine (TEA).      after the addition of triethylamine (TEA) solution. The
      The UV-Vis spectra of 2 showed the redshift from        addition of 50 µL TEA (2×10⁻³ M) only resulted in the
415 nm (yellow) to 478-490 nm (red-violet) indicating         colour change from yellow to light brown, and as the
hydrogen bonding formation followed by deprotonation of       concentration of TEA increase, it turns into reddish-
hydrogen at hydroxyl group. Primary amine (butylamine)        brown (Figure 5(A)). These responses were significantly
gave the highest intensity of red/violet color compared       lower than those to butylamine and diethylamine. Tertiary
with the secondary and tertiary amines. From the result, it   amine should be the lower bases and due to its steric
also showed that tertiary amine gave the lowest response      hindrance the three alkyl groups, it makes difficult the
as seen in the comparison of the absorbance intensity at      nitrogen to bond with protons of hydroxyl group from
the λmax (Figure 2(B)). This study showed that introducing    the hydrazone 2. Thus, the interaction of TEA as a tertiary
the nitro group into the hydrazone could increase acidity     amine with the active site of hydrazone 2 was weaker than
of compound 2. Therefore, sensing scheme involves acid-       primary and secondary amines.
base equilibrium between amines and the HO-hydrazone                The UV -Visible spectra of hydrazone 2 in the
(2) (1).                                                      presence of TEA solution were presented in Figure 5(A).
                                                              Unlike the presence of BA and DEA, the addition of 50
RNH 2 +         HO-hydrazone (2)               RNH 3 + +      µL TEA 2×10⁻³ M did not cause the disappearing of λmax
-
  O-hydrazone (2)                                     (1)     at 415 nm. The addition of 2×10⁻³ M of TEA only caused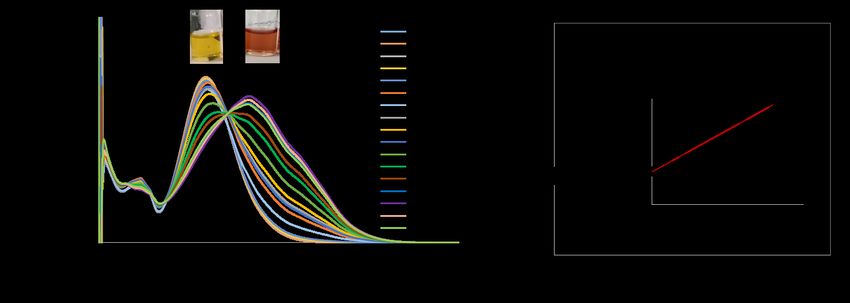
993
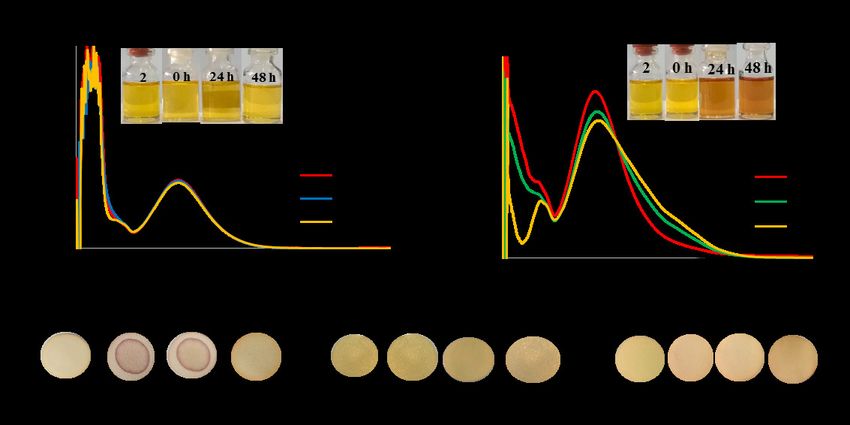
λmax at 415 nm slightly shifted to 416 nm, thus, making AMINE DETECTION ON REAL SAMPLE CHICKEN MEAT
the insignificantly colour changes. The new λmax peak at The studies of hydrazone 2 solutions (5×10⁻⁵ M in DMSO)
453 nm and more was observed after the addition of 50 for amine detection in breast chicken meat was conducted
µL TEA 5×10⁻² M or higher concentration. That result at different storage time at room temperature, i.e. 0, 24, and
showed that the sensitivity of hydrazone 2 toward TEA 48 h. At first, 3 mL of hydrazone 2 (5×10⁻⁵ M in DMSO)
was significantly lower than sensitivity to BA and DEA. was used to soak the meat sample for 15 min at room
The calculated LOD of hydrazone 2 toward TEA (Figure temperature. The solution was then filtered to obtain a clear
5B) was showed to be 5.985×10⁻⁵ M (59.85 µM). extract and the UV-vis spectra were measured afterward.
The Job’s plot of hydrazone 2 in Figure 6(A) It can be seen there were no colour changes of hydrazone
confirmed 1:1 stoichiometric complexation with the 2 after used to immerse the meat sample (Figure 7(A)).
butylamine. The absorbance of the sensor changes more This result was supported by the UV-vis spectra in Figure
rapidly from 0.5 to 1 eq. as the concentration of amine 7(A) that shows no spectral changes.
increased that indicates 1:1 complexation of hydrazone 2 An extract of chicken meat sample in water (75
with analytes (amine) (Erande et al. 2015). µL) from different storage time was added into 3 mL
Benesi-Hildebrand plot was drawn using UV-Vis solution of hydrazone 2. The result shows there were no
titration data, and it depicted a plot of 1/[Amine] versus significant colour changes for sample at 0 h storage time,
1/(A-A0) at 490 nm (for BA and DEA) and 480 nm (for as seen in Figure 7(B). The colour response was observed
TEA) (Figure 6(B)). The linear expression of the Benesi- from yellow to light brown for sample after 24 and 48
Hildebrand confirmed a 1:1 stoichiometric interaction h, respectively. The UV-vis spectra in Figure 7(B) also
of 2 with BA, DEA, and TEA. Binding constant from confirmed a bathochromic shift to the visible wavelength
1:1 complexation can be determined from the Benesi- (from 415 to 420 nm), accompanied by the decreasing
Hildebrand plot with an equation of c/m (c is intercept absorbance intensity at 415 nm. This result indicated that
and m is slope). The binding constant of hydrazone 2 with solution of hydrazone 2 could detect amines produced by
BA, DEA, and TEA were 3.15×10²; 1.62×10²; 5.3264×101 spoiled chicken meat after 24 h storage.
M-1 respectively. The binding constant proved that the The potential of a colorimetric paper-based test of 2
chromogenic effect of BA was larger than DEA and TEA. for amine detection of breast chicken meat spoilage was
The order of the binding constant was consistent with the carried out toward amine water extract and volatile amine.
The addition of 0.1 mL sample water extract from vial B
sensitivity of amine to hydrazone 2.
into the hydrazone paper strip gave insignificant colour
changes (Figure 7(D)). Moreover, when paper strip was
PAPER-BASED COLORIMETRIC STRIP TEST put into a closed plastic box containing breast chicken meat
One drop amine solution (without dilution) was used to and stored at 27-30 °C (room temperature), there were also
study the color changes of the paper-loaded 2. The colour no significant colour indicator paper changes after placing
response was seen turn to reddish-purple after BA and the paper test in the container for 15 min, even when meat was
DEA solution was dropped to the paper test (Figure 7(C)). stored for two days the colour of paper test only turn to
Meanwhile, the paper test became dark yellow after the slightly reddish (Figure 7(E)). This result demonstrated
addition of the TEA solution, meaning the lower response that hydrazone 2, as a loaded filter paper indicator, has low
of hydrazone 2 to TEA in form of paper test. sensitivity for detection of amines generated in chicken
meat spoilage at lower concentration.
OCH3 OCH3
R
H HO R R
HO N AcOH/EtOH
H2N
reflux
H N
N
R H
O 1. R = H 1. R = H
2. R = NO2 2. R = NO2
FIGURE 1. Reaction scheme of the synthesized hydrazone product (1 and 2)994
FIGURE 2. UV-Vis spectra and color changes of sensor 1 (A) and 2 (B) in DMSO
(5×10⁻⁵ M) over addition of 1000 moles equivalent (50 µL/0.1 M) amine solution
FIGURE 3. A) The colour changes and the UV-vis spectra of hydrazone 2 in DMSO
(5×10⁻⁵ M) over addition of 50 µL of butylamine solution at various concentration; B)
Absorbance of 2 as a function of concentration of butylamine at 490 nm. Inset: Linier
curve of the concentration of butylamine and absorbance ratio at 490/415 nm
FIGURE 4. A) The colour changes and the UV-vis spectra of hydrazone 2 in DMSO
(5×10⁻⁵ M) over addition of 50 µL of diethylamine solution at various concentration;
B) Absorbance of 2 as a function of concentration of diethylamine at 490 nm. Inset:
Linier curve of the concentration of diethylamine and absorbance ratio at 490/415 nm995
FIGURE 5. A) The colour changes and the UV-vis spectra of hydrazone 2 in DMSO (5×10⁻⁵
M) over addition of 50 µL of triethylamine solution at various concentration; B) Absorbance
of 2 as a function of concentration of triethylamine at 480 nm. Inset: Linier curve of the
concentration of triethylamine and absorbance ratio at 480/415 nm
FIGURE 6. A) Job’s plot of compound 2 in various mole fraction of butylamine (BA);
B) Benesi-Hildebrand plot based on UV-Vis titration of 2 (in DMSO) after addition of
BA ( ); DEA ( ); and TEA ( )
FIGURE 7. A) The color responses and the UV-Vis spectra of hydrazone 2 in DMSO (5×10⁻⁵ M)
after used to soak the meat sample; B) The color responses and the UV-Vis spectra of hydrazone 2
in DMSO (5×10⁻⁵ M) in the presence of the water extract of chicken sample; C) Color changes of
strip test hydrazone 2 after addition of amine solutions (without dilution); D) Color changes of strip
test hydrazone 2 after addition of 0.1 mL chicken breast water extract; E) Color changes of strip test
hydrazone 2 after exposure to amine vapors996
C ONCLUSION Gribble, A. & Brightwell, G. 2013. Spoilage characteristics
of Brochothrix thermosphacta and campestris in
In conclusion, we have investigated the hydrazone-vanillin
chilled vacuum packaged lamb, and their detection and
compound 1 and 2 as a potential of colorimetric amine
identification by real time PCR. Meat Science 94(3): 361-
detection during chicken meat spoilage. The sensitivity 368.
for amines detection can be increased by inserting nitro Janzen, M.C., Ponder, J.B., Bailey, D.P., Ingison, C.K. & Suslick,
group substituent to hydrazone 2. K.S. 2006. Colorimetric sensor arrays for volatile organic
compounds. Analytical Chemistry 78(11): 3591-3600.
ACKNOWLEDGEMENTS Li, Y., Li, J., Lin, H., Shao, J., Cai, Z.S. & Lin, H. 2010. A novel
colorimetric receptor responding AcO‒ anions based on
This work was funded by Grant of PUPT (Penelitian an azo derivative in DMSO and DMSO/water solution.
Unggulan Perguruan Tinggi), Universitas Gadjah Mada, Journal of Luminescence 130(3): 466-472.
with contract number of 2436/UN1.P.III/DIT-LIT/LT/2017. Naila, A., Flint, S., Fletcher, G., Bremer, P. & Meerdink, G.
2010. Control of biogenic amines in food-existing and
emerging approaches. Journal of Food and Science 75(7):
REFERENCES
139-150.
Arulkumar, A., Karthik, G., Paramasivam, S. & Rabie, M.A. Raudienė, E., Gailius, D., Vinauskienė, R., Eisinaitė, V.,
2017. Histamine levels in Indian fish via enzymatic, TLC Balčiūnas, G., Dobilienė, J. & Tamkutė, L. 2018. Rapid
and HPLC methods during storage. Journal of Food evaluation of fresh chicken meat quality by electronic nose.
Measurement and Characterization 11(1): 281-289. Czech Journal of Food Science 36(5): 420-426.
Basavaraja, D., Dibyendu, D., Varsha, T.L., Chettiyan, T.F., Reid, R., Burgess, C.M., McCabe, E., Fanning, S., Whyte, P.,
Manas, K.P. & Sasidhar, B.S. 2020. Rapid visual detection Kerry, J. & Bolton, D. 2017. Real-time PCR methods for
of amines by pyrylium salts for food spoilage taggant. ACS the detection of blown pack spoilage causing Clostridium
Applied Bio Materials 3: 772-778. species; C. estertheticum, C. gasigenes and C. ruminantium.
Bóka, B., Adányi, N., Virág, D., Sabela, M. & Kiss, A. 2012. Meat Science 133: 56-60.
Spoilage detection with biogenic amine biosensors, Rodriguez-Lazaro, D., Gonzalez-García, P., Delibato,E.,De-
comparison of different enzyme electrodes. Electroanalysis M e d i c i , D . G a r c í a - G i m e n o , R . , Va l e r o , A .
24(1): 181-186. Hernandez, M. 2014. Next day Salmonella spp. detection
Boruah, B.S., Daimari, N.K. & Biswas, R. 2019. Functionalized method based on real-time PCR for meat, dairy and
silver nanoparticles as an effective medium towards trace vegetable food products. International Journal of Food
determination of arsenic (III) in aqueous solution. Results in Microbiology 13(8): 113-120.
Physics 12: 2061-2065. Ruiz-Capillas, C. & Herrero, A.M. 2019. Impact of biogenic
Brightwell, G. & Clemens, R. 2012. Development and amines on food quality and safety. Foods 8(62): 1-16.
validation of a real-time PCR assay specific for Clostridium
estertheticum and C. estertheticum-like psychrotolerant
Bambang Purwono* & Beta Achromi Nurohmah
bacteria. Meat Science 92(4): 697-703.
Department of Chemistry
Chen, X., Zhou, Y., Peng, X. & Yoon, J. 2010. Fluorescent and
Faculty of Mathematics and Natural Science
colorimetric probes for detection of thiols. Chemical Society
Universitas Gadjah Mada
Review 391(6): 2120-2135.
Jalan Kaliurang Sekip Utara Bulaksumur 21
Duong, H.D. & Rhee, J.I. 2014. A ratiometric fluorescence
Yogyakarta, 55281
sensor for the detection of ammonia in water. Sensors and
Indonesia
Actuators B: Chemical 190: 768-774.
Erande, Y., Chemate, S., More, A. & Sekar, N. 2015. PET
Suharman
governed fluorescence “Turn ON” BODIPY probe for
Department of Chemistry
selective detection of picric acid. RSC Advances 5(109):
Universitas Sumatera Utara
89482-89487.
Jalan T. Dr. Mansyur No. 9
Fletcher, B., Mullane, K., Platts, P., Todd, E., Power, A., Roberts,
Padang Bulan, Medan Baru
J., Chapman, J., Cozzolino, D. & Chandra, S. 2018. Advances
Medan, Sumatera Utara, 201555
in meat spoilage detection: A short focus on rapid methods
Indonesia
and technologies. CyTA - Journal of Food 16(1): 1037-1044.
Gao, M., Li, S., Lin, Y., Geng, Y., Ling, X., Wang, L., Qin, A.
*Corresponding author; email: purwono.bambang@ugm.ac.id
& Tang, B.Z. 2016. Fluorescent light-up detection of amine
vapors based on aggregation-induced emission. ACS Sensors
Received: 10 June 2020
1(2): 179-184.
Accepted: 2 September 2020You can also read