AN EMPIRICAL MODEL FOR THE SPREAD AND REDUCTION OF THE COVID19 PANDEMIC
←
→
Page content transcription
If your browser does not render page correctly, please read the page content below
Contribución

 Volumen:38-2 // ISSN: 1133-3197

 An empirical model for the spread and reduction of the
 CoVid19 pandemic
 JOAQUIM CLARA-RAHOLA
 KHN Capital, Av. Diagonal 640, 08017 Barcelona, Spain.
 jclara@khn-capital.com

 ABSTRACT
This document depicts an empirical approach to the dynamics of diagnosed CoVid19 infections at outbreak
scenarios. We study empirical daily diagnosed infections. By performing an initial study, based on basic models of
infection spreads, we find two distinct exponential regimes in which the CoVid19 displays an infection growth rate.
Measures such as household lockdown are critical in order to lower the infection rate. As a result, a crossover point
between fast and slow infection rates is found one week after lockdown, which in turn, is the average CoVid19’s
incubation period. After this crossover point, and following the slow growth rate, infections reach a maximum after
which the infection rate starts to decrease. A possible peak can be found latter to this lockdown critical point, due
to a number of households being infected by subjects already sick from the spread periods. However, such peak is a
singularity as due to lockdown, the diagnosed infections keep decreasing exponentially. Note that this profile, which
we have denoted as Wuhan Quality-Curve (Or Wuhan Q-Curve), is characteristic to the evolution of CoVid19 in China,
as infected countries such as Spain or Italy still are at early stages of the Wuhan Q-Curve. However, both countries
display such profile up to date. Furthermore, our analysis and the proposal of the Q-Curve as master curve to
consider in each CoVid19 outbreak, allows a prediction of outbreak periods, i.e. free spread or lockdown periods, as
well as diagnosed cases over time, provided that an initial data analysis is performed at the beginning of the
outbreak. We also study the case of South Korea, where early measures were successfully implemented against
CoVid19. Finally, data indicates that a soft or hard lockdown result in the same outcome when fighting against
CoVid19.
Keywords: SARS-Cov-2, COVID19, Coronavirus, Quantitative Modelling, Q-Curve

JEL Classification: C01, C03, C06, Y08, Z00

Recibido: 27 de Marzo de 2020
Aceptado: 1 de Abril de 2020

Acknowledgements. This is an independent study. The author is not endorsed, sponsored or financed by any public or private
organization or government. Neither is any direct resource employed in the research and preparation of this paper. The author
kindly acknowledges the European Centre for Disease Prevention and Control and the Humanitarian Data Exchange Organization
for openly providing CoVid19’s daily data.
Joaquim Clara-Rahola

1. Introduction

 The Severe Acute Respiratory Syndrome Coronavirus 2, SARS-Cov-2, responsible of the infectious
disease CoVid19, belongs to the family of the single-stranded RNA coronaviruses (1; 2; 3). It is responsible
of the current global health emergency issued by the World Health Organization (WHO), and by Health
authorities and governments from a growing amount of countries, where CoVid19 is spreading (4; 5; 6).
SARS-Cov-2 is a new class of coronavirus, for which there is no vaccine or any approved specific drug that
can prevent it, and therefore it is a potentially dreadful virus as, despite infected subjects can remain
asymptomatic or develop flu-like symptoms, the CoVid19 infection can end up in developing pneumonia,
multi organ failure and ultimately death (7; 8). Added to the latter, CoVid19 is highly infectious, as it
displays an infection rate, the average number of people that an ill person infects, three times larger than
Swine flu and close to 2.5 times larger than seasonal flu (9). Even more, up to the present date, the
worldwide death rate of the CoVid19 is of 4.5%, with a significant toll on subjects above 70 years old and
subjects with previous conditions (8; 10).
 First diagnosed in December 2019 in Wuhan, capital of the Chinese province of Hubei, CoVid19
displayed to be a threat to health and the healthcare system. Its fast infection and transmission between
individuals, and the need of hospitalization in a significant amount of mild and severe cases, rapidly
overwhelmed the capacity and resources of Hubei’s healthcare system (11; 12). The growing rate of
infected subjects added to the limited capacity of hospitals and healthcare personnel and supplies,
became a threat, as not all mild or severe cases could be taken care of, which resulted in a rising amount
of sick population, and ultimately, a significant amount of deaths (13). Therefore, Chinese authorities took
the executive decision to completely lock down the population on January 21st - 23rd 2020, in an attempt
to stop the outbreak. The same scenario has been found in other areas where CoroVid19 has further
spread. Namely, Spain and Italy faced the same situation as Wuhan, and their respective authorities
imposed so far, a partial lockdown in Spain on March 14th 2020, and a total lockdown in Italy on March 9th
2020. The lockdown strategy proved to be effective in order to eradicate the CoVid19 in Hubei, as after a
period of nearly two months the infection rate has decreased significantly, and citizens are gradually
allowed to freely move.
 At the present date, part of Wuhan and Hubei’s citizens are allowed to freely move, provided that they
have been tested negative in CoVid19 (14; 15). The outcome of the lockdown is still an open question in
countries such as Spain or Italy. This paper aims to provide insight into this question and it also aims to
establish common features in infection dynamics, as a hallmark to establish a master curve (that we
denote as Wuhan Quality-Curve, or Q-Curve) that helps in predicting the evolution of the CoVid19
outbreak, prior and post government imposed lockdowns. Here, initial conditions are paramount, such as
the time spent in between the beginning of the outbreak and measures being taken. Also, the analysis
displayed in this document allows an estimation of daily CoVid19’s infections and the infection rate, as
well as lockdown periods and critical and flipping points in the infection-time profile. The free spread
period prior to measures being implemented and the characteristics of the lockdown, are initial
parameters that establish the overall infection dynamics. Note that dynamic models of infected CoVid19
cases have been proposed, which depict the evolution of the infection in time with or without measures
such as lockdown (16; 17). However, note as well that we propose an approach from empirical data that
resolves quantitatively the outbreak in different key periods and as well, in expected amount of diagnosed
subjects in each period.
 Data is obtained from the websites of the European Centre for Disease Prevention and Control (ECDPC)
and the Humanitarian Data Exchange Organization (HDEO), which provide updated CoVdi19 statistics
daily. Data ranges from January 1st 2020 until March 26th 2020. Afterward to this introduction section, the
paper is structured by the analysis and modelling of the Chinese CoVid19 daily diagnosed cases since 1st
An empirical model for the spread and reduction of the Covid19 pandemic

January 2020 until nowadays (section 2), which leads to resolve the Wuhan Q-Curve. This finding allows
for studying the COVID19 infection rate in Spain (section 3). The Spanish data displays the equivalent
exponential spread regimes than the Chinese case, and thus it is possible to model and quantitatively
resolve the overall infection rate profile to this country. The cases of Italy and South Korea are also
presented, as they are two extreme scenarios. Italy displays an infection profile where CoVid19 has wildly
spread as lockdown measures where considered in delay, while South Korea is the opposite case. Here
measures were implemented at an early stage of the outbreak, which allowed for a fast decline in
infections and a relatively prompt end to the outbreak. Finally, the conclusions from this research work
are presented (section 4).

2. Virus spread dynamics and the case of CoVid19 diagnosed infections in China

 Transmission of CoVid19 in humans was first detected in Wuhan, the largest city in the Hubei province,
in central China, on December 2019 (2). Since then a gradual transmission in Wuhan’s and Chinese society
was detected, which led to an epidemics, and ultimately to the emergency measures implemented on
January 23rd 2020, as CoVid19 supposed a massive and imminent health threat (13). Here, a total home
lockdown of society with a sudden stop of most economic activities have proven efficient in order to stop
the CoVid19 infection spread in humans (18). The number of daily diagnosed CoVid19 Cases is displayed
in figure 1, where it can be noticed that a significant amount of cases raised by 20-25th January 2020. Also,
so far, we have restricted the dataset up to the date of 5th February 2020, when the pandemic in China
exhibited a stop and started to retreat in diagnosed cases thereafter. Here, data displays the typical spread
exponential trend, found in uncontrolled infection scenarios (19; 20). Note thus, that it can be displayed
by such functional form:

 ( ) = 0 exp[( − 0 )⁄ ] (1)

Figure 1: Time evolution of diagnosed CoVid19 cases in China. Circles are experimental datapoints while lines are the
corresponding fits (green belongs to early infection regime, while blue belongs late infection regime, which is post
lockdown). Note the change in growth rate after one week post lockdown in the logarithm-linear scale plot (a). Without
the lock down, the rate increase of infected citizens would have been significantly larger than with the lockdown going
on (b). Note that the crossover between fast and slower growth rates is about a week after ockdown, in contrast with
the CoVid incubation period of 2-14 days. Thus placed right at the average incuvation time.

 3
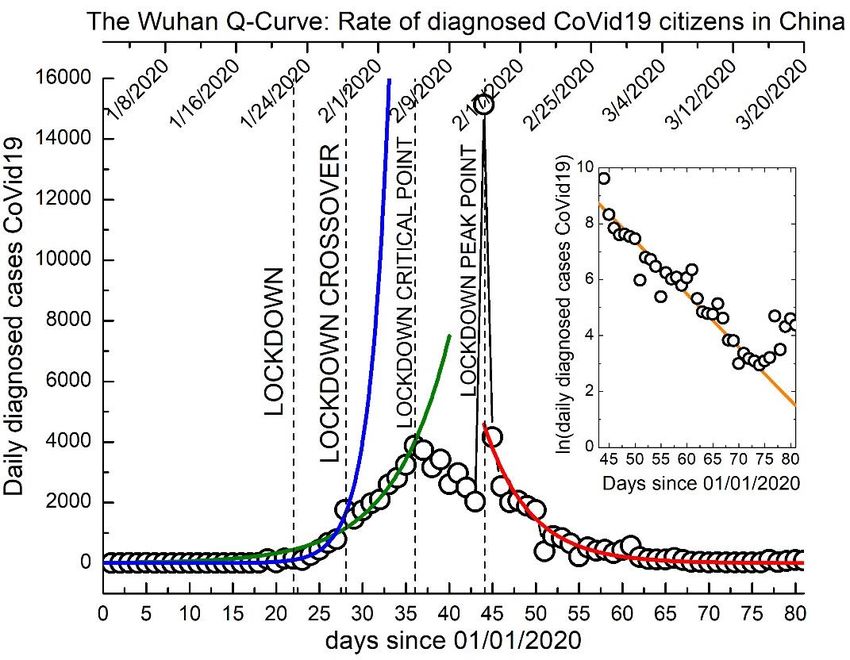
Joaquim Clara-Rahola M(t) is the number of infected subjects at time t, M0 is the initial amount of infected subjects, t0 is the initial infection time, and is the infection growth time rate. Therefore is the time necessary for diagnosed infections to grow by ~ 2.7 times. In order to properly perform our analysis, we consider the logarithm transformation of equation (1), which yields: ln[ ( )] = ln[ 0 ] + ( − 0 )⁄ (2) Here we consider the initial number of infected subjects to be 1, as indicated by the Chinese dataset and visualized in figure 1. Therefore: ln[ ( )] = ( − 0 )⁄ (3) Note we have reached a linear relation and consequently, we transform the empirical amount of daily CoVid19 diagnosed cases in China by taking the logarithm of its magnitude and display it versus time, days spent in 2020, as shown in figure 1. It is straightforward to notice that a linear relation is not displayed, but two apparent linear regimes are observed. One with an infection rate way at early times, and a second, slower one, at larger lag time. The empirical points of each regime are linearly adjusted as displayed in figure 1(a). We find for the initial regime an infection rate time of 1=2.2 days, while for the one belonging to large times 2 = 6.4 days. Also, at the early infection regime, t01 = 11.7 days, while for the late one, t02 = 17.1 days (see figure 1). Note that the subindexes 1 and 2 respectively correspond to the early and late regimes. It must be indeed mentioned that if a single exponential analysis is performed, the discrepancy in between fit and experimental diagnosed infection datapoints is too large, in particular, at the beginning of the outbreak. Here, the discrepancy in between the registered cases and the ones belonging to a single exponential growth model is of several hundreds at times of about 20 days, i.e., by January 20th 2020. It is difficult to believe that Chinese authorities would have missed this large amount of infected subjects and therefore it is plausible to explain the two regime growth rate empirical model, as result of the Chinese lock down on January 20th-23rd 2020 which lowered down the free spread of CoVid19, and allowed to transit from a fast infection growth rate to a slower one. Remind that at such date, Chinese authorities took and implemented the forced home lockdown of citizens, which collateralized in the stop of most economic activities. The aim has been clear: to distance CoVid19 transmitters with healthy population, and thus a gradual decrease in the number of infected citizens. Diagnosed infections displayed in figure 2 indicate that such strategy proved to be effective. However, with the CoVid19 displaying an incubation period ranged in between 2 and 14 days, the decrease in registered cases would not be expected until the end of these two weeks lag time. This scenario is indicated in figure 2, where the detected number of daily infections is displayed before and after the lockdown decision is executed. Note that here, despite the rate of diagnosed infected subjects decreases one week after the lockdown, as previously discussed, the exponential free spread cases continue after confinement. Infected individuals, despite being locked down, develop the CoVid19 illness. However, as indicated in figure 2, the exponential growth breaks down after 13 days, a period in the order of the 2-14 days incubation range. After this 13-day period, there is a gradual reduction in diagnosed individuals. Here the spread of CoVid19 recesses significantly, but not yet enough in order to stop the population lockdown, as if confinement is released, the still infected would again freely spread the virus, resulting in a restart of the exponential spread rate. Here however, note that a peak emerges in the decrease rate period. Namely since diagnosed infections start to back, a significant peak suddenly appears. It is tempting to explain such data point as once the lockdown is established; infected individuals transmit the CoVid19 to other ones that share spaces with them. Thus, it is feasible that infected family members transmit the virus to other ones. Note that the exponential spread increase lasts until 5th February 2020, the 36th day of this year, and that the peak appears on February 13th 2020, about a week later. Which in turn is of about three weeks after the
An empirical model for the spread and reduction of the Covid19 pandemic lockdown. Therefore, it is suggested that while the first lock down week, CoVid19 gradually spreads in households and confinement spaces, but limited to reach outer infections. Such new cases are not diagnosed until about two weeks later, due to CoVid19’s incubation period. Then, due to the confinement and the inability of the virus to be spread further to the population, the peak of new daily diagnosed infections appears, followed by a decay that, as far as confinement is maintained, displays an exponential infection decrease rate. It is important to note that the average Chinese household is composed in average by 3,4 persons, and that the magnitude of the peak is of about 15.141 diagnosed infections, 3.9 times the magnitude of diagnosed infections at the beginning of the lock down, 3.872 cases. Note that the proportion of 3.9 is slightly higher than the household size, as it is possible that a some of these infections belong to citizens infected while the free spread period. Figure 2: Q-Curve: evolution of daily diagnosed citizens in China by CoVid19, in between 01/01/2020 and 23/03/2020. Circles are empirical datapoints while lines are fits to their corresponfind regimes. Note the different regimes: at very early times: free spread and fast infection growth rate. After one lockdown week, slow growth rate. After two weeks post-lock down, decrease in diagnosed CoVid19 cases. Then, sudden peak due to confined subjects having been infected by confined sick ones at lock down time. Finally, gradual infection decrease while keeping the confinment on. Such profile determines the indicated critical moments (dashed vertical lines). The inset displays the logarithm-linear representation of the diagnosed infection decay, which displays a linear relatioship and thus its exponential character. The infection rate decrease from the post-lock down peak is indeed an exponential rate as expected (19; 20). We have described this part of the data set with the following functional form: ( ) = 0 exp[−( − 0 )⁄ 3 ] (4) With t0 being the peak’s date, 13th February 2020 (44 days since January 1st 2020), M0 the number of daily infected subjects at such date, and 3 is the infection decay rate. By employing the same strategy than at the exponential daily infection growth, thus by considering the logarithm of equation (4), we find that 3 = 5.7 days, M0 = 4582.9 cases. Figure 2 depicts the exponential infection decrease model along with experimental data points. Note also in figure 2, that in order to achieve an amount of daily infected subjects less than 50, a period of 35 days is necessary. Thus, this scenario could be achieved by March 19th of 2020, about two months after lockdown. Here note that 50 daily infected subjects have been 5
Joaquim Clara-Rahola chosen as a magnitude in which health authorities could track and confine these cases, and thus Chinese authorities could prepare a possible lockdown release. Finally, note that the period in between the end of the exponential infection growth and the peak post infection decrease has not been quantified. It is expected that such decrease is of exponential nature, however there are not enough data points in order to establish reliable statistics. A visual inspection, however, see figure 2, indicates a tendency with the same decay rate than found after the peak, thus of 3 = 5.7 days. Note that prior to infected citizens displaying CoVid19 symptoms, we are in spread recession and as conditions have not varied due to the lockdown being still active, the infection decay rate should be a constant. 3. CoVid19 in Spain: scenario up to date and a feasible scenrio in the reduction of CoVid19 infections. Spain is a country at partial lockdown due to CoVid19 at the time our study is being carried out, which was imposed by the Spanish Government on March 14th 2020. Here, the evolution of detected daily infections indeed displays an exponential growth as it can be visualized in figure 3, where since by March 5th, the 66th day of 2020, infections started to rise significantly. We have kept the same approach than the one already performed in the analysis of the CoVid19 in China, thus we depict the diagnosed Spanish infection cases in time through a logarithmic-linear relationship as indicated in figure 3. Here data displays a distinct linear growth rate in almost all the growth curve. However, the last part of such dataset is strikingly off from such linear relation. Therefore, we adjusted the CoVid19 infection in Spain as we have already done with the Chinese one, by differentiating between two growth regimes, and hence, by employing two functional forms according to equation (3). We find that to the Spanish case, the fast growth is resolved with 1 = 3.1 days and t0 = 53.6 days, while the slower growth regime is resolved with 2 = 6.5 days and t0 = 29.3 days. When compared to the overall Chinese scenario, Spain is currently found to be at the lockdown crossover point, where the infection growth rate decreases, yet keeping an exponential growth profile. Note that this key point is found in the Chinese outbreak about a week after lockdown. Note as well, that the growth rates, 1 and 2, are strikingly similar in between these countries as indicated in table 1. Also, the magnitudes of daily diagnosed infected subjects are close in magnitude through both growth regimes, as it can be observed when comparing figure 2 and figure 3. Therefore, it is straightforward to pose if the partial lockdown such the case in Spain, is equally efficient than the total lockdown imposed in China, namely in the Hubei region. From the data and our analysis, this is the case so far, and thus it would be expected that Spanish diagnosed CoVid19 infections decrease at the two-week period after lockdown, when the lockdown critical point is found. Then Spanish diagnosed infections would start to decrease by around March 30th 2020. Following the previous, it is difficult to resolve if Spain will exhibit a peak point once CoVid19 diagnosed infections decrease. This peak belongs to home infections once lockdown has started and indeed, Chinese social structure, demographics and culture are different than the Spanish ones. For instance, most Spanish families do not tend to live with elders, patients with high infection risk, which is not the case in China. However, due to the so far strong qualitative and quantitative symmetries between both infection curves, it is tempting to pose the scenario where the daily infection decay rate is similar in Spain than the resolved one for China, 3 = 5.7 days. Here, by studying figure 2 it is determined that China has not displayed a significantly low magnitude in daily diagnosed infected subjects until 65 days after lockdown. Thus, being the Spanish lockdown set on March 14th 2020, a release of such confinement would be feasible in between May 21st and May 28th 2020, provided that a security period is added. Otherwise, the release could be just
An empirical model for the spread and reduction of the Covid19 pandemic about a week before, which could be unsafe as the magnitude of daily infected subjects would be around 50 according to the Chinese data. Figure 3: Time evolution of diagnosed CoVid19 cases in Spain. Circles are experimental datapoints while lines are the corresponding fits (green belongs to early infection regime, blue belongs to late infection regime, which is postlockdown). As observed in the case of China, note the change in growth rate about a week post lockdown, visualized in the logarithm-linear scale plot (a). As in the Chinese profile, without the lock down, the rate increase of infected citizens would have been significantly larger than with the lockdown going on (b). Here, also note that the crossover between fast and slower growth infection rates is about a week after ockdown, the most common CoVid19 incubation period, located at its mean, 2-14 days. 4. CoVid19 in Italy and South Korea Italy and South Korea are two extremes in the case scenario that the CoviD19 spread presents. Let’s first focus on with the case of Italy. Here, data displays a single exponential growth curve as depicted in figure 4. Note in this figure that the logarithmic-linear description displays a single linear relation, which resolves 1 = 5.9 days, and a to = 35.0 days. As well, figure 4 depicts the linear relation in between daily infected cases over time, where data is well depicted by the exponential functional form with the previous 1 and to as inputs. Therefore, Italy does not exhibit having reached the lockdown crossover point at the time of writing this document, the time when diagnosed infections transit from the fast exponential growth (1) to the slow one (2). It should be expected that infected cases continue to rise according to the exponential trend shown in figure 4. Note that Italy placed a soft lockdown on March 11th 2020, and a total lockdown on March 22nd 2020. Thus, it is suggested that the delay in imposing a strong lockdown results in the lockdown crossover point not being reached in Italy so far. Also, note that the initial Italian lockdown was different than the Spanish one. Since the Spanish lockdown, total confinement was imposed besides for travelling back and forth from home to work, or for essential activities such as shopping in supermarkets for food. Also, remote working has been encouraged by Spanish public and private sector, as well as by society since the CoVid19 outbreak. 7
Joaquim Clara-Rahola Figure 4: Time evolution of diagnosed CoVid19 cases in Italy. In this case the logarithmic-linear representation of diagnosed daily infections displays a single linear relationship (a). Such feature indicates that Italy has not yet passed the crossover point towards the slower growth rate. However the linear represtation displays infections diagnosed after 80 days or latter, being off the computed expnential growth, hinting a possible chage in the near future (b). Circles are experimental datapoints while lines are the corresponding fits. Figure 5: Time evolution of diagnosed CoVid19 cases in South Korea. Note that despite an initial exponential growth of diagnosed daily infections, such magnitude strikingly decreases due to proper preventions measures being implemented. Again, circles are experimental datapoints while lines are the corresponding fits. The case of South Korea is strikingly different than the Italian one, or any other studied in this paper. Here, South Korea took prevention measures soon enough, which lead to a contained CoVid19 outbreak. Despite daily infected cases have been detected, the contention actions have been enough in order to stop a random uncontrolled spread, and thus an exponential infection rate. In the South Korean case, characteristic contagions by random are just hinted as observed in figure 5. Note in this figure that the exponential CoVid19 spread, however, displays magnitudes of diagnosed infections being remarkably low when compared to the cases of China, Spain or Italy. When performing the quantitative analysis described through equations (1) – (3), we find a characteristic growth rate of = 3.9 days and a t0 time of 35.0 days.
An empirical model for the spread and reduction of the Covid19 pandemic Country 1 (days) t01 (days) 2 (days) t02 (days) CHINA 2.2 11.7 6.4 17.1 SPAIN 3.1 53.6 6.5 29.3 SOUTH KOREA 3.9 35.0 -- -- ITALY 5.9 27.8 -- -- Table 1: Parameters obtained from the linear fit to the logarithmic-linear daily diagnosed infections for diferent countries. The first set (1, t01) belongs to the free spread fast infection growth regime, while the second one ( 2, t02) belongs to the slowed infection regime post-lockdown point and post- lockdown crossover point. Note that China and Spain are the countries where the free CoVid19 spread rate was spreading at the lowest rate. Italy however, is the country where the free spread rate was stronger. 5. Conclusions The spread of CoVid19 in different countries displays the characteristic virus diffusion contagion dynamics, which is hallmarked by exponential infection rates in free spread. Here, lockdown measures implemented by the first country in which CoVid19 was detected, China, have proven effective in order to stop the outbreak. Chinese data, namely the Wuhan Quality Curve (or Wuhan Q-Curve) presented in figure 2, displays a CoVid19 daily infection curve that is proposed as a mastercurve in all CoVid19 outbreaks. Such profile is hallmarked by a characteristic exponential growth rate, which slows down once confinement and necessary healthcare measures are implemented. The crossover between fast and slower daily infections found at the average of the CoVid19 incubation period, which has been denoted as lockdown crossover (see figure 2). Here, new infections are reduced due to confinement, but latent infections develop as well in this period, until due to confinement a lockdown critical point of infections is reached (again, see figure 2). Such point takes place about 15 days after lockdown, the upper limit of CoVid19’s incubation period. It is here when daily diagnosed CoVid19 cases start to reduce, with a possible peak point due to infections in locked households. However, and despite the peak point, infection dynamics after the lockdown critical time becomes regressive, reaching an almost zero daily infected subjects through an exponential decay. It must be mentioned that infection dynamics, in particular the spread growth rates are in the same order of magnitude in most cases, as displayed in table 1. This feature indeed indicates that infections spread naturally in between nations, but that movements and environment of first infections such as climate, lifestyle, culture, alimentation or being in large or small cities or towns, are factors that slightly vary the magnitude of the fast spread rate, thus the characteristic growth rate 1. The second growth rate, the slower one, 2, is strikingly similar in cases in which this phase has been observed. Here confinement is a paramount parameter as the access of CoVid19 to new cases is limited to a similar number of potential infections. In lack of a CoVid19 vaccine, so far, confinement, i.e. household lockdown, and extreme care and health measures are the only protocols proven efficient in order to stop the spread of CoVid19. Note the particular case of South Korea where proper protocols were implemented at early CoVid19’s outbreak. In any case however, Wuhan’s Q-Curve is proposed as a standard CoVid19’s infection dynamics, provided that protocols are implemented at some point after detecting an outbreak. Such profile can be of help in order to estimate daily infected cases, death tools (once a reliable decease ratio is established), and outbreak periods, in particular the one belonging to lockdown. 9
Joaquim Clara-Rahola

References

1. Gorbalenya, Alexander E., et al. (2020). "The species Severe acute respiratory syndrome-related
 coronavirus: classifying 2019-nCoV and naming it SARS-CoV-2". Nature Microbiology 5, pp. 536-544.
2. Zhu, Na, et al. (2019). "A Novel Coronavirus from Patients with Pneumonia in China". The New England
 Journal of Medicine 382, pp. 727-733.
3. Lupia, Tommaso, et al. (2020). "2019 novel coronavirus (2019-nCoV) outbreak: A new challenge".
 Journal of Global Antimicrobial Resistance 21, pp. 22-27.
4. Battegay, Manuel, et al. (2020). "2019-Novel Coronavirus (2019-nCoV): estimating the case fatality rate
 - a word of caution". Swiss Medical Weekly 150, w20203.
5. McCloskey, Brian and Heymann, David L. (2020). "SARS to novel coronavirus – old lessons and new
 lessons". Epidemiology and Infection 148, e22, pp.1-4.
6. Saglietto, Andrea, et al. (2020). "COVID-19 in Europe: the Italian lesson". The Lancet. 2020. Published
 Online March 23, https://doi.org/10.1016/S0140-6736(20)30690-5.
7. Kobayashi, Tetsuro, et al. (2020). "Communicating the Risk of Death from Novel Coronavirus Disease
 (COVID-19)". Journal of Clinical Medicine 9, pp.580-587.
8. Baud, David, et al. (2020). "Real estimates of mortality following COVID-19 infection". The Lancet.
 Published online March 12, https://doi.org/10.1016/S1473-3099(20)30195-X.
9. Callaway, Ewen, et al. (2020). "Coronavirus by the Numbers". Nature 579, 482-485.
10. Onder, Graziano, Rezza, Giovanni and Brusaferro, Silvio. (2020). "Case-Fatality Rate and
 Characteristics of Patients Dying in Relation to COVID-19 in Italy". Journal of the American Medical
 Association. Published online March 23. https://jamanetwork.com/journals/jama/fullarticle/2763667.
11. Li, Shan and Wang, Joyu. (2020). "Wuhan Coronavirus Hospitals Turn All but Most Severe Cases". The
 Wall Street Journal. Published online February 5. https://www.wsj.com/articles/united-american-
 airlines-suspend-hong-kong-service-as-coronavirus-saps-demand-11580897463.
12. Xie, Jianfeng, et al. (2020). "Critical care crisis and some recommendations during the COVID-19
 epidemic in China". Intensive Care Medicine. Published online February 17.
 https://doi.org/10.1007/s00134-020-05979-7.
13. World Health Organization. (March 2020) Report of the WHO-China Joint Mission on Coronavirus
 Disease 2019 (COVID-19). https://reliefweb.int/report/china/report-who-china-joint-mission-
 coronavirus-disease-2019-covid-19.
14. The Guardian (2020). "China to lift travel restrictions in Hubei after months of coronavirus lockdown".
 Published online March 24. https://www.theguardian.com/world/2020/mar/24/china-to-lift-travel-
 restrictions-in-hubei-after-months-of-coronavirus-lockdown.
15. Financial Times (2020) "Voices from Hubei: residents welcome liberation after quarantine". Published
 online March 25. https://www.ft.com/content/f205c4f0-6e66-11ea-89df-41bea055720b.
16. Liu, Yang, et al. (2020). "Viral dynamics in mild and severe cases of COVID-19". The Lancet. Published
 online March 19. https://www.thelancet.com/action/showPdf?pii=S1473-3099%2820%2930232-2.
17. Anderson, Roy M., et al. (2020). "How will country-based mitigation measures influence the course of
 the COVID-19 epidemic?" The Lancet. Published online March 6.
 https://www.thelancet.com/action/showPdf?pii=S0140-6736%2820%2930567-5.
18. CNBS News (2020). "China to lift lockdown on Wuhan, the epicenter of its coronavirus outbreak".
 Published online March 24. https://www.cnbc.com/2020/03/24/china-to-lift-lockdown-on-wuhan-
 city-epicenter-of-coronavirus-outbreak.html.
An empirical model for the spread and reduction of the Covid19 pandemic

19. Keeling, Matt and Pej, Rohani (2011). "Modeling Infectious Diseases: in Humans and Animals".
 Princeton: Princeton University Press, 2011.
20. Vynnycky, Emilia and White, Rivhard G. (2010). "An Introduction to Infectious Disease Modelling".
 Oxford University Press, USA.

 11
You can also read