ASYMMETRIC GARCH-TYPE AND HALF-LIFE VOLATILITY MODELLING OF USD/KZT EXCHANGE RATE RETURNS
←
→
Page content transcription
If your browser does not render page correctly, please read the page content below
EURASIAN RESEARCH JOURNAL,
                                  ERJ, Vol. 2, No. 2, pp. 7-18, July 2020

                                           ISSN 2519-2442, KAZAKHSTAN
                                                  Research Article

ASYMMETRIC GARCH-TYPE AND HALF-LIFE VOLATILITY
  MODELLING OF USD/KZT EXCHANGE RATE RETURNS
                                        Mert URAL, 1 Erhan DEMIRELI 2

       1
           Dokuz Eylul University, 35210 Izmir, Turkey; e-mail: mert.ural@deu.edu.tr; ORCID: 0000-0003-3252-846X
   2
       Dokuz Eylul University, 35210 Izmir, Turkey; e-mail: erhan.demireli@deu.edu.tr; ORCID: 0000-0002-3457-0699

Received: 22.10.2019                      Corresponding Author: Mert URAL                      Accepted: 31.12.2019

                                                   ABSTRACT

Empirical studies have shown that a large number of financial assets returns
exhibit fat tails (leptokurtosis) and are often characterized by volatility clustering
and asymmetry. This paper considers the ability of the asymmetric GARCH-
type models to capture the stylized features of volatility in USD/KZT exchange
rate returns. Therefore, the half-life parameter of the USD/KZT returns series
were calculated for three sub-periods. The results revealed that the half-life was
6 days, 16 days and 12 days for 1st sub-period, 2nd sub-period and 3rd sub-period
respectively. According to the results, in the presence of asymmetric responses
to innovations in the Kazakhstan foreign exchange market, the EGARCH
(1.1)-GED model which accommodates the kurtosis of financial time series
is preferred. Also, these results show that the USD/KZT exchange rate returns
have strong mean reversion and short half-life.
Keywords: EGARCH, GJRGARCH, APGARCH, USD/KZT exchange rate,
Half-life volatility.

                                                         7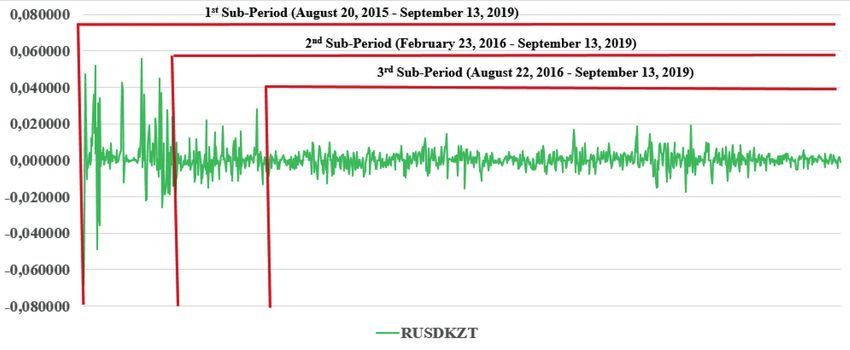
ASYMMETRIC GARCH-TYPE AND HALF-LIFE VOLATILITY MODELLING OF USD/KZT
                                              EXCHANGE RATE RETURNS

 Eurasian       INTRODUCTION
 Research
  Journal
  July 2020     Devaluation is one of the intentionally downward adjustment tools of the
Vol. 2, No. 2
                value of a national currency relative to another national currency or group of
                national currencies. Devaluation is a monetary reform tool used by central
                banks to manage the national currency value (Zholamanova et al., 2018: 832).
                An example from the newest history of Kazakhstan - on August 20 of 2015, the
                National Bank announced devaluation and introduced a free exchange rate of
                tenge. From August to December 2015, the Kazakhstan tenge (KZT) depreciated
                from 188.38 to 349.12 KZT against the US dollar (USD).

                Because of the weakening of the Chinese yuan and the decrease in the price of
                Brent crude oil from early 2015, the pressure on the economy of Kazakhstan was
                exacerbated. This economic condition forced the National Bank of Kazakhstan
                to switch to a floating rate in August 20, 2015 and the KZT devaluated by
                24.6%. From August 19, 2015 to August 20, 2015, the KZT depreciated from
                197.28 to 252.40 KZT against the USD. However, this creates certain risks for
                the economy that will face some adaptation troubles. The devaluation appears to
                produce more negative effects to the economy of Kazakhstan.

                Because of the empirical studies have shown that a large number of exchange
                rate returns exhibit fat tails (leptokurtosis) and asymmetry in volatility, the main
                purpose of this paper is to examine the adequacy of the asymmetric GARCH-
                type models to capture the stylized features of volatility in USD/KZT exchange
                rate returns. Moreover, the average number of time periods for the volatility to
                revert to its long run level is measured by the half-life of the volatility shock.

                The remainder of this paper proceeds as follows. Section 2 attempts to review
                the relevant literature. Section 3 details the general models. Section 4 describes
                the USD/KZT exchange rate returns data to be used in this study and presents
                the empirical results. Section 5 contains some concluding remarks.

                LITERATURE REVIEW

                Volatility modeling of exchange rates have many practical applications in finance
                with wide discussion in academic literature. Kamal et al. (2012) examine the
                performance of GARCH family models in forecasting the volatility behavior
                of Pakistani FOREX market. They founded asymmetric behavior of volatility,
                where TARCH model showed insignificance. Olowe (2009) used GARCH type
                models to investigate the volatility of Naira/US Dollar exchange rate. According
                to the results, all the coefficients of the variance equations were significant, and
                TS-GARCH and APARCH models were the best models. Hafner (1998) has
                analyzed high-frequency foreign exchange rate (HFFX) series with ARCH class
                models. The results showed important asymmetries in volatility. Additionally,
                according to EGARCH model, the news impact curves have different shapes
                for different lags. Ahmed et al. (2018) examine and compare the mean reversion
                estimation in developed and emerging stock markets. The results show that the
                South Korean market has the slowest mean reversion, and the Pakistan stock
                exchange exhibited the fastest mean reverting process. Abdalla (2012) considers
                the GARCH approach in modelling exchange rate volatility with a panel of
                nineteen of the Arab countries using daily observations. The paper concludes

                                                        8
ASYMMETRIC GARCH-TYPE AND HALF-LIFE VOLATILITY MODELLING OF USD/KZT
EXCHANGE RATE RETURNS
that the exchange rates volatility can be adequately modelled by GARCH type Eurasian
models. Gbenro and Moussa (2019) analyzed the mean reversion property on Research
Journal
the West African stock market. The results showed that the estimated half- July 2020
Vol. 2, No. 2
life time declines slightly for composite index. Many recent empirical studies
also investigate the characteristics of exchange rate volatility in the context of
time series analysis of financial returns. For example, Longmore and Robinson
(2004), Wang (2006), Yoon and Lee (2008), Hamadu and Adeleke (2009), and
Fiser and Roman (2010).
As far as we have determined, no previous study has been found on the
volatility modeling and half-life volatility estimation of USD/KZT exchange
rate. Therefore, the distinctive contribution of this study to the literature is the
asymmetric volatility modeling of the USD/KZT exchange rate and the half-life
volatility estimation.
METHODOLOGY
In the theoretical and empirical studies, it is strongly highlighted the invalidity
of using unconditional homoscedastic variance instead of conditional
heteroskedastic variance and models. Particularly, studying with high frequency
models like financial time series analysis requires working with heteroskedastic
models (Baltagi, 2000: 375). The basic statistical features of financial time
series may be classified as leptokurtic distribution, volatility clustering, leverage
effect-asymmetric information and co-movement process. Exchange rate returns
are approximately uncorrelated but not independent through time as large (small)
price changes tend to follow large (small) price changes which is commonly
referred to as volatility clustering. The features mentioned above discloses the
requirement for different type of conditional heteroskedastic models. In today’s
financial engineering techniques, there are more than six hundred derivative
models of conditional heteroskedastic models. However, the most basic
types of it are those introduced by Engle (1982) as ARCH (AutoRegressive
Conditional Heteroskedasticity) and Bollerslev (1986) as GARCH (Generalized
AutoRegressive Conditional Heteroskedasticity) models. The importance of
these models arises from their usage on portfolio risk and volatility analysis
(Brooks, 2002: 439). Here are the basic definitions and theoretic properties of
the models.
ARCH (q) and GARCH (p,q) Models
The basic idea of the ARCH models is that the mean corrected asset return model
is serially uncorrelated, but dependent and the dependence of this model can be
described by a simple quadratic function of its lagged values (Chatfield, 2003:
83). Specifically, a basic ARCH (q) model can be described as generalizing q
process for the model below:
σ t2 = w0 + α1ε t2−1 + α 2ε t2−1 + + α nε t2−1 (1)
Hence the basic ARCH model is:
q
σ= w0 + ∑ α iε t2−i
t
2
(2)
i =1
9ASYMMETRIC GARCH-TYPE AND HALF-LIFE VOLATILITY MODELLING OF USD/KZT
EXCHANGE RATE RETURNS
Further extension introduced by Bollerslev (1986) known as the Generalized
Eurasian
Research
ARCH (GARCH) model which suggests that the time-varying volatility process
Journal is a function of both past disturbances and past volatility. The GARCH (p,q)
July 2020
Vol. 2, No. 2 model may be formalized with the equation below:
q p
w0 + ∑ α iε t2−i + ∑ β jσ t2− j
σ t2 = (3)
=i 1 =j 1
where w0 is a constant parameter, ε t is the innovation process, σ t is the
conditional standard deviation, zt is an independently and identically distributed
(i.i.d.) process. f (.) represents the distribution function with zero mean and unit
variance. Here α i and β j are the standard ARCH and GARCH parameters. Given
that w0 > 0, α i ≥ 0 and β j ≥ 0 the GARCH model requires α i + β i < 1 to
be stationary. Consequently, the GARCH model enables to include the lagged
values of ε t and σ t to the model process.
2 2
Empirical studies have shown that a large number of exchange rate returns exhibit
fat tails and are often characterized by volatility clustering and asymmetry. Both
the ARCH and GARCH models allow taking the first two characteristics into
account, but their distributions are symmetric and therefore fail to model the third
stylized fact, namely the “leverage effect”. Exchange rate returns data commonly
exhibits an asymmetry in that positive and negative shocks to the market do
not bring forth equal responses. In order to solve this problem, many nonlinear
extensions of the GARCH model have been proposed. Among the most widely
spread are the EGARCH, GJRGARCH and APGARCH models.
EGARCH (p,q) Model
Nelson (1991) brought out exponential GARCH (EGARCH) models with a
conditional variance formulation that successfully captured asymmetric response
in the conditional variance. EGARCH model has a number of advantages over
the basic GARCH model, as the non-negativity constraint does not need to be
imposed and the asymmetries are also allowed to be used in this model:
p
ε + γ i ε t −i q
ln (σ t2 ) =
w0 + ∑ α i t −i + ∑ β jσ t2− j (4)
=i 1 =
t −i j 1 σ
where w0 is a constant parameter, ε t is the innovation process, σ t is the
conditional standard deviation. Here α i and β j are the standard ARCH and
GARCH parameters, γ i is the leverage parameter.
In the equation γ i represent leverage effects which accounts for the asymmetry
of the model. While the basic GARCH model requires the constraints to be set,
the EGARCH model allows unrestricted estimation of the variance (Thomas
and Mitchell, 2005: 16). If γ i ≠ 0 impact is asymmetric. If γ i > 0 it indicates
leverage effect exist and if statistically significant, a positive shock (good news)
in the past increases volatility more than a negative shock (bad news). If γ i < 0
it indicates again leverage effect exist and if statistically significant, a negative
shock (bad news) in the past increases volatility more than a positive shock (good
news). However, the general expectation is that negative shocks in financial
markets further increase volatility (Ural, 2010: 93).
GJRGARCH (p,q) Model
The models nested so far have assumed a symmetrical response of volatility to
10ASYMMETRIC GARCH-TYPE AND HALF-LIFE VOLATILITY MODELLING OF USD/KZT
EXCHANGE RATE RETURNS
innovations in the market. However, empirical evidence suggests that positive
Eurasian
and negative returns to the market of equal magnitude will not generate the same Research
response in volatility. Glosten et al. (1993) provided one of the first attempts to Journal
July 2020
model asymmetric or leverage effects with a model which utilizes a GARCH Vol. 2, No. 2
type conditional variance specification. The GJRGARCH model is proposed by
Glosten et al. (1993). The generalized specification for the conditional variance
is given by:
p r q
w + ∑α ε
σ = t
2
0
2
i t −i + ∑γ ε I 2 −
+ ∑ β jσ t2− j (5)
k t −i t − k
=i 1 = k 1 =j 1
where I t − k = 1 if ε t < 0 and 0 otherwise. In this model, good news ( ε t −i > 0 )
−
and bad news ( ε t −i < 0 ) , have differential effects on the conditional variance,
good news has an impact of α i , while bad news has an impact of α i + γ k . If
γ k ≠ 0 , the news impact is asymmetric. A positive (resp. negative) value of the
γ k means that past negative (resp. positive) shocks have a deeper impact on
current conditional volatility than past positive (resp. negative) shocks.
APGARCH (p,q) Model
The ARCH literature has developed rather rapidly. One recent development
in the ARCH literature has focused on the power term by which the data are
to be transformed. Ding et al. (1993) introduced a new class of ARCH model
called The Generalized Asymmetric Power ARCH (APGARCH) model, which
estimates the optimal power term. They also found that the absolute returns and
their power transformations have a highly significant long-term memory property
as the returns are highly correlated. The APGARCH model is presented in the
following framework (Harris and Sollis, 2003: 237-238):
p q
w0 + ∑ α i ( ε t −i − γ iε t −i )δ + ∑ β jσ tδ− j
σ tδ =
(6)
= i 1 =j 1
Where again w0 is a constant parameter, ε t is the innovation process, σ t is
the conditional standard deviation. Here α i and β j are the standard ARCH and
GARCH parameters, γ i is the leverage parameter and δ is the parameter for the
power term. A positive (resp. negative) value of the γ i means that past negative
(resp. positive) shocks have a deeper impact on current conditional volatility than
past positive (resp. negative) shocks. Also, w0 > 0, α i ≥ 0, β j ≥ 0, δ ≥ 0
and γ i ≤ 1 . The model imposes a Box and Cox (1964) transformation in the
conditional standard deviation process and the asymmetric absolute innovations.
In the APGARCH model, good news ( ε t −i > 0 ) and bad news ( ε t −i < 0 ) have
different predictability for future volatility, because the conditional variance
depends not only on the magnitude but also on the sign of ε t .
In the influential paper of Engle (1982), the density function of zt , f (.) was
the standard normal distribution. Failure to capture fat-tails property of high-
frequency financial time series has led to the use of non-normal distributions
to better model excessive third and fourth moments. The most commonly used
are the Student-t distribution and the Generalized Error Distribution (GED).
Bollerslev (1987) tried to capture the high degree of leptokurtosis that is presented
in high frequency data and proposed the Student-t distribution in order to produce
an unconditional distribution with fat tails.
11ASYMMETRIC GARCH-TYPE AND HALF-LIFE VOLATILITY MODELLING OF USD/KZT
EXCHANGE RATE RETURNS
Eurasian
Half-Life Measure of Volatility
Research
Journal
July 2020
Mean reversion means that current information has no influence on the long run
Vol. 2, No. 2 forecast of the volatility. In stationary GARCH-type models, the volatility mean
reverts to its long run level, at a rate given by the sum of ARCH and GARCH
coefficients, which is usually close to one (1) for financial time series.
The average number of time periods for the volatility to revert to its long
run level is measured by the half-life of the volatility shock. One measure of
volatility persistence is the volatility half-life (HL), Engle and Patton (2001)
defined half-life as the time required for the volatility to move half way back
towards its unconditional mean. For example, the persistence parameter in the
EGARCH model is defined as . If PASYMMETRIC GARCH-TYPE AND HALF-LIFE VOLATILITY MODELLING OF USD/KZT
EXCHANGE RATE RETURNS
are summarized in Table 1. Eurasian
Research
Table 1. Descriptive Statistics of USD/KZT Return Series Journal
July 2020
Vol. 2, No. 2
RUSDKZT RUSDKZT RUSDKZT
(1st Sub-Period) (2nd Sub-Period) (3rd Sub-Period)
Observation 1,063 931 801
Minimum -0.071430 -0.017344 -0.017344
Maximum 0.055450 0.027839 0.018936
Standard 0.004548 0.004143
0.007523
Deviation
Skewness 0.564191 0.383801 -0.001702
Kurtosis 23.61967 6.690080 5.418561
Jarque-Bera 18,897.92 551.07 195.23
(Prob.) (0.000) (0.000) (0.000)
ARCH LM 125.46 7.281695 19.65229
(p-value) (0.000) (0.007) (0.000)
Unit Root Tests
ADF-Test -31.35319a -27.91354b -23.96037b
PP-Test -31.35225a -27.83488b -23.76133b
KPSS-Test 0.222973a 0.317725a 0.236011a
a indicates that there is a constant but no trend and b indicates that there is no constant and no trend
in the regression model with lag=0. MacKinnon’s critical value at the 1% significance level for ADF
and PP tests are -3.436290 (with constant), for KPSS test critical value is 0.739000 (with constant)
at the 1% significance level.
Source: Authors’ estimates
It is not surprising that USD/KZT return series exhibit asymmetric and
leptokurtic (fat tails) properties. Thus, the return series of USD/KZT exchange
rates are not normally distributed. The USD/KZT exchange rates return series
are positively skewed except for the 3rd sub-period. Moreover, by Jarque-Bera
statistics and corresponding p-value we reject the null hypothesis that returns
are well approximated by the normal distribution. The USD/KZT return series
is subjected to three unit root tests to determine whether stationarity I(0). All
Augmented-Dickey–Fuller (ADF), Phillips–Peron (PP) and Kwiatkowski,
Phillips, Schmidt, and Shin (KPSS) test statistics are rejected the hypothesis
of a unit root at the 1% level of confidence. ARCH LM statistics highlight the
existence of conditional heteroskedastic ARCH effect.
From the descriptive graphics presented in Figure 1, several volatility periods
can be observed. These graphical expositions show that USD/KZT exchange
rates return series exhibit volatility clustering which means that there are
periods of large absolute changes tend to cluster together followed by periods of
relatively small absolute changes.
13ASYMMETRIC GARCH-TYPE AND HALF-LIFE VOLATILITY MODELLING OF USD/KZT
EXCHANGE RATE RETURNS
Eurasian
Figure 1. Daily Log-Returns for USD/KZT Exchange Rates Return Series
Research
Journal
July 2020
Vol. 2, No. 2
Source: Authors’ estimates
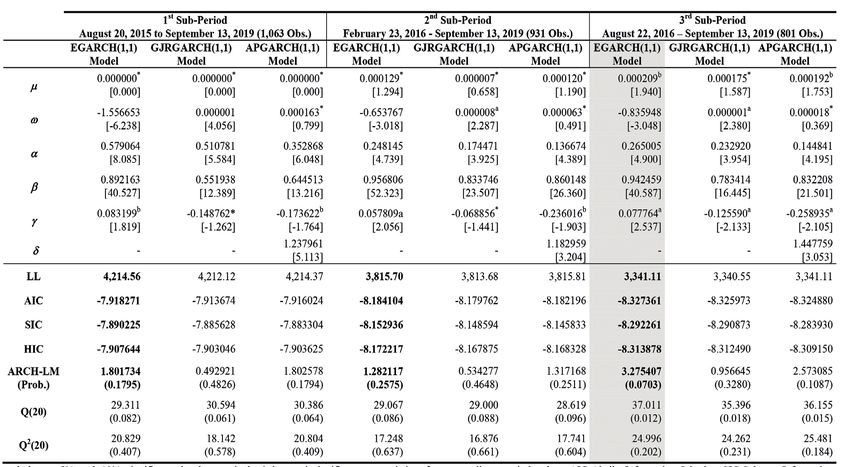
Estimation Results
In this subsection, for the volatility analysis the EGARCH, GJRGARCH and
APGARCH models are performed for return series under Gauss, Student-t and
GED (Generalized Error Distribution) distributions. The standard of model
selection is based on in-sample diagnosis including Akaike Information Criterion
(AIC), Schwarz Information Criterion (SIC), Hannan-Quinn Information
Criterion (HIC), log-likelihood (LL) values, and Ljung-Box Q and Q2 statistics
on standardized and squared standardized residuals respectively. Under every
distribution, the model which has the lowest AIC, SIC and HIC or highest LL
values and passes the Q-test simultaneously is adopted.
In summary, ranking by AIC, SIC, HIC and LL favors the EGARCH (1,1)-GED
distribution specification with the first order lags in USD/KZT return series.
Table 2 reports the estimation results of the asymmetric GARCH-type models
under GED distribution. To conserve space the results of the models with other
distributions declined to present, but they are available upon request.
Because of the ranking by AIC, SIC, HIC and LL favors the EGARCH (1,1)-
GED distribution specification in USD/KZT return series, only coefficients
related to EGARCH model were interpreted. Table 2 presents the results of this
estimation procedure and from this table one can see that all of the ARCH and
GARCH coefficients are statistically significant at the 1% level for three sub-
periods. Further, the GARCH ( β ) coefficients were lower than 1 indicating
that the models are stationary and the shocks to the model are transitory rather
than permanent. Also β indicates a high degree of volatility persistence. β
takes values between 0.892163 to 0.956806 suggesting that there are substantial
memory effects.
As all asymmetric GARCH models the EGARCH model also includes a leverage
term ( γ ) which allows positive and negative shocks of equal magnitude to elicit
an unequal response from the market. Table 2 presents details of this EGARCH
model leverage term ( γ ) and reveals that for all sub-periods fitted; the
estimated coefficient was positive and statistically significant. Leverage term (
γ ) is 0.083199, 0.057809 and 0.077764 for three sub-periods respectively. This
means that positive shocks lead to higher subsequent volatility of USD/KZT
returns than negative shocks.
14ASYMMETRIC GARCH-TYPE AND HALF-LIFE VOLATILITY MODELLING OF USD/KZT
EXCHANGE RATE RETURNS
The EGARCH model results for three sub-periods given in Table 2 show that Eurasian
it succeeds in taking into account all the dynamical structure exhibited by the Research
Journal
returns and volatility of the returns as the Ljung-Box statistics for up to 20 July 2020
Vol. 2, No. 2
lags on the standardized residuals (Q) (except 3rd sub-period) and the squared
standardized residuals (Q2) are non-significant at the 5% level. There is also no
evidence of remaining ARCH effects according to the ARCH-LM test statistic
with lag 1. According to the AIC, SIC, HIC and LL statistics the EGARCH (1,1)-
GED distribution specification in USD/KZT return series for 3rd sub-period has
been determined as the most successful model.
Table 2. Model Estimation Results for Three Sub-Periods of the USDKZT
Exchange Rate Returns
a, b denote 5% and 10% significance level respectively; * denotes insignificancy; t-statistics of corresponding tests in brackets. AIC-Akaike
Information Criterion, SIC-Schwarz Information Criterion, HIC-Hannan-Quinn Information Criterion, LL is the value of the maximized log-
likelihood. The ARCH-LM denotes the ARCH test statistic with lag 1. Q(20) and Q2(20) are the Ljung-Box statistics for remaining serial
correlation in the standardized and squared standardized residuals respectively using 20 lags with p-values in parenthesis.
Table 2. Model estimation results for three sub-periods of the USDKZT exchange rate returns
Source: Authors' estimates
15ASYMMETRIC GARCH-TYPE AND HALF-LIFE VOLATILITY MODELLING OF USD/KZT
EXCHANGE RATE RETURNS
Eurasian
Following Nelson (1991), for EGARCH model, a stationary solution of Equation
Research (8) is given by:
Journal
2
q p
exp ω0 + ∑α i
∑ β j
July 2020
Vol. 2, No. 2 σ= 1 − (8)
= π
i 1= j 1
Table 3 shows the heteroskedastic (EGARCH) volatility, homoskedastic
volatility (standard deviation) and half-life coefficients for three sub-periods.
Table 3. Volatility and Half-life Estimation Results
1st Sub-period 2nd Sub-Period 3rd Sub-Period
Heteroskedastic (EGARCH) Volatility
0,006249 0,005113 0,004398
(HeV)
Homoskedastic Volatility (HoV) 0,007523 0,004548 0,004143
Volatility Comparison HoV > HeV HoV < HeV HoV < HeV
Half-life (HL) (days) 6 16 12
Source: Authors’ estimates
According to Table 3 the results show that homoscedastic volatility (HoV)
and heteroskedactic (EGARCH) volatility (HeV) are gradually decreasing
during sub-periods. However, HoV is bigger than HeV in the 1st sub-period.
For the 2nd and 3rd sub-periods, HoV is lower than HeV means that the effect
of shocks shrinks and volatility decreased after exchange rate regime change.
The persistence parameter ( β ) in the EGARCH model is lower than 1 that
means the return series exhibit mean reversion. However, the half-life (HL) was
6 days, 16 days and 12 days for 1st sub-period, 2nd sub-period and 3rd sub-period
respectively. Because of the EGARCH (1,1)-GED distribution specification
in USD/KZT return series for 3rd sub-period has been determined as the most
successful model, after the shocks occurs in the USD/KZT volatility than reverts
to its mean in 12 days.
CONCLUSION
Because of the weakening of the Chinese yuan and the decrease in the price of
Brent crude oil from early 2015, the pressure on the economy of Kazakhstan was
exacerbated. This economic condition forced the National Bank of Kazakhstan
to switch to a floating rate in August 20, 2015. Hence, analysis period started
from the date of regime change. The paper considers the USD/KZT exchange
rates for the period August 20, 2015 to September 13, 2019 (1,063 observations).
However, the analysis period is divided into three sub-periods in order to
differentiate the effects of devaluation on the return volatility of USD/KZT
exchange rate. The main purpose of this paper is to examine the adequacy of the
asymmetric GARCH-type models to capture the stylized features of volatility in
USD/KZT exchange rate returns. Moreover, the average number of time periods
for the volatility to revert to its long run level is measured by the half-life of the
volatility shock.
The results suggest that in the presence of asymmetric responses to innovations
in the Kazakhstan foreign exchange market, the EGARCH (1,1) - GED model
which accommodates the kurtosis of financial time series is preferred. According
16ASYMMETRIC GARCH-TYPE AND HALF-LIFE VOLATILITY MODELLING OF USD/KZT
EXCHANGE RATE RETURNS
to the AIC, SIC, HIC and LL statistics EGARCH (1,1)-GED distribution Eurasian
specification in USD/KZT return series for 3rd sub-period has been determined as Research
Journal
the most successful model. These results also show that the USD/KZT exchange July 2020
Vol. 2, No. 2
rate returns have strong mean reversion and short half-life. Based on half-life
parameter, after the shocks occurs in the USD/KZT volatility than reverts to its
mean in 12 days.
Consequently, in Kazakhstan, which shifted from a fixed exchange rate regime
to a floating exchange rate regime, the volatility effect was high in the first 6
months and decreased due to the weakening of macroeconomic shocks in the
next 6 months. For countries that have similar economic structure, the effects of
volatility shocks should be examined comparatively by expanding analyzes at
different exchange rates.
REFERENCES
Abdalla, Suliman Z.S. (2012). “Modelling Exchange Rate Volatility Using
GARCH Models: Empirical Evidence from Arab Countries”. International
Journal of Economics and Finance 4(3): 216-229.
Ahmed, Rizwan R., Jolita Vveinhardt, Dalia Streimikiene and Zahid A. Channar
(2018). “Mean Reversion in International Markets: Evidence from G.A.R.C.H.
and Half-Life Volatility Models”. Economic Research-Ekonomska Istrazivanja
31(1): 1198-1217.
Baltagi, Badi H. (2000). Econometrics, Fourth Edition. Springer Press. USA.
Bollerslev, Tim (1986). “Generalized Autoregressive Conditional Heteroscedas-
ticity”. Journal of Econometrics 31(3): 307-327.
Bollerslev, Tim (1987). “A Conditionally Heteroskedastic Time Series Model
for Speculative Prices and Rates of Return”. Review of Economics and Statistics
69(3): 542-547.
Box, G.E.P. and David R. Cox (1964). “An Analysis of Transformation”. Jour-
nal of the Royal Statistical Society 26(2): 211-252.
Brooks, Chris (2002). Introductory Econometrics for Finance. Cambridge Uni-
versity Press. UK.
Chatfield, Chris (2003). The Analysis of Time Series: An Introduction, Sixth
Edition. Chapman and Hall/CRC Publishing. USA.
Ding, Zhuanxin, Clive W.J. Granger and Robert F. Engle (1993). “A Long Mem-
ory Property of Stock Market Returns and a New Model”. Journal of Empirical
Finance 1(1): 83-106.
Engle, Robert F. and Andrew J. Patton (2001). “What Good is a Volatility Mod-
el”. Quantitative Finance 1(2): 237–245.
Engle, Robert F. (1982). “Autoregressive Conditional Heteroscedasticity with
Estimates of the Variance of United Kingdom Inflation”. Econometrica 50(4):
987–1007.
Fiser, Radovan and Roman Horvath (2010). “Central Bank Communication and
Exchange Rate Volatility: A GARCH Analysis”. Macroeconomics and Finance
17ASYMMETRIC GARCH-TYPE AND HALF-LIFE VOLATILITY MODELLING OF USD/KZT
EXCHANGE RATE RETURNS
Eurasian
in Emerging Market Economies 3(1): 25-31.
Research
Journal Gbenro, Nathaniel and Richard K. Moussa (2019). “Asymmetric Mean Rever-
July 2020
Vol. 2, No. 2 sion in Low Liquid Markets: Evidence from BRVM”. Journal of Risk and Fi-
nancial Management 12(38): 1-19.
Glosten, G. Lawrence, Ravi Jagannathan and David E. Runkle (1993). “On the
Relation Between the Expected Value and the Volatility of the Nominal Excess
Return on Stocks”. Journal of Finance 48(5): 1779-1801.
Hafner, Christian M. (1998). “Estimating High-Frequency Foreign Exchange
Rate Volatility with Nonparametric ARCH Models”. Journal of Statistical Plan-
ning and Inference 68(2): 247-269.
Hamadu, Dallah and Ismaila Adeleke (2009). “On Modelling the Nigerian Cur-
rency (Naira) Exchange Rates Against Major Regional and World Currencies”.
NUST Journal of Business and Economics 2(1): 42-52.
Harris, Richard and Sollis Robert (2003). Applied Time Series Modeling and
Forecasting. John Wiley and Sons. USA.
Kamal, Yasir, Hammad Ul-Haq, Usman Ghani and Muhammad M. Khan (2012).
“Modeling the Exchange Rate Volatility, Using Generalized Autoregressive
Conditionally Heteroscedastic (GARCH) Type Models: Evidence from Paki-
stan”. African Journal of Business Management 6(8): 2830-2838.
Longmore, Rohan and Wayne Robinson (2004). “Modelling and Forecasting
Exchange Rate Dynamics: An Application of Asymmetric Volatility Models”.
Bank of Jamaica Working Paper WP2004/03.
Nelson, Daniel B. (1991). “Conditional heteroskedasticity in asset returns: A
new approach”. Econometrica 59(2): 347-370.
Olowe, Rufus A. (2009). “Modeling Naira/Dollar Exchange Rate Volatility: Ap-
plication of GARCH and Asymmetric Models”. International Review of Busi-
ness Research Papers 5(3): 377-398.
Thomas, Stuart and Heather Mitchell (2005). “GARCH Modeling of High-Fre-
quency Volatility in Australia’s National Electricity Market. Discussion Paper”.
Melbourne Centre for Financial Studies Discussion Paper.
Ural, Mert (2010). Yatirim Fonlarinin Performans ve Risk Analizi (Performance
and Risk Analysis of Investment Funds). First edition. Ankara: Detay Yayincilik.
Wang, Alan T. (2006). “Does Implied Volatility of Futures Currency Option
Imply Volatility of Exchange Rates”. Physica A: Statistical Mechanics and its
Applications 374(2): 773-782.
Yoon, Seok and Lee Ki Seong (2008). “The Volatility and Asymmetry of Won/
Dollar Exchange Rate”. Journal of Social Sciences 4(1): 7-9.
Zholamanova, Makpal, Maya Arzayeva, Raikhan Doszhan, Assel Turlybekova
and Abai Kukiev (2018). “Devaluation in Kazakhstan: History, Causes, Conse-
quences”. European Research Studies Journal 21(4): 831-842.
18You can also read