Frozen Out
The real value of the local housing allowance in the final year of the benefit freeze

                                                                      November 2019
←
→
Page content transcription
If your browser does not render page correctly, please read the page content below
Frozen Out
The real value of the local housing allowance in the final year of the benefit freeze
November 2019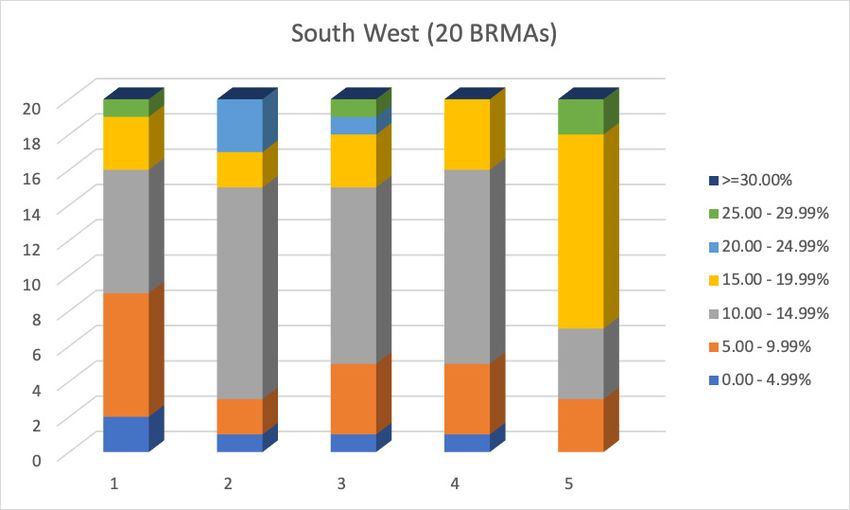
About CIH
    Chartered Institute of Housing (CIH) is the independent voice for housing and the home of professional
    standards. Our goal is simple – to provide housing professionals and their organisations with the
    advice, support and knowledge they need to be brilliant. CIH is a registered charity and not-for-profit
    organisation. This means that the money we make is put back into the organisation and funds the
    activities we carry out to support the housing sector. We have a diverse membership of people who work
    in both the public and private sectors, in 20 countries on five continents across the world.
    Further information is available at: www.cih.org

      We propose to limit increasing the local housing allowance in line with the CPI index from April 2013.
      We have said that we are committed to making savings from this measure up to 2014-15. If it then
      becomes apparent that local allowance rates and rents are out of step, they can be reconsidered. We
      will continue to monitor the path of market rents until 2015 and the Secretary of State will be able to
      review the LHA rate, or uprate it by some other method, should the need arise. We all recognise that
      over any kind of longer-term run rents tends to move with average earnings, not with average prices.
      Any extrapolation out [to 2030] will have a big gap, but we are not talking about that here. We are
      talking about a measure which is locked in for that two-year period at a time of great difficulty when we
      are trying to bear down on prices.
      Lord Freud, speaking on the Welfare Reform Bill on the proposal to limit the uprating of local housing
      allowance to one percent for financial years 2014 and 2015.
      Lords Hansard, 14 December 2011, Cols 1324-25

2
What are the issues?
Basic allowances in working-age benefits for essential living expenses other than rent have not been fully
uprated in line with inflation as measured by the consumer prices index (CPI) since April 2013 and, since
April 2016, have been frozen. Although the freeze is due end in April 2020, there is no commitment to
unwind the previous seven years losses so that in real terms, these basic allowances are now only worth
only 91 per cent of their 2012 value. Over the course of a year this loss is equivalent to going without
anything for living expenses for a month.
But private renters face even greater hardship because a similar freeze has also been applied to help
with rent through universal credit/housing benefit. Prior to April 2012 the amount of help was based on
the full rent, subject to a maximum figure known as the ‘local housing allowance’ (LHA). The LHA figure
was calculated to ensure it provided access to at least 30 per cent of homes in each distinct local housing
market. The benchmark was set at 30 per cent as being roughly the proportion of private renters who
receive housing benefit nationally. However, the calibration of LHA rates to local rents was ended in 2013
and since 2014 their uprating has been followed that of other allowances (including the four-year freeze).
Now, in the final year of the freeze, LHA rates are substantially below what they need to be to cover the
rent on at least 30 per cent of homes in most local housing markets. Since the number of properties
available at or below the LHA rate is now less than number of private renters claiming benefit, it is
inevitable that large numbers will face a shortfall between what they pay and the help they receive. The
shortfall must be covered out of their basic benefits, which have also declined in real terms.

Why is this a problem?
Nearly two out of every five households in the UK (37 per cent) live in rented housing and there is a
severe shortage of social rented homes which are truly affordable for working-age households. The lack
of affordable homes means rents are consuming a rising share of household budgets.
For private renters who rely on benefits to help pay their rent, including those in low-paid employment,
it is becoming increasingly difficult to find a home within the LHA rate. To find a home many households
have no choice but to cover the shortfall out of their already inadequate income, putting household
budgets under severe stress. As a result, household resilience towards homelessness falls, while their
dependence on emergency support, such as food bank use, rises.
Against a background of a severe shortage of social rented homes, rising rents and shrinking household
budgets, the only realistic solution available for many local councils to respond to homelessness is to
secure a privately rented home. But the shrinking value of LHA, especially in high rent areas, threatens to
close this down altogether and is placing homelessness services under great pressure.
The Government recently confirmed the end of the benefits freeze from April 2020 but this merely locks
in the real terms losses that have already accrued and doesn’t apply to help with rent through the LHA
which requires separate legislation.

                                                                                                              3
What needs to happen?
    CIH is calling on the government over the lifetime of the next parliament to commit to:
    •   uprating allowances for essential living expenses (other than rent) every year by at least the rate of
        inflation and to fully restore them to at least their 2012 real-terms value
    •   fully restore the real value of the LHA within universal credit and housing benefit so that it covers the
        rent for at least 30 per cent of homes in every housing market area
    •   addressing the serious shortage of truly affordable homes by ensuring that at least 90,000 homes at
        social rents are built each year in line with the latest assessment of need

    Setting the scene
    Housing benefit (HB) for private renters is based on the weekly rent payable or a local maximum rate
    known as the local housing allowance (LHA), whichever is the lower. The LHA rates are also used to
    calculate the housing-costs element of universal credit (UC) for working-age private renters. Originally
    LHA rates were set using local market evidence so that they covered the rent of at least (50 per cent
    homes, or from April 2011), 30 per cent of homes (in the locality). But since April 2013 LHA rates have
    been set using the previous year’s rates uprated by: the consumer prices index in 2013; one per cent for
    the next two years; and zero – frozen - from April 2016 for four years.
    From April 2014 the UK government introduced ‘targeted affordability funding’ (TAF) to shore up
    selected LHA rates that had drifted furthest from real local market rents. In the final year of the benefit
    freeze this report examines how far LHA rates in England have declined in their real value from covering
    at least 30 per cent of the market. The effectiveness of TAF in slowing this decline, was covered in our
    previous report Missing the Target (CIH, 2018).
    Before the start of each financial year, the Valuation Office Agency (VOA) – which is responsible for
    collecting the rental market evidence used to calibrate LHA in England – publishes the new LHA rates
    alongside the figure for the 30th percentile rent. However, the rental data (‘list of rents’) used to calculate
    these has only been publicly available as series of individual (picture only) low-resolution graphs on
    the VOA’s LHA direct website. There were 760 of these, one for each of the five LHA categories (shared
    accommodation rate, one bedroom, two bedrooms, three bedrooms and four bedrooms) across 152
    broad rental market areas (BRMAs). This has made it impractical to independently calculate the current
    relative value of each LHA rate.
    The first accurate estimates of the proportion of properties available at or below the LHA rate for the
    first three categories of dwelling were published by Crisis in its Cover the Cost report. These were based
    on the 2018/19 set of LHA rates and were obtained by using software that scans each of the individual
    graphs mechanically and accurately estimate the values (albeit with a small margin of error).
    In May 2019, the VOA published the first full data set from its list of rents for England for the year
    2019/20. The full data set contains just under 472,000 rents. The Chartered Institute of Housing has
    processed this data and has calculated the amount of property available at or below the LHA for each of
    these 760 rates. This report summarises the results.

4
What happens to LHA rates from April 2020?
The Government recently confirmed that benefits freeze will end in April 2020. This means that the
previous annual uprating policy is restored, whereby existing benefit rates are indexed by the CPI figure
for the previous September (which in this case is 1.7 per cent). But a general uprating doesn’t also
automatically apply to LHA rates, which fall under separate legislation. Even if LHA rates are included,
it falls far short of restoring their real value to the 30th percentile rent. It also implies that TAF – which
redistributes half of the savings that accrue by not indexing LHA rates – also from a three per cent that
TAF provides and even if the Government did decide. Without TAF those LHA rates that have declined
the steepest wont benefit from a three per cent uplift and even if did decide to index LHA rates by CPI, for
every LHA rate where local rent inflation exceeded this its real value would decline even further.
In the Lord’s debates on the Welfare Reform Bill in 2011, the Minister (Lord Freud), accepted that
rental growth trends follow increases in wages rather than prices. The Estates Gazette (October 2019)
reports that UK rental growth was two per cent in the last quarter of 2019 – the fastest rise for the past
three years and in Bristol, Leeds and Nottingham rents have risen faster than the average UK wage
growth of four per cent.
For any given LHA rate the effects of the freeze will only start to unwind from April 2020 if local rent
inflation is less than 1.7 per cent (or in subsequent years less than the September CPI figure). Even then
the rate at which it improves is the difference between the two, so the lower the rate of inflation the
slower the recovery. The Office of National Statistics index of private rental housing prices for September
2019 is 1.5 per cent which suggests there will be no noticeable improvement in April 2020 from the
position in this report. Broadly, to fully restore LHA rates back to the 30th percentile rent within the
lifetime of the next Parliament would require successive annual indexed increases at a rate of two per
cent above CPI.
Findings
The results in this section show the proportion of the market that is available at or below the LHA rate. In
most cases, this is the same as the percentile figure that the LHA rate represents, but if there is more than
one rent in the data set at the LHA rate then the proportion of the market is available calculated using all
of the rents at or below the LHA rate.
The proportion of households in each LHA category is approximately as follows:
Shared 1 bedroom 2 bedrooms 3 bedrooms 4 bedrooms
Caseload 15% 29% 37% 14% 5%
This is based on HB caseload figures for April 2013 and April 2014 before large scale migration to UC
took place. The data is taken using the DWP Stat-Xplore on line tool. As at present it is not possible to
break down the UC caseload by LHA category, but these proportions should provide a rough guide to
the distribution of cases. There may be some reduction in the proportion of households in the shared rate
and one-bedroom rate, as these contain a higher proportion of jobseekers (and the number of people
out of work has since fallen). But overall, we would expect that around 90 per cent of cases would still fall
within the first four property sizes. Caseload figures from the same date also show that most of claimants
entitled to the four-bedroom rate live in households with more than one benefit unit (such as families with
adult children).
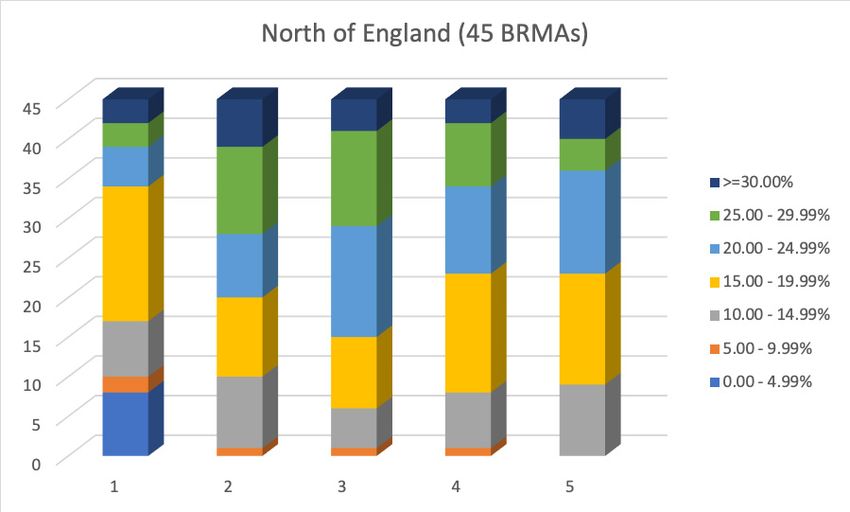
5For the purpose of our analysis we divided the 152 BRMAs in England into three super-regions (north
of England, central England and south of England) and two regions (London and south west England).
Within each of these the pattern of distribution of available accommodation is broadly similar for each
LHA category. The north of England super region comprises 45 BRMAs that fall wholly within, or the
largest part of falls within, the North-East, North-West and Yorkshire and the Humber English regions
(BRMAs aren’t coterminous with local authority boundaries). Central England comprises 33 BRMAs
in the East Midlands and West Midlands English regions and the counties of Norfolk, Suffolk and
Cambridgeshire. The South of England comprises of 40 BRMAs in the South East region and in the
counties of Bedfordshire, Hertfordshire and Essex. The London and south west comprise of 14 and 20
BRMAs respectively that fall wholly or largely within their respective English regions.
Overall results
For over one quarter of LHA rates, less than ten per cent of the market is available. This rises to over one
third on LHA rates for the four smallest sized categories. In six out of every ten LHA rates, less than 15
per cent of accommodation is available and this is true for every LHA category and in every region and
super-region, except for the north of England or, in the case of the four-bedroom rate only, the south west
of England. Around two thirds of the total LHA caseload in England falls outside the north and the four-
bedroom category.
Shared accommodation rate (category A)
For claimants entitled to the shared accommodation rate, less than 15 per cent of the market
was available in six out of every ten BRMAs. The shared accommodation rate has the highest
proportion of BRMAs of any LHA category where less than ten per cent of the market is available and
the highest proportion of BRMAs where less than five per cent of the accommodation is available. Even
then this fails to take account of the fact that a significant number of claimants entitled to this rate will be
living in self-contained accommodation and so will face a substantial shortfall between their actual rent
and their LHA entitlement. We also know that in some BRMAs, the amount of shared accommodation
available for letting is limited. It is entirely possible that there is a significant number of BRMAs where
the amount of accommodation that is available within the LHA is exceeded by the number of benefit
claimants seeking it.
The shared accommodation rate also has the widest geographic distribution of BRMAs where there is a
severe shortage of accommodation (less than five per cent of the market) within the LHA rate. Within the
top fifth of worst cases there is at least one BRMA in every English region. There are six BRMAs (out of
152) where there is no accommodation available at the LHA rate, and four of these are in the north
of England.
6One-bedroom rate (category B)
In around two thirds of BRMAs, less than 15 per cent of the market is available within the LHA rate. This
rises to over 95 per cent of BRMAs in London and the south of England, and in London there are no
BRMAs where at least 15 per cent of the market is available (in central England and the south-west, the
proportions are 60 per cent and 75 per cent respectively). In the north of England, the worst affected
areas for this category are the Manchester, Leeds, Sheffield and Kendal (which largely falls within the Lake
District national park).
Two-bedrooms rate (category C)
Less than ten per cent of the market is available at or below the LHA rate in one in every three BRMAs and
less than 15 per cent is available in nearly two out of every three BRMAs. Outside of the north of England
there is less than 15 per cent of the market available in at least three out of four BRMAs in every other
region (compared to one in every three in the north). But in London and the south of England there is
only one BRMA (out of 54) where there is more than 15 per cent available. We estimate that between 65
and 70 per cent of the two-bedroom caseload falls outside the north of England. In the north of England,
there is less than 15 per cent of the market available in Sheffield, York and most of Greater Manchester
and only just over 15 per cent in Leeds. These are major centres of population with significant benefit
caseloads. The map (with thanks to Crisis) shows the percentage of private rented homes available within
the two-bedroom LHA rate for 2019/20 across England, Wales and Scotland.
7England
0–5%
5–10%
10–15%
15–20%
20–25%
25% and above
Scotland
0–5%
5–10%
10–15%
15–20%
20–25%
25% and above
Wales
0–5%
5–10%
10–15%
15–20%
20–25%
25% and above
8Three-bedrooms rate (category D)
The pattern for the three-bedrooms rate is very similar to the two-bedrooms rate with slightly smaller
proportion of BRMAs (31 per cent) where there less than ten per cent of the market available and slightly
higher proportion (68 per cent) where less than less than 15 per cent is available. However, the BRMAs
affected are even more heavily concentrated in central and southern England so that there is less than
15 percent available nine out of every ten BRMAs whereas in the north it is in one out of every six. There
is less than 15 per cent of the market available in just under eight of every ten BRMAs in central and
south-west England and London and, in the rest of south, there are only two BRMAs (out of 54) where
there is more than 15 per cent available. Around 70 per cent of the category D caseload for England falls
outside the north. As with the one and two-bedrooms categories, the worst affected areas in the north are
Sheffield and most of Greater Manchester where there is less than 15 per cent of the market available.
Four-bedrooms rate (category E)
The four-bedrooms rate accounts for around five per cent of the LHA caseload. There is less than 15 per
cent available in just over half of English BRMAs, however the cash shortfalls between the LHA rate and
the 30th percentile rent tend to be significantly higher: see Missing the Target. There are no BRMAs in
London where there is at least 15 per cent of the market available. There is less than 15 per cent of the
market available in two out of every BRMAs in the south and central England (the latter being slightly
worse). In the north and south-west there is less than 15 per cent of four-bedroomed available in one in
five and just over one in three respectively of BRMAs. As with the other categories, greater Manchester
and Sheffield are among the worst affected areas in the north, but there is also less than 15 per cent
availability of four-bedroomed property in Tyneside, St Helens, East Cheshire and Rotherham.
9ANNEX B: summary results by English region /super region
Key X axis:
1 = shared accommodation rate
2 = one-bedroom rate
3 = two-bedrooms rate
4 = three bedrooms rate
5 = four bedrooms rate
Note: for the purpose of this analysis the following regions/super regions comprise of the those BRMAs
that fall wholly within, or the largest part of falls within:
• the North of England: the North-East, North-West and Yorkshire and the Humber English regions
• Central England: the East Midlands, West Midlands and the counties of Norfolk, Suffolk,
Cambridgeshire
• South of England: the South-East region and the counties of Bedfordshire, Hertfordshire and Essex
• London: the London region
• South West: the South West region
1011
12
ANNEX B: results by individual BRMA.
Key:
•   CAT A = shared accommodation
•   CAT B, one-bedroom accommodation
•   CAT C, two-bedroomed accommodation
•   CAT D, three-bedroomed accommodation
•   CAT E, four-bedroomed accommodation
Note BRMAs are sorted by closest corresponding English region but BRMA boundaries are not
coterminous with local authority areas so parts of some BRMAs may fall within another region/regions.
The following tables show the percentage of private rented homes available within the LHA rate in
2019/20 for each BRMA in England.

North East

BRMA                        CAT A           CAT B           CAT C           CAT D            CAT E
Darlington                  1.3%            29.8%           24.4%            24.2%           21.7%
Durham                      20.9%           31.9%           29.0%            25.6%           29.7%
Northumberland              0.0%            18.4%           22.1%            24.6%           15.5%
Sunderland                  0.0%            26.2%           29.0%            29.1%           17.0%
Teesside                    23.8%           26.8%           32.2%            31.2%           32.1%
Tyneside                    13.1%           27.6%           28.4%            19.9%           14.8%

                                                                                                        13
North West
BRMA CAT A CAT B CAT C CAT D CAT E
Barrow-in-Furness 15.8% 10.4% 16.0% 12.1% 15.6%
Bolton and Bury 15.3% 10.7% 12.0% 10.5% 12.0%
Central Greater Manchester 11.6% 10.9% 10.6% 7.6% 13.2%
Central Lancs 5.0% 22.4% 24.4% 25.8% 17.7%
East Cheshire 16.5% 24.3% 18.2% 15.1% 12.6%
East Lancs 20.6% 23.3% 24.9% 21.4% 17.3%
Fylde Coast 38.6% 31.9% 30.6% 27.0% 30.4%
Greater Liverpool 11.0% 28.0% 27.5% 30.6% 28.4%
Kendal 18.9% 9.8% 14.9% 15.7% 10.5%
Lancaster 2.5% 17.3% 25.3% 14.0% 18.4%
North Cheshire 1.1% 24.6% 24.0% 25.6% 19.8%
North Cumbria 10.5% 34.1% 22.6% 20.3% 21.5%
Oldham & Rochdale 16.7% 15.5% 18.3% 19.6% 21.9%
South Cheshire 2.9% 15.1% 21.9% 17.2% 24.6%
Southern Greater Manchester 0.0% 12.0% 6.1% 11.5% 12.0%
Southport 16.7% 25.6% 30.5% 14.9% 24.5%
St Helens 20.8% 23.5% 30.8% 14.7% 10.8%
Tameside & Glossop 18.7% 21.5% 21.9% 26.3% 17.5%
West Cheshire 18.4% 23.5% 25.6% 21.2% 19.8%
West Cumbria 15.8% 16.8% 27.2% 22.7% 21.0%
West Pennine 15.3% 28.7% 27.2% 21.8% 17.2%
Wigan 18.9% 34.4% 16.6% 23.3% 25.4%
Wirral 39.3% 38.6% 28.2% 42.2% 23.1%
14Yorkshire and the Humber
BRMA CAT A CAT B CAT C CAT D CAT E
Barnsley 25.1% 10.1% 20.6% 18.5% 23.4%
Bradford & South Dales 10.1% 29.8% 24.4% 17.9% 23.6%
Doncaster 18.0% 17.4% 22.1% 24.9% 30.8%
Grimsby 21.5% 36.0% 20.3% 19.2% 21.5%
Halifax 15.0% 28.6% 25.6% 29.9% 36.4%
Harrogate 13.5% 19.5% 16.2% 16.2% 17.2%
Hull & East Riding 31.4% 14.6% 19.9% 24.3% 31.2%
Kirklees 26.0% 27.5% 19.6% 18.2% 24.2%
Leeds 11.1% 13.2% 16.8% 29.7% 28.6%
Richmond & Hambleton 16.3% 23.9% 22.0% 17.3% 18.2%
Rotherham 0.0% 12.5% 22.7% 19.8% 14.9%
Scarborough 6.6% 25.3% 25.2% 23.0% 24.9%
Scunthorpe 18.0% 16.1% 18.0% 15.4% 17.8%
Sheffield 26.6% 14.1% 13.0% 13.1% 14.1%
Wakefield 18.2% 16.3% 28.1% 16.8% 20.6%
York 15.7% 15.8% 14.2% 15.8% 18.7%
East Midlands
BRMA CAT A CAT B CAT C CAT D CAT E
Chesterfield 20.6% 18.3% 19.1% 21.8% 22.8%
Derby 22.3% 16.9% 17.6% 14.5% 14.0%
Grantham & Newark 14.3% 11.1% 11.0% 13.0% 9.4%
Leicester 4.2% 14.2% 13.5% 10.0% 10.4%
Lincoln 11.8% 15.4% 14.8% 18.0% 16.0%
Lincolnshire Fens 14.7% 14.3% 9.9% 11.7% 8.8%
North Nottingham 13.5% 13.1% 13.9% 29.7% 21.2%
Northampton 6.2% 2.9% 4.0% 2.7% 5.9%
Northants Central 5.0% 5.2% 3.4% 6.4% 8.4%
Nottingham 18.2% 15.4% 11.1% 12.7% 12.5%
Peaks & Dales 25.8% 16.4% 15.2% 13.7% 24.5%
Wolds and Coast 12.8% 16.2% 15.0% 14.0% 15.3%
15West Midlands
BRMA CAT A CAT B CAT C CAT D CAT E
Birmingham 10.8% 8.4% 12.1% 8.0% 11.2%
Black Country 29.8% 21.0% 14.1% 14.6% 17.5%
Coventry 5.3% 10.4% 11.0% 10.2% 9.9%
Eastern Staffordshire 15.0% 7.7% 12.4% 11.1% 13.5%
Herefordshire 5.3% 17.5% 17.9% 11.3% 11.2%
Mid Staffs 17.7% 18.5% 15.2% 13.6% 12.3%
Rugby & East 7.8% 3.8% 2.0% 2.4% 5.0%
Shropshire 19.3% 21.3% 19.9% 16.8% 24.0%
Solihull 2.8% 13.6% 16.5% 15.8% 13.0%
Staffordshire North 5.8% 24.3% 13.8% 11.8% 12.2%
Warwickshire South 4.7% 3.9% 10.4% 13.2% 13.2%
Worcester North 19.2% 20.6% 13.3% 14.0% 15.5%
Worcester South 12.9% 6.5% 12.9% 11.3% 11.1%
16East of England
BRMA CAT A CAT B CAT C CAT D CAT E
Bedford* 10.2% 4.5% 7.3% 9.8% 5.5%
Bury St Edmunds** 22.4% 13.3% 10.5% 11.9% 12.5%
Cambridge* 10.4% 5.4% 4.8% 3.8% 6.6%
Central Norfolk & Norwich** 14.2% 8.7% 8.1% 11.7% 16.5%
Chelmsford* 1.4% 8.8% 8.8% 8.8% 3.1%
Colchester* 23.8% 9.9% 7.9% 6.2% 11.3%
Harlow & Stortford* 3.0% 3.4% 3.6% 5.9% 19.6%
Huntingdon** 25.8% 5.2% 3.4% 4.7% 7.8%
Ipswich** 1.5% 8.1% 6.3% 8.5% 8.2%
Kings Lynn** 11.2% 10.3% 15.7% 12.0% 9.9%
Lowestoft & Great Yarmouth** 16.7% 14.1% 13.4% 14.6% 17.7%
Luton* 4.6% 3.8% 6.2% 3.2% 4.0%
Peterborough** 14.7% 7.8% 9.5% 5.7% 8.9%
South East Herts* 21.6% 7.6% 9.5% 6.2% 17.1%
South West Essex* 11.5% 5.2% 3.0% 6.1% 0.0%
South West Herts* 12.3% 4.7% 8.3% 6.0% 14.6%
Southend* 16.0% 7.2% 8.3% 5.7% 8.1%
Stevenage & North Herts* 19.0% 5.4% 3.6% 5.6% 8.6%
* BRMA included in the greater South of England super region
** BRMA included in Central England super region
17London
BRMA CAT A CAT B CAT C CAT D CAT E
Central London 15.0% 0.6% 0.5% 0.2% 0.8%
Inner East London 2.3% 7.2% 6.4% 3.5% 5.0%
Inner North London 7.6% 10.8% 5.0% 2.5% 6.1%
Inner South East London 10.1% 6.5% 10.9% 10.5% 9.7%
Inner South West London 3.9% 9.9% 9.6% 9.2% 3.6%
Inner West London 16.0% 10.0% 14.8% 10.2% 5.2%
North West London 7.7% 9.0% 8.9% 9.6% 13.7%
Outer East London 2.6% 1.7% 4.5% 7.0% 3.8%
Outer North East London 8.6% 1.5% 1.9% 4.3% 8.1%
Outer North London 10.9% 5.8% 7.5% 12.5% 11.5%
Outer South East London 3.7% 10.0% 6.9% 7.2% 8.6%
Outer South London 9.5% 4.6% 9.6% 10.9% 14.7%
Outer South West London 0.0% 7.7% 13.4% 16.8% 11.7%
Outer West London 0.9% 7.6% 9.2% 16.6% 5.7%
18South East
BRMA CAT A CAT B CAT C CAT D CAT E
Ashford 8.9% 10.0% 10.9% 5.3% 9.7%
Aylesbury 13.5% 4.1% 10.0% 5.6% 15.8%
Basingstoke 16.7% 8.9% 8.2% 13.9% 18.3%
Blackwater Valley 22.8% 10.7% 10.6% 12.6% 18.1%
Brighton and Hove 10.5% 5.1% 7.4% 6.5% 12.0%
Canterbury 38.4% 13.5% 11.9% 12.8% 28.0%
Cherwell Valley 15.4% 11.0% 12.0% 9.4% 16.9%
Chichester 7.4% 13.2% 13.8% 9.7% 13.4%
Chilterns 5.7% 5.5% 9.0% 6.2% 20.7%
Crawley & Reigate 3.1% 11.5% 11.8% 6.3% 12.9%
Dover-Shepway 3.2% 10.8% 13.8% 12.0% 10.2%
East Thames Valley 7.6% 5.7% 8.4% 7.8% 10.6%
Eastbourne 4.2% 10.0% 9.1% 7.2% 10.7%
Guildford 1.0% 8.9% 13.5% 10.6% 6.4%
High Weald 3.5% 9.8% 7.5% 10.5% 19.2%
Isle of Wight 16.4% 20.2% 19.0% 12.4% 15.8%
Maidstone 7.7% 26.0% 8.1% 4.0% 11.0%
Medway & Swale 47.9% 8.1% 9.1% 11.6% 11.5%
Milton Keynes 10.6% 7.9% 5.1% 7.1% 6.8%
Newbury 20.3% 1.9% 3.0% 3.7% 8.8%
North West Kent 8.4% 8.2% 8.3% 6.8% 6.8%
Oxford 1.2% 14.6% 10.5% 14.6% 10.0%
Portsmouth 20.9% 9.1% 10.5% 9.6% 16.8%
Reading 23.7% 9.5% 13.4% 9.5% 16.7%
Southampton 9.8% 7.4% 11.6% 10.9% 11.1%
Sussex East 11.0% 8.3% 6.2% 8.3% 10.1%
Thanet 28.2% 3.2% 5.8% 11.6% 6.4%
Walton 13.7% 9.5% 6.4% 14.5% 24.1%
Winchester 0.0% 10.4% 11.1% 11.2% 9.8%
Worthing 10.7% 9.4% 9.9% 10.7% 15.1%
19South West
BRMA CAT A CAT B CAT C CAT D CAT E
Bath 12.1% 9.6% 7.8% 10.5% 7.1%
Bournemouth 9.1% 10.5% 10.4% 9.3% 15.7%
Bristol 7.6% 6.7% 5.1% 6.7% 10.4%
Cheltenham 18.3% 12.9% 13.4% 17.1% 17.9%
Exeter 11.6% 23.5% 23.6% 17.2% 25.8%
Gloucester 12.1% 11.8% 9.3% 12.3% 8.5%
Kernow West 11.4% 17.0% 13.8% 15.5% 16.2%
Mendip 7.5% 11.4% 10.6% 12.7% 9.2%
Mid & East Devon 14.2% 14.8% 11.8% 13.3% 26.5%
Mid & West Dorset 7.0% 12.6% 15.4% 14.3% 11.1%
North Cornwall & Devon Borders 12.8% 18.9% 21.8% 14.6% 16.7%
North Devon 8.7% 23.8% 17.5% 19.7% 15.6%
Plymouth 14.8% 13.5% 12.8% 11.5% 15.3%
Salisbury 5.9% 10.2% 10.6% 12.3% 16.9%
South Devon 18.2% 22.6% 18.6% 13.2% 16.5%
Swindon 1.5% 2.3% 3.2% 5.4% 10.9%
Taunton & West Somerset 2.5% 14.7% 12.4% 11.2% 15.3%
West Wiltshire 8.0% 12.6% 8.6% 4.8% 16.5%
Weston-S-Mare 17.9% 13.3% 11.1% 7.9% 13.8%
Yeovil 28.4% 13.4% 14.6% 14.8% 15.0%
20Octavia House
Westwood Way
Coventry
CV4 8JP
T: 024 7685 1700
E: customer.services@cih.org
www.cih.org
04287 © CIH. All rights reserved.You can also read