Modeling of Heart Rate Variability Using Time-Frequency Representations
←
→
Page content transcription
If your browser does not render page correctly, please read the page content below

Computers, Materials & Continua                                                                  Tech Science Press
DOI:10.32604/cmc.2021.018411
Article

    Modeling of Heart Rate Variability Using Time-Frequency Representations
             Ghaylen Laouini1, Ibrahim Mahariq1 , Thabet Abdeljawad2,3,4, * and Hasan Aksoy5

                 1
                  College of Engineering and Technology, American University of the Middle East, Kuwait
        2
         Department of Mathematics and General Sciences, Prince Sultan University, Riyadh, 11586, Saudi Arabia
                 3
                   Department of Medical Research, China Medical University, Taichung, 40402, Taiwan
           4
             Department of Computer Science and Information Engineering, Asia University, Taichung, Taiwan
5
  Department of Electrical & Electronic Engineering, University of Turkish Aeronautical Association, Ankara, 06790, Turkey
                        *
                          Corresponding Author: Thabet Abdeljawad. Email: tabdeljawad@psu.edu.sa
                                      Received: 06 March 2021; Accepted: 08 April 2021

                     Abstract: The heart rate variability signal is highly correlated with the respi-
                     ration even at high workload exercise. It is also known that this phenomenon
                     still exists during increasing exercise. In the current study, we managed to
                     model this correlation during increasing exercise using the time varying inte-
                     gral pulse frequency modulation (TVIPFM) model that relates the mechanical
                     modulation (MM) to the respiration and the cardiac rhythm. This modulation
                     of the autonomic nervous system (ANS) is able to simultaneously decrease
                     sympathetic and increase parasympathetic activity. The TVIPFM model takes
                     into consideration the effect of the increasing exercise test, where the effect of
                     a time-varying threshold on the heart period is studied. Our motivation is to
                     analyze the heart rate variability (HRV) acquired by time varying integral pulse
                     frequency modulation using time frequency representations. The estimated
                     autonomic nervous system (ANS) modulating signal is filtered throughout
                     the respiration using a time varying filtering, during exercise stress testing.
                     And after summing power of the filtered signal, we compare the power of the
                     filtered modulation of the ANS obtained with different time frequency rep-
                     resentations: smoothed pseudo Wigner–Ville representation, spectrogram and
                     their reassignments. After that, we used a student t-test p < 0.01 to compare
                     the power of heart rate variability in the frequency band of respiration and
                     elsewhere.

                     Keywords: Heart rate variability; respiration; TVIPFM; mechanical
                     modulation; autonomic nervous system

 1 Introduction
     The Heart Rate Variability is the time variation of heartbeats. It reflects the regulations of
 the Autonomic nervous System [1,2]. The fluctuations of heart rate are modeled by mathematical
 chaos [3]. The variability leads to the flexibility to rapidly contend with a changing environment.
 Modeling biological systems reveals spatial and temporal complexity, so any disorder changes this
 complexity [4]. Higher magnitude of the HRV is not always a sign of healthy biological conditions.

                         This work is licensed under a Creative Commons Attribution 4.0 International License,
                         which permits unrestricted use, distribution, and reproduction in any medium, provided
                         the original work is properly cited.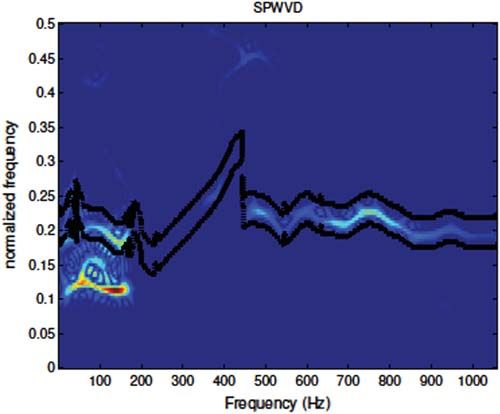
1290                                                                        CMC, 2021, vol.69, no.1

For instance, any conduction problem in the heart, makes HRV amplitudes higher. To study the
HRV, we need to start with studying electrocardiogram (ECG) waves. A good interpretation of
these waves shows whether high HRV values are the consequence of cardiac problems like atrial
fibrillation [5] or other side effects that could impact heart rhythm [6]. A normal magnitude of
HRV could be interpreted as a sign of adaptability or resilience. Higher magnitudes of HRV are
due to the effect of executive functions by the prefrontal cortex [7,8].
     The Integral pulse frequency modulation (IPFM) model explains the influence of the heart
rate by the autonomic nervous system [9] in several physiological conditions: at rest or during
exercise [10,11]. However, the IPFM model considers the heart period as a constant [12,13] which
means that it considers a constant mean heart period [14]. That’s why we use the time varying
threshold IPFM (TVIPFM) model to analyze the heart rate variability during exercise. Applying
this model leads to the approximation of a modulating signal taking into account the time varying
threshold. Many studies highlighted the close relationship between respiration and HRV [15–17].
That’s why in this paper, we analyze non-stationary (HRV) signals using time varying filtering
based on the frequency band of respiration.
     Our study is in stress testing exercise, permitting us to look the respiratory information to
estimate parasympathetic activity. Heart rate variability was analyzed in time frequency domain.
The Wigner–Ville [18] and the Smoothed Pseudo Wigner–Ville Distributions (SPWVD) have
already been used to analyze biological signals [19], including HRV and respiration oscillations.
The Smoothed Pseudo Wigner–Ville Distribution is a good technique to study large band non-
stationary signals. This technique allows us to determine time-intervals, where the heart rate
variability is excited and where it is not. The knowledge of these intervals in time could also be
used to find a direct correlation, graphically and analytically, between the heart rate variability
and the respiration. But unfortunately, the SPWVD has a cross term which causes interference,
that’s why we need a reduction of cross terms, which is obtained by use of analytical signal with
no frequencies instead of real signal. This procedure is based on the Hilbert Transform, which is
a linear transform that extends a real signal to a complex one, to satisfy the equations of Cauchy
Riemann.
    This method could be applied during exercise with a high stress test, but it could be applied
during other conditions.

2 Methods and Materials
     In our study, one of the time frequency representations used in non-stationary conditions, is
the spectrogram. The spectrogram is as below [20,21]
              ∞                              2

Sx (t, υ) =            ∗
                  x (s) h (s − t) e −i2π υs
                                            ds                                               (1)
            −∞

h is a smoothing window. The spectrogram is the squared magnitude of the short Fourier
Transform.
   Another time-frequency representation studied is the Pseudo Wigner–Ville Distribution
(PWVD) since it uses a short term window, whose effect is to operate on the Wigner–Ville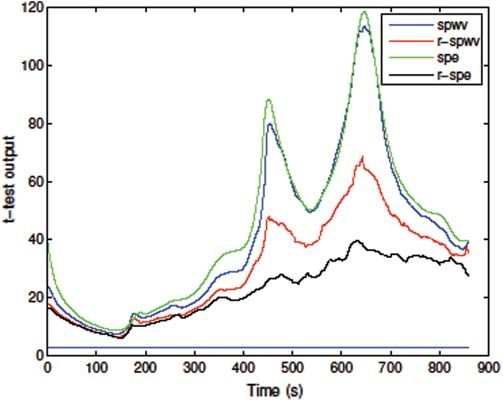
CMC, 2021, vol.69, no.1                                                                    1291

distribution a smoothing frequency, which amounts to limit the interference terms only compo-
nents that are simultaneously present in the window. The PWVD is defined by [22]:
            ∞            s ∗   s  −i2π υs
X (t, υ) =     p (s) x t +   x t−      e       ds                                          (2)
            −∞             2       2
with p is a smoothing frequency window, if this window is factorable, we have:
           s  s
p (s) = h∗    h −                                                                            (3)
            2     2
     And the result obtained is the pseudo Wigner–Ville, inspired from the Wigner–Ville. This
analysis is a slippery short term analysis, which therefore resembles the spectrogram. To find a
relation between spectrogram and SPWVD, we introduce the weighted delayed signal:
xt (s) = h∗ (s) x(s + t)                                                                     (4)
permitting as to define the PWVD:
            ∞
                    s         s           s ∗  s  −i2π υs
X (t, υ) =     h∗       h − x t+            x t−    e        ds                              (5)
            −∞      2         2           2      2
            ∞             s
                    s
         =     xt       xt ∗ − e−i2π υs ds
            −∞      2           2
            ∞
         =     xt (s) xt ∗ (−s) e−i4π υs ds
             −∞

     Spectrogram can be written as:
              ∞                     2

Sx (t, s) =     xt (s) e −i2π υs
                                   ds                                                      (6)
             −∞

     Using the spectrogram as a smoothed version of Wigner–Ville distribution presents two
major weaknesses: the first one is that passing to spectrogram implies the loss of theoretical
advantageous properties of Wigner–Ville distribution, and the second one is that the smoothing
introduced obeys the constraint of Heisenberg–Gabor between time and frequency. Since the
smoothing time frequency associated to spectrogram has only one degree of freedom.
     Considering the two dimensions obtained by the time and the frequency domain, improvement
is possible if we move to a smoothing with two “degrees of freedom” respectively to the time
and frequency. Both distributions, spectrogram and pseudo Wigner–Ville, have the same principle,
a signal segment taken with a short-term window. After, both undergo a Fourier Transform,
followed by a quadratic operation. In this paper we use the SPWVD and the balance between
time and frequency filtering can be done independently. One of the drawbacks of the SPWVD
representation is the presence of interferences.
    After we will use the indicator function named GABresp in the time frequency domain showed
as below

 GABresp = 1 if f ∈ Band of respiration
                                                                                            (7)
 GABresp = 0 if f ∈ / Band of respiration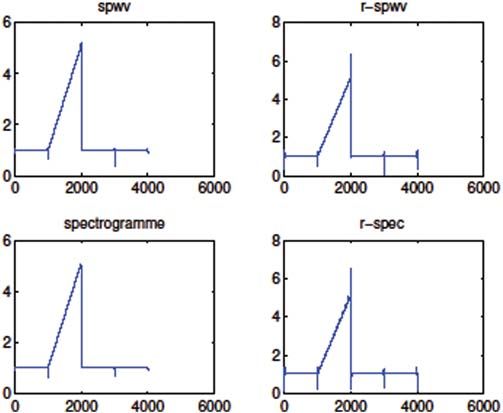
1292                                                                                CMC, 2021, vol.69, no.1

3 The Time Varying Threshold Integral Pulse Frequency Modulation Model
    The TVIPFM model considers m(t) as the ANS control. The first beat happens at time t0 = 0,
so tk is solution of [2,23]:
     tk
         1 + m(t)
k=                dt                                                                       (8)
     0     T(t)
                                                  1+m(t)
the instantaneous heart rate is defined as         T(t)
                                                m(t)                                             1
    Supposing that the oscillating term         T(t)   is with higher frequency than the term   T(t) ,   so
              1
dHRM (t) =                                                                                                     (9)
             T(t)
and the heart rate variability is represented by
                                    m(t)
dHRV (t) = dHR (t) − dHRM (t) =                                                                               (10)
                                    T(t)

     After dividing the HRV dHRV (t) by dHRM (t) we obtain m(t). The variations of the time-
varying threshold TAC (t) are smaller than the mean value TDC . Rewriting the instantaneous heart
rate

             1 + m(t)          1 + m(t)         1 + m (t)      TAC (t)
dHR (t) =               =                   ≈             1+                               (11)
          TDC + TAC (t) T            TAC (t)      TDC           TDC
                            DC 1 + T       DC

    Assuming m(t)  1 we have:
                          TAC (t)
            1 + m (t) −
                           TDC
dHR (t) =                                                                                                     (12)
                     TDC

    We assume
                  TAC (t)
             1−
                   TDC       1
dHRM (t) =                ≈                                                                                   (13)
                  TDC       TDC

    This mean heart rate obtained by the TVIPFM model, is more adequate to stress tests and
exercise, taking into consideration a mean heart period varying function of time, changing between
two successive heartbeats. So
          dHRV (t)
m (t) =                                                                                                       (14)
          dHRM (t)

    First, we calculate k (t) from the pairs (tk , k), then we low-pass filter dHR (t) to obtain the
dHRV (t) term. Therefore, we get m (t). Finding this modulating signal using our TVIPFM model
combined with different time frequency representation is aiming to calculate the effect of the
autonomic nervous system on the sinoatrial node. This control is synchronized with the respiratory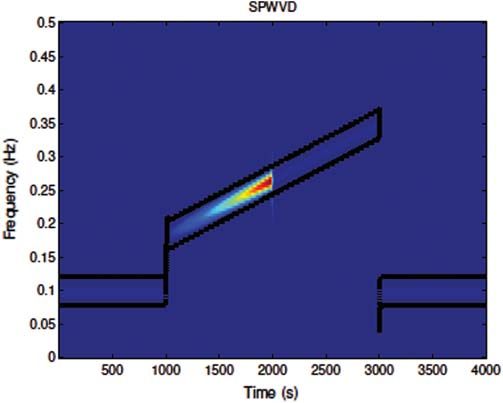
CMC, 2021, vol.69, no.1                                                                       1293

sinus arrhythmia. This modulation m (t) plays a key role to understand different pathologies and
dysfunctions of the autonomic nervous system to monitor the cardiac rhythm.

4 Statistical Analysis
     The correlation between the respiration and the ANS modulation is investigated by comparing
the instantaneous power throughout the respiration using the gabarit function, and the instanta-
neous power at the rest of the frequencies, other than the frequency band of respiration, using
a student t-test. Statistical results have been shown at the time frequency domain, during exercise
stress testing.
    We calculate the instantaneous power for each time, around the respiration at the first time,
and elsewhere at the second time. The student t-test significance was fixed for p < 0.01.

5 Results
5.1 Simulation Study
     In Fig. 1, we generate a signal containing three parts to represent the modulating signal. The
first part is a sinusoidal signal with constant frequency around 100 Hz and a constant magnitude
equal to one. In the second part, we generate a chirp with instantaneous frequency varying linearly
from 100 to 350 Hz, and with a magnitude, increasing linearly from one to five, and the third
part is like the first one.

Figure 1: The smoothed pseudo Wigner–Ville representation of the simulated signal, with the
gabarit in black

     We define the gabarit function as a function which is equal to one around the frequency band
of respiration and zero elsewhere, mathematically, it can be considered as the Indicator function
which is equal to one around the respiratory frequency and zero elsewhere. The gabarit plays a
key role in filtering, the representation of the obtained signal will be multiplied by the gabarit
function in the time frequency domain for spectrogram, SPWVD and their reassignments. After
the filtered signal obtained at the frequency band of respiration, will be studied to compare which
representation is better, and contains more power. In this simulated signal, we consider that the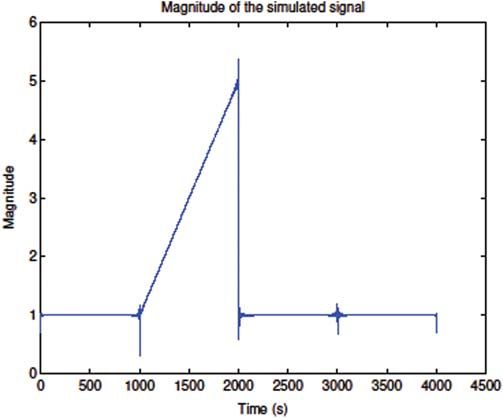
1294                                                                        CMC, 2021, vol.69, no.1

respiratory signal is concentrated around the frequencies of the signal in each part, the aim of
this simulation is to show how the gabarit is well adapted to our simulated modulation [24].
    In Fig. 2, after representing in the time frequency domain with spectrogram, SPWVD and
both their reassignments [25] for a simulated signal, the result obtained will be multiplied by the
GABresp and after that we integrate over the frequencies weighting by the number of the points
used in the gabarit function. The obtained result, is quadratic in the time domain, to compare
it with the original signal, we take the root square of this quantity, and we compare with the
envelope of the magnitude of the starting signal as shown in Fig. 3.

Figure 2: The envelope of the magnitude of the filtered signal obtained after time frequency
representation

                  Figure 3: Envelope of the magnitude of the simulated signal
CMC, 2021, vol.69, no.1 1295
5.2 Real Signals During Exercise Stress Testing
In our study, we need the instants tk , from these beat occurrences, first we obtain the
instantaneous heart rate, then we get the time varying mean heart rate from the instantaneous
heart rate, using a high-pass filtering, then we obtain the heart rate variability by subtracting the
time varying mean heart rate from the instantaneous heart rate. Finally, the obtained HRV will
be corrected by the time varying mean heart rate, and we obtain the modulating signal using the
TVIPFM model.
The technique proposed in this paper is the time varying signal filtering using the gabarit
function at the time frequency domain around the respiration.
The SPWVD signal X (t, υ) of the original signal x(t) is after integrated respect to the
frequency υ, for spectrogram and the SPWVD and their reassignments, we expect to have the
instantaneous power |x (t) |2 , and
s s s ∗ s −i2π υs
X (t, υ) dυ = h∗ h − x t+ x t− e dsdυ = |x (t) |2 (15)
2 2 2 2
Fig. 4. shows the time frequency representation of the HRV of a real signal using the
SPWVD representation with the gabarit function (in black) around the recorded frequency band
of respiration. The high correlation between the HRV obtained from the TVIPFM model and the
respiration is obviously displayed.
Figure 4: The smoothed pseudo Wigner–Ville representation of a real signal with gabarit function
So, we obtain the magnitude of the signal x (t) after the time varying filtering, that’s why we
apply the root square on this quantity to retrieve the magnitude of the real signal.
In Fig. 5, we represent the envelope of the magnitude of the modulating signal with dif-
ferent time frequency representations like SPWVD, spectrogram and their reassignments. Results
obtained prove the importance of our time varying filtering technique to retrieve the modulation
from the heart rate variability due to the respiratory sinus arrhythmia. The use of a time varying1296 CMC, 2021, vol.69, no.1
model with a time varying filtering around the respiration, gives us the best envelope using the
spectrogram method.
Figure 5: Magnitude of the filtered real signal
In Fig. 6, we show that the correlation between the HRV and the respiration using different
kinds of time frequency representations as spectrogram, SPWVD and their reassignments.
Figure 6: Student t-test with significance p < 0.01
There is a high correlation between the respiration and the heart rate variability, with signif-
icance p < 0.01. In this figure, for each time frequency representation, the instantaneous power
at the frequency band of respiration and elsewhere are computed. We obtain two sets of data.
We use a t-test with a window of 200 samples. The curves spwv, r-spwv, spe and r-spe plottedCMC, 2021, vol.69, no.1 1297
in Fig. 6 represent the result of the t-test, the horizontal straight line represents the threshold
of the significance level. The presence of the instantaneous power in the respiratory frequency
band is always shown p < 0.01 with each time frequency representation. Therefore, we can use
our technique of filtering to retrieve the envelopes of the magnitude of the modulating signal
corresponding to the ANS modulation. The spectrogram representation, shows the most significant
correlation between the modulating signal and the respiration.
The correlation modeled between the respiration and the HRV plays a key role to understand
the control of the ANS on the heart. A recent work [26] studied the link between respiration
and HRV during yoga breathing practice. After six months of yoga, HRV showed improvement
towards the parasympathetic domain. This study was performed in the time and frequency
domains. Modeling the HRV coupled with the respiration has several applications. One current
study [27] was applications was about tracking the cardiorespiratory load of firefighters reflecting
the respiratory metabolism state to ensure their safety. This study needs to take into account a
respiration during the intense physical exercise. The reader may refer to [28], where the HRV is
positively linked with compassion. The study HRV associated with soothing emotions.
6 Conclusion
In this paper, we used the TVIPFM to obtain the modulating signal of the heart rate
variability filtered with respect to the respiration frequency. This filtering is assumed in time
frequency domain, using different representations like spectrogram, the smoothed pseudo Wigner–
Ville distribution and their reassignments. Differences between magnitudes of instantaneous power
in all of the representations are due to the reassignment principle moving power dispersed, to
reassign it to the nearest point. After that, we used a statistical test to explain our choice to
filtrate around respiration, so we involve the student t-test to compare the instantaneous power in
the respiratory frequency band and elsewhere using the gabarit function. The significance of the
t-test is set at p < 0.01 showing that all time frequency representations used prove the existence
of the power in the respiratory frequency band.
HRV has been also studied with Kalman smoothed method to estimate time varying charac-
teristics of HRV. The proposed method, supposes that HRV is obtained by auto regressive model.
Using a Kalman smoothed algorithm, parameters are estimated. In this method, the time varying
spectrum is a continuous function of frequency, so we can evaluate it at any desired frequency up
fs
to the Nyquist frequency 2. The advantage of the Kalman smoother algorithm method is that
the spectrum is separable.
However, one of the limits of this method is that the characteristics of the Kalman smoother
spectrum depends strongly on the order of the auto regressive model. For example, if the used
model is with a higher order, it can lead to some interference in the spectrum. Studying HRV
during exercise imposes the use of a non-stationary mean time varying period. So, we studied the
HRV using our TVIPFM model, also we used the method of time varying filtering. Finally, with
this study, we satisfy the increasing exercise conditions.
Funding Statement: This work was supported by College of Engineering and Technology, the
American University of the Middle East, Kuwait. Homepage: https://www.aum.edu.kw.
Conflicts of Interest: The authors declare that they have no conflicts of interest to report regarding
the present study.1298 CMC, 2021, vol.69, no.1
References
[1] L. Bernardi, B. Bianchini, G. Spadacini, S. Leuzzi, F. Valle et al., “Demonstrable cardiac reinnervation
after human heart transplantation by carotid baroreflex modulation of RR interval,” Circulation,
vol. 92, no. 10, pp. 2895–2903, 1995.
[2] R. Bailón, G. Laouini, C. Grao, M. Orini, P. Laguna et al., “The integral pulse frequency modulation
model with time-varying threshold: Application to heart rate variability analysis during exercise stress
testing,” IEEE Transactions on Biomedical Engineering, vol. 58, no. 3, pp. 642–652, 2010.
[3] A. L. Goldberger, “Is the normal heartbeat chaotic or homeostatic?,” Physiology, vol. 6, no. 2, pp. 87–
91, 1991.
[4] F. Beckers, B. Verheyden and A. E. Aubert, “Aging and nonlinear heart rate control in a healthy pop-
ulation,” American Journal of Physiology-Heart and Circulatory Physiology, vol. 290, no. 6, pp. H2560–
H2570, 2006.
[5] D. E. Vaillancourt and K. M. Newell, “Changing complexity in human behavior and physiology
through aging and disease,” Neurobiology of Aging, vol. 23, no. 1, pp. 1–11, 2002.
[6] E. G. Caiani, A. Martin-Yebra, F. Landreani, J. Bolea, P. Laguna et al., “Weightlessness and cardiac
rhythm disorders: Current knowledge from space flight and bed-rest studies,” Frontiers in Astronomy and
Space Sciences, vol. 3, pp. 27, 2016.
[7] P. K. Stein, P. P. Domitrovich, N. Hui, P. Rautaharju and J. Gottdiener, “Sometimes higher heart rate
variability is not better heart rate variability: Results of graphical and nonlinear analyses,” Journal of
Cardiovascular Electrophysiology, vol. 16, no. 9, pp. 954–959, 2005.
[8] R. D. Lane, E. M. Reiman, G. L. Ahern and J. F. Thayer, “21. Activity in medial prefrontal cortex
correlates with vagal component of heart rate variability during emotion,” Brain and Cognition, vol. 47,
no. 1–2, pp. 97–100, 2001.
[9] E. J. Bayly, “Spectral analysis of pulse frequency modulation in the nervous systems,” IEEE Transac-
tions on Biomedical Engineering, vol. 4, no. 4, pp. 257–265, 1968.
[10] R. Bailón, L. Mainardi, M. Orini, L. Sörnmo and P. Laguna, “Analysis of heart rate variability during
exercise stress testing using respiratory information,” Biomedical Signal Processing and Control, vol. 5,
no. 4, pp. 299–310, 2010.
[11] S. Michael, K. S. Graham and G. M. Davis, “Cardiac autonomic responses during exercise and post-
exercise recovery using heart rate variability and systolic time intervals-a review,” Frontiers in Physiology,
vol. 8, pp. 301, 2017.
[12] J. Mateo and P. Laguna, “Improved heart rate variability signal analysis from the beat occurrence
times according to the IPFM model,” IEEE Transactions on Biomedical Engineering, vol. 47, no. 8,
pp. 985–996, 2000.
[13] J. Mateo and P. Laguna, “Analysis of heart rate variability in the presence of ectopic beats using the
heart timing signal,” IEEE Transactions on Biomedical Engineering, vol. 50, no. 3, pp. 334–343, 2003.
[14] G. Laouini, A. Cabasson, G. Blain, P. Bonizzi, O. Meste et al., “Evidence of the influence of respiration
on the heart rate variability after human heart transplantation: Role of observation model,” in 2009
36th Annual Computers in Cardiology Conf., Park City, UT, USA, pp. 409–412, 2009.
[15] O. Meste, G. Blain and S. Bermon, “Some considerations on the IPFM model for the heart rate
variability analysis,” in Computers in Cardiology, Thessaloniki, Greece, pp. 709–712, 2003.
[16] O. Meste, B. Khaddoumi, G. Blain and S. Bermon, “Time-varying analysis methods and models
for the respiratory and cardiac system coupling in graded exercise,” IEEE Transactions on Biomedical
Engineering, vol. 52, no. 11, pp. 1921–1930, 2005.
[17] G. Blain, O. Meste, T. Bouchard and S. Bermon, “Assessment of ventilatory thresholds during graded
and maximal exercise test using time varying analysis of respiratory sinus arrhythmia,” British Journal
of Sports Medicine, vol. 39, no. 7, pp. 448–452, 2005.
[18] M. Qaraqe, M. Ismail and E. Serpedin, “Combined matching pursuit and Wigner–Ville distribution
analysis for the discrimination of ictal heart rate variability,” in 2016 24th European Signal Processing
Conf., Budapest, Hungary, pp. 2045–2049, 2016.CMC, 2021, vol.69, no.1 1299
[19] S. Pola, A. Macerata, M. Emdin and C. Marchesi, “Estimation of the power spectral density in non-
stationary cardiovascular time series: Assessing the role of the time-frequency representations (TFR),”
IEEE Transactions on Biomedical Engineering, vol. 43, no. 1, pp. 46, 1996.
[20] M. Hansson and P. Jönsson, “Estimation of HRV spectrogram using multiple window methods
focusing on the high frequency power,” Medical Engineering & Physics, vol. 28, no. 8, pp. 749–761,
2006.
[21] A. K. Barros and N. Ohnishi, “Heart instantaneous frequency (HIF): An alternative approach to
extract heart rate variability,” IEEE Transactions on Biomedical Engineering, vol. 48, no. 8, pp. 850–855,
2001.
[22] W. Martin and P. Flandrin, “Wigner–Ville spectral analysis of nonstationary processes,” IEEE Trans-
actions on Acoustics, Speech, and Signal Processing, vol. 33, no. 6, pp. 1461–1470, 1985.
[23] O. Rompelman, J. B. I. M. Snijders and C. J. Van Spronsen, “The measurement of heart rate variability
spectra with the help of a personal computer,” IEEE Transactions on Biomedical Engineering, vol. 29,
no. 7, pp. 503–510, 1982.
[24] F. Auger and P. Flandrin, “Improving the readability of time-frequency and time-scale representations
by the reassignment method,” IEEE Transactions on Signal Processing, vol. 43, no. 5, pp. 1068–1089,
1995.
[25] R. Bailon, P. Laguna, L. Mainardi and L. Sornmo, “Analysis of heart rate variability using time-
varying frequency bands based on respiratory frequency,” in 2007 29th Annual Int. Conf. of the IEEE
Engineering in Medicine and Biology Society, Lyon, France, pp. 6674–6677, 2007.
[26] M. Kuppusam, D. Kamaldeen, R. Pitani, J. Amaldas, P. Ramasamy et al., “Effects of yoga breathing
practice on heart rate variability in healthy adolescents: a randomized controlled trial,” Integrative
Medicine Research, vol. 9, no. 1, pp. 28–32, 2020.
[27] Y. Ito, Y. Oka and Y. Kuriyam, “Applicability of the reflection index of respiration based on heart rate
variability analysis to firefighting activity,” Fire Science and Technology, vol. 39, no. 1, pp. 1–5, 2020.
[28] M. Di Bello, L. Carnevali, N. Petrocchi, J. F. Thayer, P. Gilbert et al., “The compassionate vagus:
A meta-analysis on the connection between compassion and heart rate variability,” Neuroscience &
Biobehavioral Reviews, vol. 116, no. 1, pp. 21–30, 2020.You can also read