COVID-19 in U.S. State and Federal Prisons - PREPARED FOR THE COMMISSION BY KEVIN T. SCHNEPEL
←
→
Page content transcription
If your browser does not render page correctly, please read the page content below
COVID-19 in U.S.
State and Federal
Prisons
PREPARED FOR THE COMMISSION BY

KEVIN T. SCHNEPEL
Assistant Professor of Economics
Simon Fraser University

Council on Criminal Justice
September 2020
ABOUT THE COUNCIL
The Council on Criminal Justice is a nonpartisan criminal justice think tank and national
invitational membership organization. Its mission is to advance understanding of the criminal
justice policy choices facing the nation and build consensus for solutions based on facts,
evidence and fundamental principles of justice.

The Council does not take policy positions. As part of its array of activities, the Council
conducts research and convenes independent task forces composed of Council members who
produce reports with findings and policy recommendations on matters of concern. The
findings and conclusions in this research report are those of the authors alone. They were not
subject to the approval of the Council’s Board of Directors or its Board of Trustees.

For more information about the Council, visit counciloncj.org

ABOUT THE AUTHORS
Kevin T. Schnepel is an assistant professor of economics at Simon Fraser University. Kevin is
a research affiliate of the IZA Research Institute of Labor Economics and an honorary
associate of the School of Economics at the University of Sydney. His research primarily
focuses on crime, health, labor, and environmental economics.

ACKNOWLEDGEMENTS
This paper was produced with support from Arnold Ventures, the John D. and Catherine T.
MacArthur Foundation, Microsoft, the Charles and Lynn Schusterman Family Foundation,
the Justice and Mobility Fund, and other contributors.

Suggested Citation
Schnepel, Kevin T. COVID-19 in U.S. State and Federal Prisons. Washington, D.C.: Council on
Criminal Justice, September 2020.
Key Findings
 + On average, the COVID-19 mortality rate within prisons is 61.8 deaths per 100,000
   people in prison, twice as large as the general public mortality rate after adjusting
   for the sex, age and race/ethnicity of those incarcerated. This disparity is 60% higher
   than a comparison using an unadjusted population mortality rate.

 + The rate of COVID-19 cases reported by state and federal prisons in the U.S. is
   nearly 7,000 cases per 100,000 people in prison, more than four times the rate of
   confirmed cases per 100,000 U.S residents. An adjustment for the sex, age and
   race/ethnicity of people in prison was not possible due to the lack of confirmed COVID-
   19 case data by demographic characteristics.

 + Average case and mortality rates within prisons conceal a great deal of
   heterogeneity across states. Several states appear to be doing quite well, with 14
   states reporting zero COVID-19 deaths within prisons and another six states with
   COVID-19 mortality rates below what would be expected given the state mortality
   rates for specific sex, age, and race/ethnicity groups. Several other states, by contrast,
   exhibit mortality rates within prisons that are considerably higher than the adjusted
   state mortality rates. Future investigation into these differences may yield important
   insights for policymakers.

 + The types of prisons with the highest number of COVID-19 cases are those
   operated by state governments, prisons in the southern region of the U.S., and
   prisons that are large in terms of population (over 1,000 inmates). The highest
   COVID-19 mortality rates are observed within large prisons and those within the
   Midwest region of the U.S.

 + Documenting the contribution of prisons to the spread of COVID-19 infections in
   surrounding communities was not possible due to data limitations, including a lack of
   geographic specificity in reported COVID-19 data as well as uncertainty about how
   prison cases and deaths are recorded in county totals.
Overview
Novel coronavirus disease 2019 (COVID-19) outbreaks have occurred at hundreds
of jails and prisons across the United States, with new cases increasing rapidly in
July and August 2020. Incarceration facilities represented 19 of the top 20 clusters
of confirmed cases in the U.S. as of August 19 (Smith et al. 2020). These trends are
especially concerning considering that the U.S. has the largest incarcerated
population in the world, with approximately 2 million people behind bars. More
than 1.3 million individuals are in state or federal prisons and the remainder are in
county jails (Doleac, Harvey and Kaplan 2020).

Using data from a variety of sources, this report contributes to our understanding of COVID-
19 outbreaks within state and federal prisons by addressing two main questions:

   + How do overall COVID-19 case and mortality rates within state and federal prisons
     compare with rates for the general population, both before and after adjusting for the
     age, race/ethnicity, and sex of people in prison?

   + How do COVID-19 infections vary by the type and location of a prison?

The following figures and tables present descriptive evidence that helps answer these
questions. While the spread of COVID-19 within state and federal prisons is likely influenced
by policy responses at the institutional, local, state, and national level, documenting or
evaluating such policies is beyond the scope of this report.
COVID-19 Case and Mortality Rates in State and Federal Correctional Systems Highly infectious diseases pose a significant challenge for carceral institutions. Such facilities continue to represent the largest clusters of positive COVID-19 cases (Smith et al 2020). 1 This disproportionate impact of epidemics on people in prison is not a new phenomenon. Reports from San Quentin State Prison in California during the influenza pandemic of 1918, also known as the “Spanish flu,” estimated that half of the 1,900 people incarcerated there were infected during the outbreak’s first wave (Hawks, Woolhandler and McCormick 2020). One of the most significant challenges posed by the current crisis is the inability of incarcerated people to maintain a safe social distance from each other in shared spaces that are smaller, on average, than cruise ship cabins or shared bedrooms in nursing homes (Kajstura and Landon 2020). Twelve state prison systems and the Federal Bureau of Prisons (BOP) held more inmates than their official capacity at the end of 2018, further hindering efforts to slow the spread of disease through social distancing (Carson 2020).2 Incarcerated individuals are also more likely to suffer from chronic health conditions, such as heart disease or diabetes, which can exacerbate the impact of COVID-19 on this population (Maruschak, Berzofsky and Unangst 2015, Wildeman and Wan 2017, Hawks Hoolhandler and McCormick 2020). Other challenges include limited medical resources as well as a daily churn of staff members, visitors, and new arrivals via admissions (Wallace et al. 2020). Finally, as a result of longer sentences over the past several decades, the average age of people in prison is increasing. More than 20% of those now serving sentences in state and federal prisons are over 50 years old (Carson 2020). More than 115,000 COVID-19 cases and nearly 900 deaths had been reported among incarcerated individuals and correctional staff at state and federal prisons as of August 19, 2020 (The Marshall Project 2020). For every 100,000 people in prison, nearly 6,900 have tested positive and more than 60 have died—a rate four times the national figure for cases and 30% higher for deaths.3 While informative, this simple comparison ignores the fact that the incarcerated population differs greatly across demographic characteristics for which large disparities exist in COVID-19 case and mortality rates. For example, Black Americans are currently twice as likely to die from COVID-19 than white Americans (Hardy and Logan, 2020), and they are incarcerated five times more often than white Americans (Sabol, Johnson 1 Recent research by the CDC has defined “focal outbreaks” as those that occur in long-term care facilities, food processing facilities, correctional facilities, or other workplaces. These focal outbreaks are among the most important factors contributing to county-level COVID-19 prevalence (Oster et al. 2020). 2 These 12 systems were the Federal Bureau of Prisons and state prison systems in AZ, CO, DE, HI, ID, IA, NB, NM, OK, VA, WA, WI (Carson 2020). 3 These rates were calculated using cases reported by the Marshall Project as of August 19, 2020 (The Marshall Project 2020), total state and federal prison populations at the end of 2018 (Carson 2020), and the overall U.S. case and death rates on August 15, 2020 reported by the CDC (USA Facts 2020).
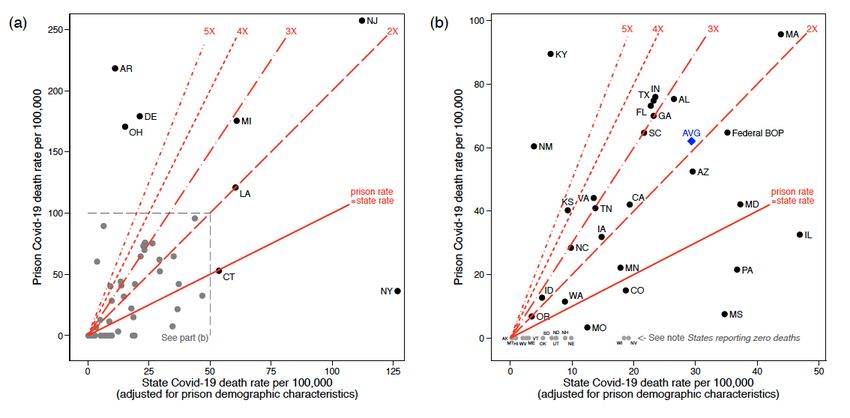
and Caccavale, 2020). Further, people in prison are much more likely to be male and younger
than a non-incarcerated individual.

To compare COVID-19 mortality rates in prisons with rates for a non-incarcerated
population, this report calculates expected mortality rates given each incarcerated person’s
state of residence, sex, age, and race/ethnicity. This exercise builds upon Saloner et al. (2020),
researchers who found a COVID-19 mortality rate at the beginning of June 2020 that was
three times higher in prisons than would have been expected in the same age and sex
distributions of the U.S. population. That disparity is 50% greater than using the unadjusted
national mortality rate. 4

Figure 1 uses data that tracks COVID-19 deaths in prisons (The Marshall Project Project
2020), state-level mortality rates by sex, age, and race/ethnicity (Centers for Disease Control
and Prevention 2020a, b), and the distribution of people in prison for each state by these
characteristics (U.S. Bureau of Justice Statistics 2020). This data enables a state-by-state
comparison of the COVID-19 mortality rate among individuals in prison (measured on the
vertical axis) with the state COVID-19 mortality rate, adjusting for the demographic
characteristics of those in prison (measured on the horizontal axis). The accuracy of these
calculations depends on state and federal correctional agencies reporting correct
information about their incarcerated populations, which cannot be independently verified.
Mortality rates for BOP facilities are also calculated and compared with the U.S. national
mortality rate adjusted by the sex, age, and race/ethnicity characteristics of people in BOP
prisons. Five diagonal lines are included to assist comparison.

4
  These comparisons are not yet possible for confirmed cases of COVID-19 since data by sex, age, and
race/ethnicity is currently only available for deaths.
INTERPRETING THE DATA: FIGURE 1
The solid red line labeled “prison rate=state rate” represents equality between the prison mortality rate and
the state rate adjusted for the prison demographic characteristics. All points to the left and above this line
indicate that a state has a higher COVID-19 mortality rate within the prison system than would be
expected given the mortality rates of all individuals in the state with similar sex, age, and race/ethnicity
characteristics. The other four red (dashed) lines represent where the prison rate is two, three, four, and five
times as high as the adjusted state rate.
Figure 1: COVID-19 mortality rates in state and federal prisons as of
August 15, 2020, compared with state mortality rates adjusted to match
the sex, age, and race/ethnicity of people in prison.
Figure Notes: Each scatter point in this figure represents a state, with the exception of one scatter point for federal prisons. Part (b) expands the area at
the bottom left of part (a) so that all states can be easily viewed. The location of each scatter point is determined by the COVID-19 mortality rate within
a state’s correctional facilities (vertical axis) and the COVID-19 mortality rate within the state adjusted for the sex, age, and race/ethnicity of the prison
population (horizontal axis). Information capturing the deaths of incarcerated people in two states (RI and WY) is not available through The Marshall
Project (2020) and is thus likely not being reported. These two states are not included in the figure, nor are they included in the calculation of the
national averages. COVID-19 deaths among people in prison by state were obtained from The Marshall Project (2020) and reflect data as of August 15,
2020. State mortality rates specific to sex, age, and race were collected from Centers for Disease Control and Prevention (2020a) and Centers for
Disease Control and Prevention (2020b) (also through August 15). The sex, age, and race/ethnicity distribution for people in state prisons was obtained
from U.S. Bureau of Justice Statistics (2020) and Carson (2020). States reporting zero deaths: The following 14 states have zero reported COVID-19-
related deaths among people in prison and are listed in order from smallest to largest based on their state-adjusted mortality rate: AK, MT, HI, WV, ME,
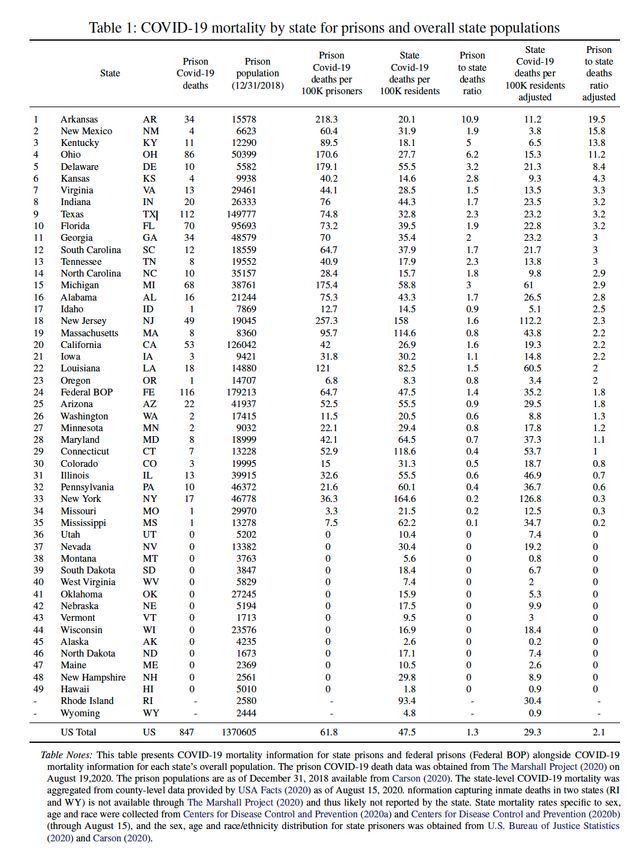
VT, OK, SD, UT, ND, NH, NE, WI, NV.Overall, 21 states reporting deaths exhibit prison mortality rates lower than the adjusted state rates. Fourteen of these states report zero deaths in state prisons. 5 Notably, the mortality rate within New York state prisons is much lower than expected given the mortality for individuals with similar demographic characteristics in New York (part (a) of Figure 1). Approximately half the states exhibit mortality rates double what would be expected based on the demographic characteristics of prisoners. The weighted average across all systems is around twice the expected mortality as indicated by the blue diamond in Figure 1.6 Mortality in many states is considerably higher than expected. For example, COVID-19 deaths within Ohio prisons is 170 per 100,000 incarcerated people, 11 times higher than the expected mortality rate (around 15 per 100,000) given the incarcerated individual’s sex, age, and race/ethnicity characteristics. Table 1 lists each of the numbers depicted in Figure 1 along with information on the total number of COVID-19 deaths reported as of August 19, 2020, and the unadjusted COVID-19 mortality rates for each state. State prison systems are listed in descending order based on how much higher the prison COVID-19 mortality rate is compared with the state mortality rate adjusted for the sex, age, and race/ethnicity of the prison population. This table further illustrates the importance of adjusting for demographic characteristics when comparing mortality rates. For the U.S. as a whole, the prison mortality rate is 30% higher than the national mortality rate. However, adjusting for sex, age and race/ethnicity of the U.S. prison population, the prison COVID-19 mortality rate is 110% higher than the national mortality rate. Again, there is substantial heterogeneity with regard to the importance of this adjustment by state. In Arkansas, the state with the worst performance in its prison system relative to the overall state mortality rate, the COVID-19 mortality rate is 10.9 times higher than the unadjusted state mortality rate and 19.5 times higher than the state mortality rate adjusted for the demographic characteristics of people in prison in Arkansas. This demographic adjustment is less consequential for the comparison in a few states, such as Michigan, where each comparison suggests that the COVID-19 mortality rate in prisons is three times higher than state mortality rates. 5 The following 14 states have zero reported COVID-19 related deaths among prisoners: AK, HI, ME, MT, NE, NH, NV, ND, OK, SD, UT, VT, WV, WI. 6 This average figure suggests a disparity less than the rate reported in Saloner et al. (2020) which was three times higher adjusting for age and gender characteristics. This difference could be due to the importance of adjusting for race/ethnicity but is also influenced by the timing of the measurement. The comparison by Saloner et al. (2020) is made as of June 6, 2020 while the comparison in Figure 1 is based on data through August 15, 2020.
Table 1: COVID-19 mortality by state prisons and overall state populations
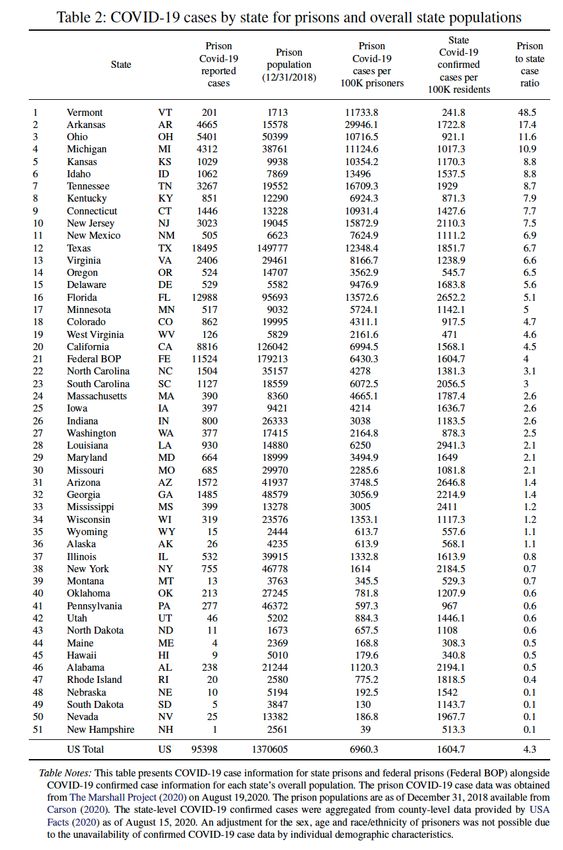
KEY FINDING

 On average, the COVID-19 mortality rate within prisons is 61.8 deaths per 100,000 people in
 prisons, twice as large as the mortality rate after adjusting for the sex, age, and race/ethnicity of
 those incarcerated. The disparity is 60% higher than a comparison using an unadjusted population
 mortality rate.

Table 2 provides COVID-19 case counts and rates by state and calculates the ratio of cases
per 100,000 people in prison to cases per 100,000 residents in the final column. An
adjustment for the sex, age, and race/ethnicity of people in prison was not possible due to the
unavailability of confirmed COVID-19 case data by individual demographic characteristics.
Even without the ability to adjust for demographic characteristics, Table 2 demonstrates a
striking disparity of cases in prisons compared with statewide totals. Over 10% of the people
in state prison in Vermont, for example, tested positive for COVID-19, a rate nearly 50 times
higher than the rate of confirmed cases for the state as a whole. While Vermont appears to be
an outlier, the number of COVID-19 positive cases in prison is five or more times what would
be expected based on confirmed cases for 17 states. On the other hand, prisons in 14 states
have had fewer positive COVID-19 tests per capita than the corresponding state
populations. While these comparisons clearly demonstrate heterogeneity across states,
there are substantial differences in the COVID-19 testing policies and procedures both inside
and outside prisons across states.

KEY FINDING

 The rate of COVID-19 cases reported by state and federal prisons in the U.S. is nearly 7000 cases
 per 100,000 people in prison, more than four times the rate of confirmed cases per 100,000 U.S
 residents. An adjustment for the sex, age and race/ethnicity of people in prison was not possible due
 to the lack of confirmed COVID-19 case data by demographic characteristics.
Table 2: COVID-19 cases by state prisons and overall state populations
C O V I D - 1 9 C A S E A N D M O R T A L I T Y R A T E S BY
FACILITY CHARACTERISTICS
Since early concerns emerged about testing and reporting in prisons (such as those with the
Federal Bureau of Prisons discussed by Chwalisz (2020), most state and federal corrections
agencies now regularly report case statistics at the facility level. At least two research teams
(Kaplan et al. (2020) and UCLA Law (2020)) gather this information from various federal and
state agency websites and make it publicly available.7
To compare COVID-19 cases and mortality across different types of prisons, facility-level
counts from UCLA Law (2020) were linked to the 2012 Census of State and Federal Adult
Correctional Facilities (CSFACF) (United States Bureau of Justice Statistics 2020). While
facility information in the CSFACF is now almost eight years old, it represents the best
available information with broad coverage of prisons across the U.S. Information available
through the CSFACF includes the facility address, operator type, and total male and female
populations in 2012. In total, 1,142 of 1,475 (77%) facilities in the UCLA Law (2020) data are
linked to individual facilities in the CSFACF. Table 3 summarizes COVID-19 cases and deaths
for the 1,142 facilities in the UCLA Law (2020) data that we were able to link to the 2012
CSFACF.
Table 3 indicates that, as of August 15, 2020, COVID-19 has likely entered the majority of
prisons in the U.S. 8 Of the 1,137 linked facilities reporting COVID-19 case or death data,
68% have at least one positive COVID-19 case within their incarcerated population. Within
the 945 facilities reporting COVID-19 case or death data for correctional staff, 74% have at
least one positive case among staff. On average, a prison in the U.S, has seen nearly 90
COVID-19 cases between incarcerated individuals and staff.
KEY FINDING
The types of prisons with the highest number of COVID-19 cases are those operated by state
governments, prisons in the southern region of the U.S., and prisons that are large in terms of
population (over 1,000 inmates). The highest COVID-19 mortality rates are observed within large
prisons and those within the Midwest region of the U.S.
7
Kaplan et all (2020) stopped collecting facility-level data on July 13, 2020, so this report focuses on data
provided through UCLA Law (2020), which continues to be updated daily as of this report.
8
While we can claim that the majority of prisons are listed in the UCLA Law (2020) data, is it possible that many
facilities are not reporting this information. Therefore, we cannot claim for certain that the majority of all
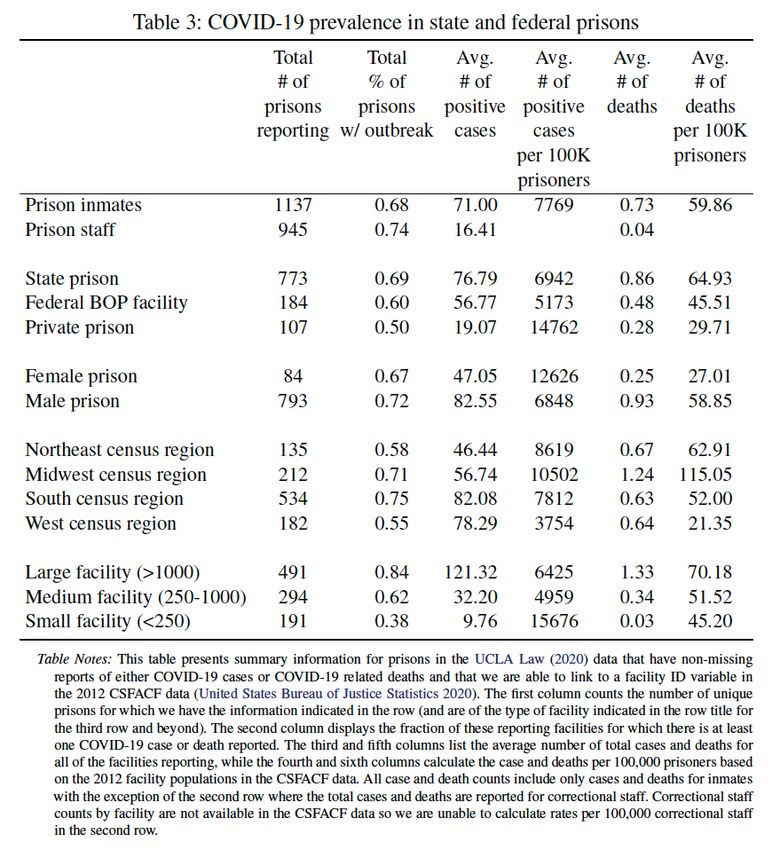
prisons in the U.S. have at least one COVID-19 case.Table 3: COVID-19 prevalence in state and federal prisons
Table 3 also reveals differences across the relative contributions of different types of
facilities to this crisis. State prisons are 9 percentage points more likely to record an outbreak
and exhibit higher rates of both COVID-19 cases and deaths compared with federal prisons.
Private prisons exhibit the lowest total number of COVID-19 cases – but the highest number
of cases per 100,000 people in prisons – compared with facilities that are operated by states
or the federal government. This difference may reflect differences in the rate of testing or the
types of private facilities we are able to match to facility-level data. The number of deaths per
100,000 reported by private facilities is considerably lower than the rate at prisons operated
by state or federal governments.

Prisons in the South represent the largest number of prisons by region as well as the highest
number of COVID-19 cases. However, they have case and death rates lower than prisons in
the Northeast and Midwest. Interestingly, the average number of deaths is much higher in
the Midwest region with an average of 1.24 COVID-19 related deaths per prison (which
translates to 115 deaths per 100,000 imprisoned people).

The final group of rows in Table 3 splits facilities into three size categories: large prisons
incarcerating more than 1,000 people; medium prisons with populations between 250 and
1,000; and small facilities incarcerating fewer than 250 inmates.9 Large facilities are clearly the
most important contributors to the COVID-19 crisis in prisons. On average, each of these
prisons has more than 120 cases and 1.33 deaths, and only 16% have reported zero cases.
Moreover, these 491 large prisons account for 83% of the total cases and 87% of the total
number of deaths reported in the UCLA Law (2020) dataset. Small prisons exhibit lower rates
of COVID-19 outbreaks, but cases per 100,000 people in prison are high on average due to
their small population size.

An analysis of the influence of prison facilities, especially large prisons in more rural counties,
is an important area for future research once COVID-19 data is available at a more detailed
geographic level and/or when it can be established how cases and deaths in prisons are
reported in data aggregated at a community level.

9
    An incarcerated population of 1,000 is approximately the median size of prisons linked to the 2012 CSFACF.
POLICY IMPLICATIONS, DATA GAPS, AND FUTURE RESEARCH State and federal prison facilities across the U.S. are COVID-19 hotspots. This report provides a detailed description of the magnitude of the COVID-19 crisis within prisons using the best data available. The figures and tables illustrate substantial variation in the intensity of this crisis both across state jurisdictions as well as across prison facilities that vary by population and the type of organization operating the facility (state government, federal government, or a private corporation). Documenting this variation lays an important foundation for researchers and policymakers to further investigate which policies have been most effective in protecting vulnerable staff and incarcerated populations. Describing the incidence of COVID-19 infection across different states and types of facilities is also a step toward understanding the association between prison facilities and COVID-19 in surrounding communities. The daily churn of staff and visitors along with the admission and release of imprisoned people may facilitate the spread of the virus both inside and outside the prison. Estimating the relationship between prisons and COVID-19 outcomes in their wider communities was not possible in this report, given data limitations. COVID-19 case and death data are currently only available at the county level. This ignores impacts on smaller communities, which are most likely to be affected by a prison COVID-19 outbreak. Moreover, the county of residence for people entering and leaving custody in state and federal prison facilities is often different from the location of the prison. Finally, at the time of this report it was not clear whether (or when) prison cases and deaths were recorded in the county COVID-19 case and death counts. 10Therefore, it was not possible to separate COVID-19 outcomes within prisons from those outside of the prison walls in each county. Once more detailed COVID-19 data becomes available, evaluating the impact of COVID-19 prison infections and policy response on community COVID-19 transmission is an important area for future research. An analysis of COVID-19 within jails was also considered for inclusion in this report. However, case and mortality information is currently only available for a handful of jails. 11 COVID-19 in jails presents different issues for the incarcerated population and residents of the surrounding area given the high flow of individuals in and out of these facilities. It is also the case that county jails have been more likely to reduce their populations throughout the COVID-19 crisis. In May, Widra and Wagner (2020) noted that while the typical jail saw population reductions of around 30%, the typical prison only reduced its population by 5%. Evaluating the impact of the variation in flows in and out of jails and prisons on community COVID-19 transmission is another critical topic for future study. 10 A comparison of facility-level COVID-19 outcomes in several areas with large prisons indicated higher rates of cases or deaths than were reported for counties where the facilities are located. The data reflected outcomes as of August 15, 2020. 11 UCLA Law (2020) is collecting information for several county jails that report COVID-19 cases and/or death information.
REFERENCES
Carson, E. A.: 2020, Prisoners in 2018, US Department of Justice, Office of Justice Programs,
   Bureau of Justice Statistics, NCJ 253516.

Centers for Disease Control and Prevention: 2020a, Deaths involving coronavirus disease
   2019 (COVID-19) by race and Hispanic origin group and age, by state. Accessed August
   19, 2020, https://data.cdc.gov/NCHS/Deaths-involving-coronavirus-disease-2019-
   COVID-19/ks3g-spdg.

Centers for Disease Control and Prevention: 2020b, Deaths involving coronavirus disease
   2019 (COVID-19), pneumonia, and influenza reported to NCHS by sex and age group
   and state. [Online]. Accessed August 19, 2020, https://data.cdc.gov/NCHS/Deaths-
   involving-coronavirus-disease-2019-COVID-19/ks3g-spdg.

Chwalisz, N.: 2020, The Federal Bureau of Prisons response to the coronavirus has been
  disastrous and deadly, The Washington Post . August 7, 2020.
  https://www.washingtonpost.com/opinions/local-opinions/the-federal-bureau-of-
  prisons-response-to-the-coronavirus-has-been-disastrous-and-
  deadly/2020/08/06/3d30464c-d65b-11ea-aff6-220dd3a14741_story.html.

Doleac, J., Harvey, A. and Kaplan, J.: 2020, Incarceration and the COVID-19 crisis,
   Econofact. May 20, 2020. https://econofact.org/incarceration-and-the-covid-19-crisis.

Hardy, B. L. and Logan, T. D.: 2020, Racial Economic Inequality Amid the COVID-19 Crisis.
   Essay 2020-17, The Hamilton Project. Accessed August 14, 2020,
   https://www.brookings.edu/wp-
   content/uploads/2020/08/EA_HardyLogan_LO_8.12.pdf.

Hawks, L., Woolhandler, S. and McCormick, D.: 2020, Covid-19 in prisons and jails in the
United States, JAMA Internal Medicine 180(8), 1041–1042.

Kajstura, A. and Landon, J.: 2020, Since you asked: Is social distancing possible behind bars?
   Prison Policy Initiative. April 3, 2020.
   https://www.prisonpolicy.org/blog/2020/04/03/density/.

Kaplan, J., Hoyos-Torres, S., Gur, O., Concannon, C. and Jones, N.: 2020, Covid-19 in prisons
   in the United States. Accessed August 1, 2020, https://covidprisondata.com.

Maruschak, L. M., Berzofsky, M. and Unangst, J.: 2015, Medical problems of state and federal
  prisoners and jail inmates, 2011-12, US Department of Justice, Office of Justice Programs,
  Bureau of Justice Statistics.

Oster, A. M., Kang, G. J., Cha, A. E., Beresovsky, V., Rose, C. E., Rainisch, G., Porter, L.,
   Valverde, E. E., Peterson, E. B., Driscoll, A. K., Norris, T. et al.: 2020, Trends in Number and
   Distribution of COVID-19 Hotspot Counties — United States, March 8–July 15, 2020,
   MMWR Morbidity and Mortality Weekly Report ePub, 14: August 2020.

Sabol, W. J., Johnson, T. L. and Caccavale, A.: 2020, Trends in correctional control by race and
   sex, Federal Sentencing Reporter 32(3), 157–177.
Saloner, B., Parish, K., Ward, J. A., DiLaura, G. and Dolovich, S.: 2020, Covid-19 cases and
deaths in federal and state prisons, JAMA 324(6), 602–603.
Smith, M., Yourish, K., Almukhtar, S., Collins, K., Ivory, D., McCann, A. et al.: 2020, Coronavirus
in the US: Latest map and case count, The New York Times. Accessed August 19, 2020.
https://www.nytimes.com/interactive/2020/us/coronavirus-us-
cases.html?action=click&pgtype=Article&state=default&module=styln-coronavirus-
world&variant=show®ion=TOP_BANNER&context=storylines_menu&clusters.
The Marshall Project: 2020, A State-by-State Look at Coronavirus in Prisons. Accessed
August 19, 2020, https://www.themarshallproject.org/2020/05/01/a-state-by-
state-look-at-coronavirus-in-prisons.
UCLA Law: 2020, UCLA COVID-19 Behind Bars Data Project. Accessed August 7, 2020,
https://law.ucla.edu/academics/centers/criminal-justice-program/ucla-covid-19-
behind-bars-data-project.
United States Bureau of Justice Statistics: 2020, Census Of State and Federal Adult
Correctional Facilities (CSFACF), 2012. Accessed August 1, 2020,
https://doi.org/10.3886/ICPSR37294.v1.
U.S. Bureau of Justice Statistics: 2020, National prisoner statistics, United States, 1978-
2018.
USA Facts: 2020, Coronavirus locations: Covid-19 map by county and state. Accessed
August 18, 2020, https://usafacts.org/visualizations/coronavirus-covid-19-spread-
map/.
Wallace, M., Hagan, L., Curran, K. G., Williams, S. P., Handanagic, S., Bjork, S. L., Davidson, S. L.,
Lawrence, R. T., McLaughlin, J., Butterfield, M. et al.: 2020, COVID-19 in Correctional and
Detention Facilities—United States, February–April 2020, MMWR Morbidity and
Mortality WeeklyReport 69, 587–590.
Widra, E. and Wagner, P.: 2020, While jails drastically cut populations, state prisons have
released almost no one, Prison policy initiative. Accessed August 20, 2020,
https://www.prisonpolicy.org/blog/2020/05/01/jails-vs-prisons/.
Wildeman, C. and Wang, E. A.: 2017, Mass incarceration, public health, and widening
inequality in the USA, The Lancet 389(10077), 1464–1474.You can also read