Australian Lamb and Sheep Meat Annual Review 2018 - Rural Bank
←
→
Page content transcription
If your browser does not render page correctly, please read the page content below
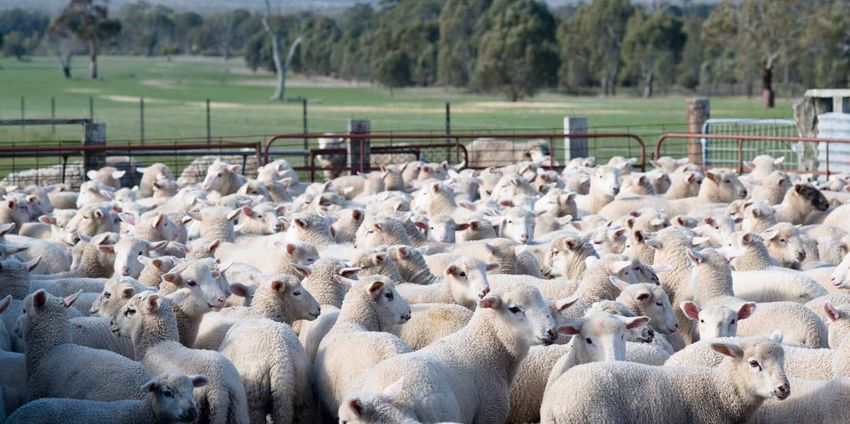
Australian Lamb and Sheep Meat Annual Review 2018
About the research                                                                 About Rural Bank
The Australian Lamb and Sheep Meat Annual Review includes                          Rural Bank has been a wholly-owned subsidiary of Bendigo and
data and outlooks on factors affecting Australian and international                Adelaide Bank Limited since 2010. It is the only Australian-owned
sheep markets, such as production, seasonal conditions, prices and                 and operated dedicated agribusiness bank, providing exceptional
demand. Significant effort has been taken to secure the most recent                financial services, knowledge and leadership for Australian farmers
data available.                                                                    to grow.
Where appropriate, Middle East and North African nations are                       About Ag Answers
referred to as the Middle East and North Africa (MENA).
                                                                                   Ag Answers is a specialist insights division of Rural Bank. Recognising
MENA includes: Algeria, Bahrain, Djibouti, Egypt, Gaza Strip, Iran,                that good information is the key to making good business decisions,
Iraq, Israel, Jordan, Kuwait, Lebanon, Libya, Morocco, Oman, Qatar,                Rural Bank provides research and analysis into commodities, farmland
Saudi Arabia, Syria, Tunisia, United Arab Emirates, West Bank                      values, farm business performance and topical agricultural issues to
and Yemen.                                                                         enable farmers to make informed decisions.

This report is intended to provide general information on a particular subject or subjects and is not an exhaustive treatment of such subject(s).
The information herein is believed to be reliable and has been obtained from public sources believed to be reliable. Rural Bank Limited, ABN 74 083 938
416 AFSL / Australian Credit Licence 238042 makes no representation as to or accepts any responsibility for the accuracy or completeness of information
contained in this report. Any opinions, estimates and projections in this report do not necessarily reflect the opinions of Rural Bank and are subject to change
without notice. Rural Bank has no obligation to update, modify or amend this report or to otherwise notify a recipient thereof in the event that any opinion,
forecast or estimate set forth therein, changes or subsequently becomes inaccurate. This report is provided for informational purposes only. The information
contained in this report does not take into account your personal circumstances and should not be relied upon without consulting your legal, financial, tax or
other appropriate professional.
© Copyright Rural Bank Ltd ABN 74 083 938 416 and Bendigo and Adelaide Bank Ltd ABN 11 068 049 178 (RBL19085) (07/18)

                                                                               2
Summary

The Australian sheep industry continued its strong run in 2017 with               stock when they would otherwise seek to increase flocks to take
a fifth consecutive year of growth in the average annual trade lamb               advantage of historically high prices. This has seen slaughter rates
price, and fourth consecutive year of growth in the mutton price.                 trend higher, putting downwards pressure on sheep and lamb prices
Lamb production in 2017 was 1.3 per cent lower than 2016, the                     earlier in the year. However the strength of demand is such that
first year of decline after five consecutive years of growth. Growth              prices only declined marginally under the weight of the extra supply.
in both production and prices for a sustained period is a remarkable              Tightening supplies in June have seen prices trend higher, with lamb
combination, and highlights the growing strength of demand over                   entering record territory above 700c/kg.
that time. Given that domestic consumption of sheep meat has
                                                                                  The outlook for the industry remains very positive with global
remained steady, the growth in demand is almost exclusively from
                                                                                  demand set to continue to outpace supply, meaning increased
export markets, namely the US, China and Middle East.
                                                                                  opportunities for Australian sheep meat exports and sustained
The value of exports from the Australian sheep industry was $3.7                  support for prices. The low Australian flock is a limiting factor
billion, equivalent to 7.4 per cent of Australia’s total agri-food exports.       to supply, and producers will be looking for improved seasonal
Sheep industry exports grew by $622 million in 2017, accounting for               conditions to allow for flock expansion.
10.5 per cent of the almost $6 billion growth of agri-food exports; a
                                                                                  This report provides analysis of historical trends of seasonal
significant contribution to the sector’s growth.
                                                                                  conditions, prices, production and demand, both domestically and
Positive sentiment has continued for sheep producers into 2018, but               from a global perspective. It also investigates the outlook for the
has been tempered slightly by poor seasonal conditions which have                 Australian sheep industry and the likelihood of the current strength
forced some producers to buy in more feed or consider turning-off                 of the industry continuing.

                                                                              3
Seasonal conditions
Australian sheep producers have experienced mostly dry conditions South Wales, the Mallee and Wimmera in Victoria and parts of
in 2018. A good, albeit late, spring in 2017 provided most regions South Australia where some areas were ‘greener’ than average.
with a good feed base to get through summer. However, the early
Drier than average conditions are expected to continue through
months of 2018 have been drier than average and have seen pasture
winter. The major sheep producing regions of New South Wales,
conditions deteriorate in most sheep producing regions, except
northern Victoria and South Australia are unfortunately among the
for western Victoria and Western Australia which are experiencing
areas with the least likelihood of receiving median rainfall. Conditions
favourable lambing conditions. Autumn largely failed to provide much
are also expected to be warmer than average for most of Australia
improvement in conditions, resulting in poor pasture conditions going
during winter.
into winter.
Both the El Niño – Southern Oscillation and the Indian Ocean Dipole
The extended period of dry conditions is reflected in soil moisture
are forecast to hold their neutral state during winter and therefore
estimates. Most major sheep producing regions had below average
have less influence on Australia’s climate, making local drivers more
root zone soil moisture during May. Soil moisture was average to
influential. The rainfall outlook for south eastern Australia is being
above average in south eastern South Australia, south west Victoria
influenced by below average pressure (warmer water) over the
and Tasmania.
Tasman Sea, which is expected to reduce the rainfall making its way
The effects of below average soil moisture are shown in the to Australia by weakening the westerlies. Longer range models are
normalised difference vegetation index (NDVI) where vegetation in beginning to suggest an El Niño may develop in spring, with La Niña
May was lower than the long term average for the month in many the least likely scenario later in the year.
sheep producing areas. The exception to this was in southern New
Recent rainfall deciles – Mar to May 2018 Chance of above median rainfall outlook – Jul to Sep
80
Rainfall Decile
Ranges 75
70
Chance of exceeding median rainfall (%)
Highest
on record 65
10 Very much above
60
average
8-9 Above average 55
50
4-7 Average
45
2-3 Below average
40
Very much
1
below average 35
lowest on
30
record
25
20
Source: Bureau of Meteorology, 2018 Source: Bureau of Meteorology, 2018
Relative root zone soil moisture – May 2018 Vegetation index anomaly – May 2018
Root zone 5.0
soil moisture 3.0
2.0
Highest 1% 1.5
Very much above 1.0
average 0.6
Above average 0.2
-0.2
Average
-0.6
-1.0
Below average
-1.5
Very much
below average -2.0
lowest on -3.0
record -5.0
No Data
Source: Bureau of Meteorology, 2018 Source: Bureau of Meteorology, 2018
4
Australian production
Australian lamb slaughter fell 2.3 per cent in 2017, brought down by be tighter supplies during winter as most old season lambs will have
tighter supply in the first half of the year when seasonal conditions already been sold and new season lambs are expected slightly later.
allowed for greater stock retention for flock expansion. Slaughter in Winter and spring rainfall will be a major factor in determining lambing
the second half of 2017 was higher than 2016 as conditions began percentages and overall production for the year.
to deteriorate and forced some stock turn-off. The trend of increased
The Australian sheep flock recovered 4.2 per cent to 70.2 million in
slaughter has continued in early 2018 with year to date lamb
2017 after a dip in 2016. Producer intentions to continue expanding
slaughter trending 8.1 per cent higher than 2017 as dry conditions in
flocks to take advantage of strong returns for both sheep meat and
NSW and Victoria have prompted increased stock turn off.
wool were evident in early 2017, when seasonal conditions allowed
Mutton production also experienced a year in two parts, with tight for greater retention of stock for breeding and wool production.
supplies in early 2017 and a significant rise in slaughter in the However, despite price incentives to expand flocks, the dry seasonal
second half of the year leading to an annual increase of 10.9 per conditions later in the year and in early 2018 produced headwinds
cent. Mutton production has continued to grow in 2018 with year to for flock expansion. The increased slaughter observed in 2018 will
date production trending 14.8 per cent above 2017 as producers delay growth in the flock and subsequently limit production growth.
reluctantly continue to turn-off older stock. It is expected that producers will switch into flock expansion activities
when seasonal conditions improve.
Sheep and lamb slaughter in 2018 continues to exceed expectations
as a result of poor seasonal conditions, and indicates that there will
The Australian sheep flock was approximately 70.2 million after a 4.2 per cent increase in 2017
130 25
120
20
million head slaughtered
110
100
million head
15
90
80 10
70
5
60
50 0
2000
2001
2002
2003
2004
2005
2006
2007
2008
2009
2010
2011
2012
2013
2014
2015
2016
2017
Sheep flock (LHS) Lamb slaughter (RHS) Sheep slaughter (RHS) Data: Meat and Livestock Australia (MLA),
Australia Bureau of Statistics (ABS)
Australian lamb production for January to Australian lamb production for January to
April 2018 was 8 per cent higher than 2017 April 2018 was higher in Victoria and NSW
55 100
90
50
80
45 70
‘000 tonnes cwt
‘000 tonnes cwt
60
40 50
40
35
30
30 20
10
25 0
Jan Feb Mar Apr May Jun Jul Aug Sep Oct Nov Dec VIC NSW SA WA TAS QLD
5yr ave 2016 2017 2018 Jan-Apr 2016 Jan-Apr 2017 Jan-Apr 2018
Data: MLA Data: MLA
5
International production

World sheep meat production is expected to continue its upward                with average annual lamb slaughter 20.6 per cent lower than the
trajectory in 2018 and reach 15 million tonnes for the first time. This       early 2000s. This is largely due to a shift towards expansion of dairy
follows a 1.2 per cent increase in 2017. The growth in world production       and beef production. New Zealand and Australia are the dominant
has been a long-term trend with a 29 per cent increase being                  exporters of sheep meat, each accounting for approximately 34
recorded since 2000, driven by increases in China and Africa of 70            per cent of global exports. Declining capacity for growth in sheep
and 63 per cent, respectively.                                                meat exports from New Zealand has the potential to create more
                                                                              opportunities for Australian exports to meet growing demand. This
The expected growth in production in 2018 is largely from China.
                                                                              is particularly true in New Zealand’s key markets such as China and
China has been a major contributor to the long-term growth in world
                                                                              Europe, where Australia has lower market share.
sheep meat production and produced 32 per cent of the world’s sheep
meat in 2017. Chinese production is almost exclusively consumed               US sheep meat production continued its steady decline in 2017,
domestically, but has been unable to keep up with growing domestic            falling a further 3.3 per cent; 12 per cent lower than 2010. USDA
demand since the late 2000s, creating an opportunity for sheep                forecasts expect this trend to continue in 2018 with a small decline in
meat imports. In 2017, imports accounted for only 4.3 per cent of             production of 0.7 per cent. While production has been trending lower,
consumption.                                                                  US consumption has been increasing. As a result, the percentage of
                                                                              consumption met by domestic production has declined from 52%
New Zealand lamb slaughter increased by 2.9 per cent in 2017 but is
                                                                              in 2010 to 37% in 2017, increasing the dependence on imports to
trending 3.8 per cent lower in 2018. The New Zealand sheep industry
                                                                              meet demand.
has been operating on a much smaller scale in the last nine years,

                                                                          6
New Zealand lamb slaughter is trending                                                       New Zealand lamb exports are trending
                 3.5            3.8 per cent below 2017                                                                    12.4 per cent lower in 2018
                                                                                                                60

                 3.0                                                                                             50
                 2.5
                                                                                                                40

                                                                                              ‘000 tonnes swt
million head

                 2.0
                                                                                                                30
                 1.5
                                                                                                                 20
                 1.0

                 0.5                                                                                             10

                  0                                                                                               0
                       Jan Feb Mar Apr May Jun Jul Aug Sep Oct Nov Dec                                                China        UK      Germany Netherlands       USA       France
                       5yr ave      2016      2017       2018                                                         Jan-Apr 2016        Jan-Apr 2017       Jan-Apr 2018
                                                           Data: Statistics New Zealand                                                                      Data: Statistics New Zealand

                       Chinese sheep meat production to increase                                                       US sheep meat production to decrease
                         by 3.1 per cent in 2018, consumption to                                                        by 0.7 per cent in 2018, consumption
                                  increase 2.9 per cent                                                                        to increase 0.3 per cent
                 5.5                                                                                            200
                                                                                                                180
                 5.0                                                                                            160
                                                                                                                140
                                                                                              ‘000 tonnes cwt
million tonnes

                 4.5                                                                                            120
                                                                                                                100
                 4.0                                                                                            80
                                                                                                                60
                 3.5                                                                                            40
                                                                                                                 20
                 3.0                                                                                              0
                       2012      2013      2014   2015     2016      2017      2018f                                  2012      2013      2014      2015      2016     2017      2018f
                       Production       Consumption f= OECD forecast                                                  Production        Consumption* f= USDA forecast
                                                                      Data: OECD-FAO                                                Data: United States Department of Agriculture (USDA)
                                                                                                                              * Consumption estimated based on production and trade data

                                                                                          7
Demand and trade

  The growing strength of demand from export markets continues                              There are also opportunities arising from declining exports from
  to provide strong support for high sheep and lamb prices, despite                         New Zealand which holds a 55 per cent share of the Chinese sheep
  domestic consumption remaining the largest market for Australian                          meat import market, but have experienced a 10 per cent decline in
  sheep meat. Since 2010, domestic consumption of lamb has                                  lamb export volume to China so far in 2018.
  remained relatively steady, with the growth in production since then
                                                                                            Lamb export volumes to the US for the year to April are 5.2 per
  going almost entirely to export markets. As a result, the share of
                                                                                            cent below 2017, following an eight per cent decline in 2017.
  production exported increased from 40 per cent in 2010 to 51 per
                                                                                            The average lamb export price to the US is averaging 4.8 per cent
  cent in 2017. Export demand is even more significant for mutton
                                                                                            lower than 2017, but still at historically high levels. Lower volumes and
  markets with export volumes equivalent to 87 per cent of production
                                                                                            prices suggest some price resistance for lamb, with other proteins
  in 2017, up from 78 per cent in 2010.
                                                                                            experiencing price declines in the US. Despite an easing in volumes,
  Increased slaughter rates in 2018 have resulted in a five per cent                        demand fundamentals remain strong with lamb growing in popularity,
  increase in the volume of lamb exported between January and                               particularly among millennials in the casual dining and fast food
  April compared to 2017. Exports in March set a new record high for                        segments of the food service sector.
  monthly volume, up 21 per cent from February to 26,288 tonnes. The
                                                                                            The Middle East and North Africa (MENA) region is also
  price of exported lamb has averaged $8/kg this year, five per cent
                                                                                            demonstrating strong demand with a 20 per cent increase in lamb
  higher than 2017, signalling that demand continues to exceed supply.
                                                                                            export value for the year to date, building upon a 16 per cent increase
  The same can be said of mutton, with year to date export volumes up
                                                                                            in value recorded in 2017. This growth is coming from both higher
  15 per cent on 2017 and average price up 3.5 per cent.
                                                                                            prices (+8.2 per cent) and higher volumes (+11.2 per cent). Mutton
  China overtook the US as Australia’s top lamb export market by                            exports to MENA are trending lower in 2018 with volume down
  volume in 2017, registering a 30 per cent increase in volume and 25                       9.6 per cent and value down 7.7 per cent. This comes after growth in
  per cent increase in average price, combining for a remarkable 63 per                     value of 14 per cent in 2017.
  cent jump in export value to $265 million. Mutton exports also had
                                                                                            Lamb continues to increase in popularity in South Korea, albeit from a
  a good year in China, returning to $206 million, just below the peak
                                                                                            very low base. This was observed in a 63 per cent increase in export
  of 2014. Chinese sheep meat import demand can be volatile as it is
                                                                                            value in 2017. This trend has continued in early 2018 with year to date
  dependent on the often variable domestic production which supplies
                                                                                            export value increasing by 18.6 per cent compared to the same time
  approximately 95 per cent of consumption. Demand from China has
                                                                                            last year.
  continued to strengthen in 2018 with the volume of lamb exports
  trending 5.6 per cent higher than 2017 and average prices up 8.6 per                      All factors considered, the outlook for demand and trade is very
  cent. Mutton exports have increased even further with volume up 43.5                      positive with combinations of growing volumes and prices pointing to
  per cent and price up 30.4 per cent. The value of mutton exports for                      very strong demand. The long term trend of declining production in
  January to April is $67 million, already exceeding the value of exports                   New Zealand adds further optimism for the Australian sheep industry
  for the first eight months of 2017. Australian exports to China have                      to capture an increased share of global demand.
  the potential to continue growing from increasing import demand.

                          The volume of Australian lamb exports                                                        Lamb exports to China and MENA
                  28     are trending 5 per cent higher than 2017                                                         are trending higher in 2018
                                                                                                               25
                  26
                  24                                                                                           20
                  22
‘000 tonnes swt

                                                                                             ‘000 tonnes swt

                  20                                                                                           15

                  18
                                                                                                               10
                  16
                  14                                                                                            5
                  12
                  10                                                                                            0
                       Jan Feb Mar Apr May Jun Jul Aug Sep Oct Nov Dec                                              China      MENA       USA     South Korea    Japan
                       5yr ave   2016    2017      2018                                                             Jan-Apr 2016   Jan-Apr 2017   Jan-Apr 2018
                                        Data: Global Trade Information Service (GTIS)                                                                            Data: GTIS

                                                                                        8
Export markets - country detail

Destination                                     YoY%      2017%   Jan-Apr   Jan-Apr        YoY%
               2015      2016      2017
Country                                        Change     Share    2017      2018         Change
                        LAMB EXPORTS (‘000 TONNES SWT)
World          250        260        264         2%                 86        90              5%
China          38          47         62       30%        23%       21        22              6%
USA             58         59         54        -8%       21%       18        17             -5%
UAE             19         21         20        -7%        7%        7         7             -5%
Qatar           13         15         13       -14%       5%        4         4             -17%
South Korea     6           9         12       38%        5%        4         4              -4%
                       MUTTON EXPORTS (‘000 TONNES SWT)
World          161        142        162       15%                  50        57            15%
China          36          31         47       53%        29%       10        15           43%
Malaysia        16         16         15        -7%        9%        3         6            72%
USA             14         10         14       41%         9%        7         5           -25%
Saudi Arabia    17         12         14       19%         9%        6         6             6%
Singapore       10         10         10        2%        6%         3        4             14%
                         LIVE SHEEP EXPORTS (‘000 HEAD)
World          1,960     1,870      1,950       4%                 589       552            -6%
Kuwait          633       635        646        2%        33%      230       101           -56%
Qatar           387       561        640        14%       33%      189       164           -13%
Turkey            0         0        225                  12%                154
UAE             250       191        114       -41%        6%       35        26           -28%
Oman             80        90        113       26%        6%        53        17           -68%

Destination                                  YoY%         2017%   Jan-Apr   Jan-Apr        YoY%
               2015      2016      2017
Country                                     Change        Share    2017      2018         Change
                           LAMB EXPORTS (A$ MILLIONS)
World          1,774     1,799     2,114       18%                 648       714            10%
USA            598        610       651         7%        31%      209       190            -9%
China           141       163       265        63%        13%       84        97            15%
UAE             138       153       163         7%         8%       58        56            -3%
South Korea      42       65        106        63%         5%       33        39            19%
Qatar            93       102       106         4%         5%       30        32             6%
                         MUTTON EXPORTS (A$ MILLIONS)
World          751        641       929        45%                 277       329            19%
China          108         78       207       165%        22%      36         67           88%
USA             93        69        118        70%        13%      61        35            -42%
Malaysia        73         71        84        19%        9%        17       34             97%
Saudi Arabia    73         51        75        48%        8%       32        34             5%
Singapore       50        49         58        18%        6%        17       23            35%
                       LIVE SHEEP EXPORTS (A$ MILLIONS)
World          246        218       249        14%                  76        79            4%
Qatar           47        60         83        39%        34%       24        21           -10%
Kuwait          76        69         82        19%        33%       29        13           -54%
Turkey           0          0        25                   10%                 17
Oman             9         11        16        55%         7%       8          2           -72%
UAE             28        20         14       -32%        6%        4         3            -24%
                                                                                             Data: GTIS
                                                                                   SWT = shipped weight

                                           9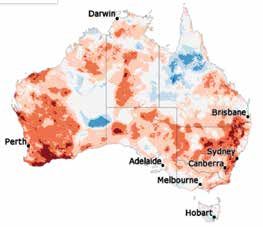
Prices
Australian lamb prices had a fantastic run in 2017 with the Eastern Eastern states trade lamb indicator increased
States Trade Lamb Indicator (ESTLI) averaging 626c/kg, an 11 per
750
14 per cent from mid-April 2018
cent increase on 2016. This was the fifth consecutive year of growth in
the annual price, and a 50 per cent increase on the 2012 average. 700
Lamb prices steadily eased from January to March as more numbers 650
came onto the market due to deteriorating seasonal conditions, but
600
c/kg cwt
began to recover in late April. A tightening supply of lambs in recent
weeks has accelerated the recovery in prices and seen the ESTLI 550
reach a record high of 712c/kg. At a national level, indicators are all
averaging lower for the year to date, with restocker lambs showing the 500
largest drop (down15 per cent) after being in strong demand this time 450
last year. Merino lamb prices are only trending 1.9 per cent lower than
2017 with high wool prices providing a floor to demand. The only lamb 400
categories to record year on year increases in price are trade, heavy Jan Feb Mar Apr May Jun Jul Aug Sep Oct Nov Dec
and Merino lambs in Western Australia where seasonal conditions 5yr ave 2016 2017 2018
were more ideal than in eastern states earlier in the year. Data: MLA
Despite prices trending lower than 2017 levels, they have still been
quite resilient to pressure of increased slaughter. This resilience has
been supported by strong demand, particularly from export markets. Prices are averaging below 2017 levels for all
800
categories of Australian lamb
Domestic sheep prices are benefiting from the relatively low Australian
dollar in 2018. The dollar has averaged 77 US cents so far in 2018, 700
but has been steadily declining from a high of 81 cents in late January
Average price (c/kg cwt)
to a low of 74 cents in June. 600
500
The Australian dollar is relatively low from a historic perspective,
particularly compared to 2011 when lamb prices were at similar 400
levels to 2018. The ESTLI for year to date is only averaging 1.8 per 300
cent higher than the same period in 2011, however the ESTLI in US
200
dollars is 23.7 per cent lower. This is good news for Australian sheep
producers who are receiving historically high prices, while international 100
buyers are paying closer to the historic average. 0
Restocker Light Trade Heavy Merino
2016 YTD 2017 YTD 2018 YTD
Data: MLA
The Australian dollar has been trending lower
0.83 after a high of 81c in January
0.81
0.79
0.77
AUD/USD
0.75
0.73
0.71
0.69
0.67
0.65
Jan-16
Mar-16
May-16
Jul-16
Sep-16
Nov-16
Jan-17
Mar-17
May-17
Jul-17
Sep-17
Nov-17
Jan-18
Mar-18
May-18
Jul-18
Data: Reserve Bank of Australia
10Rural Bank modelling forecasts lamb prices to remain at existing high Over the longer term, Australian sheep and lamb prices are expected
levels through winter before easing through spring and into summer. to remain above long term averages as demand continues to outpace
Seasonal conditions in winter and spring will play a significant role supply. The outlook for continued growth in global sheep meat import
in the direction of prices within the model’s 68 per cent confidence demand means Australia will continue to have robust demand from
interval range, which averages between 592-711c/kg. It is expected major export markets of the US, China and the Middle East, as well
that prices will trend closer to the upper end of the range, particularly as emerging markets such as South Korea. Supply is expected to
with expectations that lamb supply over winter will be tight, given continue to struggle to match the growth in demand due to a low
that most old season lambs were sold earlier than usual and new Australian flock and the steadily declining industry in New Zealand.
season lambs are likely to be finished later than usual due to poor These factors all favour continued strength in sheep and lamb prices
seasonal conditions. This could mean a continuation of the upwards in Australia.
trend in prices observed since late April, before the usual easing of
prices in spring when new lambs come into markets. An improvement
in seasonal conditions from now to the end of the year would give
prices a further boost with producers looking to retain more lambs,
tightening supply, and restockers looking to compete with processors
in markets, strengthening demand.
Eastern States Trade Lamb Indicator
800
700
600
500
c/kg cwt
400
300
200
95% confidence interval
100
68% confidence interval
0
Jan -11
Jun -11
Nov -11
Apr -12
Sep -12
Feb -13
Jul -13
Dec -13
May -14
Oct -14
Mar -15
Aug -15
Jan -16
Jun -16
Nov -16
Apr -17
Sep -17
Feb -18
Jul -18
Dec -18
Data: MLA, Ag Answers forecast
Australian mutton prices are averaging Australian mutton prices increased by an exceptional 25.7 per
6.8 per cent below 2017 cent in 2017, the fourth consecutive year of growth in the average
550 annual price. The average price of 439c/kg was the highest on
record and 74 per cent higher than 2012.
500
Prices have remained high in 2018, but have trended below the
450 exceptional prices of 2017 since late March. The main cause of
prices being lower than this time last year has been the relatively
400
c/kg cwt
higher slaughter rates, however strong demand, particularly from
350 China, has continued to force prices upwards despite the added
supply. Mutton prices for the year to date are averaging lower in all
300
states except Western Australia where they are sitting 1.4 per cent
250 higher than 2017. The outlook for mutton prices remains positive
with demand strong and supply low from a historic perspective.
200 Producers will be looking to retain older sheep, which means an
Jan Feb Mar Apr May Jun Jul Aug Sep Oct Nov Dec
improved seasonal outlook would allow producers to hold stock,
5yr ave 2016 2017 2018 tightening supply and boosting prices further.
Data: MLA
11Sheep and lamb prices – state detail
State Type Current Price June 2017 5 year average 80th percentile 20th percentile
21st June
EASTERN STATES TRADE LAMB INDICATOR (C/KG CWT)
ESTLI 712 625 555 616 498
SALEYARD INDICATORS (C/KG CWT)
Vic Restocker 0-18kg 647 705 552 638 475
Light 12-18kg 659 683 539 607 462
Trade 18-22kg 661 681 558 621 492
Heavy 22kg+ 660 659 560 616 504
Merino 16-22kg 620 649 493 567 411
Mutton 18-24kg 518 523 368 430 302
NSW Restocker 0-18kg 539 673 561 654 481
Light 12-18kg 630 645 526 603 446
Trade 18-22kg 651 654 557 617 504
Heavy 22kg+ 656 631 563 622 506
Merino 16-22kg 615 599 502 573 428
Mutton 18-24kg 498 501 362 418 302
SA Restocker 0-18kg 659 490 572 656 485
Light 12-18kg 644 559 517 589 452
Trade 18-22kg 612 568 530 579 488
Heavy 22kg+ 661 607 540 592 489
Merino 16-22kg 642 503 475 535 418
Mutton 18-24kg 398 458 326 381 276
WA Restocker 0-18kg 505 534 465 538 406
Light 12-18kg 608 592 499 572 450
Trade 18-22kg 641 652 516 607 455
Heavy 22kg+ 657 628 509 593 450
Merino 16-22kg 627 615 486 586 417
Mutton 18-24kg 415 423 304 381 236
Tas Restocker 0-18kg 627 688 560 644 483
Light 12-18kg 581 633 531 586 467
Trade 18-22kg 591 625 546 595 500
Heavy 22kg+ 543 616 535 576 492
Mutton 18-24kg 489 542 344 402 282
RETAIL PRICE ($/KG)
Aus Lamb 15.01 14.50 13.83 14.85 12.67
AUSTRALIAN DOLLAR
AUD/USD 0.74 0.76 0.80 0.90 0.75
Data: MLA, Reserve Bank of Australia
12Wool
Wool prices have been setting record highs for most of 2018 with While production is marginally higher in 2017/18, demand for Australian
the Eastern Market Indicator reaching a record high of 2,073c/kg wool is growing at a more rapid rate. The volume of Australian wool
in June, adding further confidence to Australian sheep producers. exports for the financial year to March are trending 5.5 per cent higher
The sustained rise in prices over the last 18 months has been observed than 2016/17. Demand has exceeded supply to the extent that the
to a greater extent for fine wool. The 18 micron price guide in the average export price has increased 15.7 per cent for the financial year
southern wool zone is averaging 16 per cent higher for the financial to date. Increases in both volume and price have led to a 22.5 per cent
year to date compared to 2016/17. Medium and broad wools have rise in the value of wool exports for the year to date, up to $2.9 billion.
also experienced significant rises in price recently with the southern
The outlook for wool prices remains favourable, with very low stocks
price guides for 21 and 28 micron wool averaging 34 per cent and
of wool in the global pipeline and demand for woollen garments
24 per cent higher in the 2017/18 financial year to date, respectively.
expected to continue growing as more people enter the Chinese
Production has been relatively steady in the last few years, after a long middle class and a widening range of products are manufactured with
term downwards trend. At the end of May, wool production for the wool. Economic indicators also favour high wool prices, with high global
financial year was 1.2% higher than 2016/17. Fewer sheep shorn and consumer confidence ratings, and a lower Australian dollar at around
lower average cuts per head are likely to see wool production decline 75 US cents.
in 2018/19.
The eastern market indicator hit a record Fine wool has experienced the best price
2,200
high of 2,027c/kg at the end of May 3,000
gains, recently joined by medium wool
2,000 2,500
1,800
2,000
c/kg clean
c/kg clean
1,600
1,500
1,400
1,000
1,200
500
1,000
800 0
Jan Apr Jul Oct Jan Apr Jul Oct Jan Apr Jul
Jul
Aug
Sep
Oct
Nov
Dec
Jan
Feb
Mar
Apr
May
Jun
16 16 16 16 17 17 17 17 18 18 18
2015/16 2016/17 2017/18 17 micron 21 micron 28 micron
Data: Australian Wool Exchange (AWEX) Data: AWEX
Australian wool production is 1.2 per cent The value of Australian wool exports is
higher than 2016/17 trending 18.9 per cent higher in 2017/18
45 2,500
40
2,000
35
‘000 tonnes greasy
1,500
A$ millions
30
25 1,000
20
500
15
10 0
China Italy India Czech Rest of
Jul
Aug
Sep
Oct
Nov
Dec
Jan
Feb
Mar
Apr
May
Jun
Republic world
5yr ave 2015/16 2016/17 2017/18 2015/16 YTD 2016/17 YTD 2017/18 YTD
Data: Australian Wool Testers Authority Data: GTIS
13In the spotlight – live sheep exports
Live sheep exports are a significant part of the Australian sheep were to be processed locally, state sheep and lamb slaughter would
industry, contributing $249 million, or 7.6 per cent to the combined reach 5.4 million, a 46 per cent increase from 2017. This growth in
sheep industry export value of $3 billion. Australia exported 1.95 supply is not unprecedented, with a 47 per cent increase in slaughter
million live sheep in 2017, representing only 6.1 per cent of Australian recorded in 2013. This corresponded with a decline of 16 per cent in
sheep and lamb offtake for the year. The vast majority of Australia’s the annual weighted average trade lamb and mutton price. Current
live sheep exports leave from Western Australia with 1.7 million sheep bills put to parliament propose a phase out of the trade over five years,
exported in 2017. This accounted for 31 per cent of the state’s sheep meaning a gradual increase in slaughter requirement could occur.
and lamb offtake (slaughter plus live exports) for the year. As a result, History also provides an example of this with slaughter increasing
the outcomes of current proposals to phase out the live sheep export for five years between 2003 and 2008 by 35 per cent, and a
trade would be most strongly felt in Western Australia rather than other corresponding decline in the weighted average price of 21.7 per cent.
exporting states of South Australia and Victoria, where live exports There are many more factors to consider when assessing the effects
accounted for 5.3 and 0.1 per cent of these states’ respective offtake of a phasing out of live sheep exports, but applying these percentage
in 2017. declines to the 2017 weighted average price of 535c/kg would bring
the price down to 419-449c/kg, still above the 80th percentile level.
A loss of the live export trade would require approximately 1.7 million
sheep to find alternative markets in Western Australia. Assuming they
The number of live sheep exported per year from Australia has levelled out at
8 approximately two million after declining from a peak of 6.8 million in 2001
7
6
5
million head
4
3
2
1
0
2011
2010
2016
2000
2001
2003
2004
2005
2006
2007
2008
2009
2012
2013
2014
2015
2017
2002
Kuwait Qatar UAE Oman Jordan Saudi Arabia Bahrain Others
Data: GTIS
The majority of Australian live sheep Western Australia live sheep exports
exports came from WA in 2017 accounted for 31 per cent of the state’s
6 sheep and lamb offtake in 2017
QLD
5
NSW 0.0
0.2%
4
VIC
million head
0.7% 3
SA 2
WA
13.3%
85.8%
1
0
2011
2007
2017
2005
2008
2013
2015
2009
2012
2006
2010
2014
2004
2016
Sheep & lamb slaughter Sheep exported
Data: GTIS Data: GTIS, MLA
14Primary sources:
Australian Bureau of Statistics, 2018, Principal Agricultural Commodities 2016-17, accessed June 2018.
Australian Wool Exchange, 2018, Micron price guides, accessed June 2018.
Australian Wool Testers Authority, 2018, Key Test Data, accessed June 2018.
Bureau of Meteorology, 2018, Australian NDVI standardised anomaly map, accessed June 2018.
Bureau of Meteorology, 2018, Australian rainfall decile map, accessed June 2018.
Bureau of Meteorology, 2018, Australian rainfall outlook map, accessed June 2018.
Bureau of Meteorology, 2018, Australian relative soil moisture map, accessed June 2018.
Global Trade Information Service, 2018, Global Trade Atlas, accessed June 2018.
Meat and Livestock Australia, 2018, Statistics Database, accessed June 2018.
OECD-FAO, 2017, Agricultural Outlook 2017-2026, accessed June 2018.
Reserve Bank of Australia, 2018, Exchange Rates Historical Data, accessed June 2018.
Statistics New Zealand, 2018, Infoshare, accessed June 2018.
United States Department of Agriculture Economic Research Service, 2018, Livestock and Meat International Trade Data, accessed June 2018.
15For report enquiries: AG ANSWERS P 1300 796 101 E ag.answers@ruralbank.com.au For banking enquiries: RURAL BANK P 1300 660 115 W ruralbank.com.au ELDERS P 1300 618 367 E bankmarketing@elders.com.au
You can also read