Economic Update July 2020 - Prepared for members of the Construction Industry Training Board - CITB
←
→
Page content transcription
If your browser does not render page correctly, please read the page content below
SUPPORTING THE SOUTH AUSTRALIAN
                          BUILDING AND CONSTRUCTION
                          INDUSTRY AND WORKFORCE.

Economic Update
July 2020
Prepared for members of the Construction
Industry Training Board.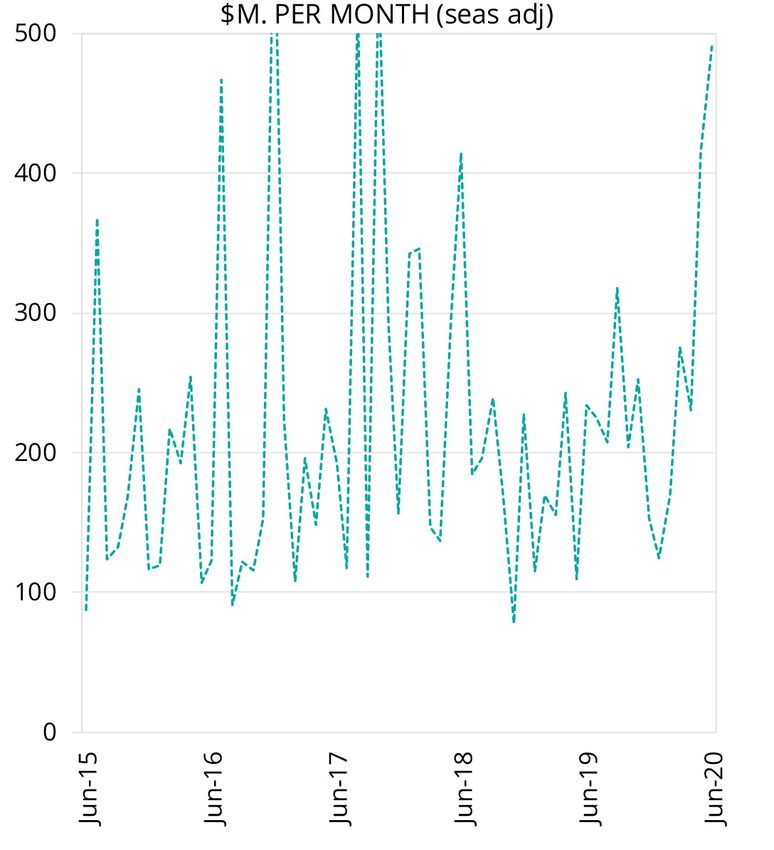
Contents

          				SUMMARY						01

IMPACT ON THE ECONOMY AND		                          Australian Government – Economic and Fiscal Update		   02
ON BUILDING AND CONSTRUCTION OF
COVID-19 — SUMMARY OF REPORTS

BUILDING AND CONSTRUCTION		 Summary of ABS Indicators - South Australia			             04
INDICATORS			               ABS Building Approvals — June 2020				                     05
					ABS Building Activity — March Quarter 2020			07
					                       Construction Work Done and Construction Work
					in the Pipeline — March Quarter 2020				08
				                        Other Commentary on Building and Construction Indicators		 09
						Australian Securities and Investments Commission—
						Companies Entering External Administration
						by Industry					09
						Cordell Construction Monthly — June 2020		09
						ANZ/Property Council Survey —
						September Quarter 2020				10
						Sourceable: Housing Construction Trades
						Remain in Balance					12

EMPLOYMENT AND UNEMPLOYMENT                          ABS Labour Force — June 2020, Cat. No. 6202.0			       13
				                                                 Vacancy Report — June 2020, Australian Government		    14

COMMENTARY ON GENERAL			 ABS Retail Trade — May 2020, ABS Cat. No. 8501.0		                                 15
ECONOMIC CONDITIONS			   CommSec — State of the States, July 2020			                                        15
(VARIOUS ANALYSIS)

Note: See Disclaimer on last page.
These reports will be updated each month, reflecting data and
analysis that was released in that month. Note that this data may
in fact relate to activity some months prior depending on the data
collection methodology and timing.
This report provides commentary on data up to 3 August 2020.
Please refer all queries in respect of this publication to Eric Parnis,
Manager Research, CITB, (08) 8172 9509, email: ericp@citb.org.au
Contact: citb@citb.org.au | (08) 8172 9500
78 Richmond Road, Keswick SA 5035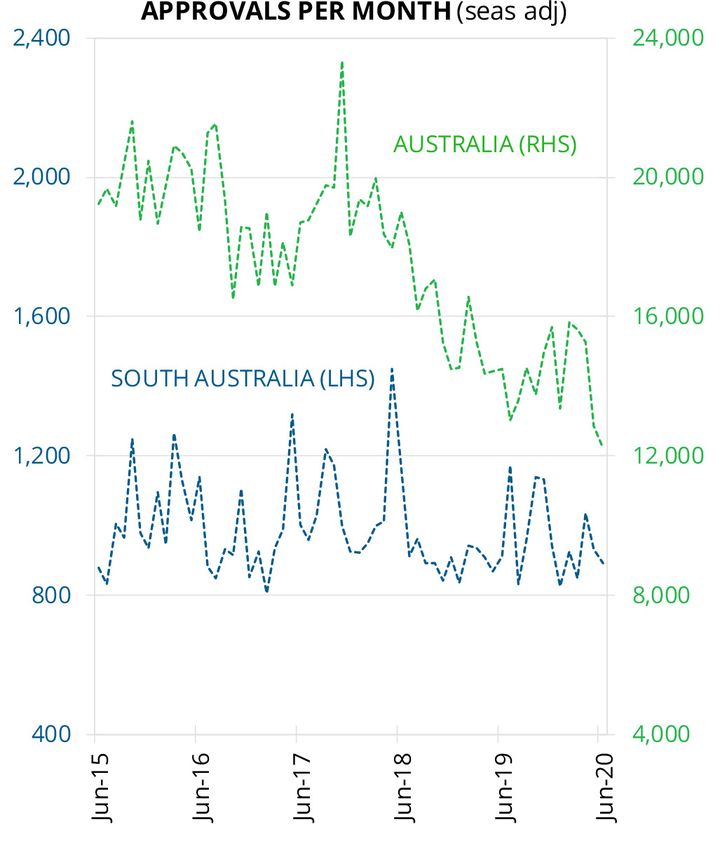
Summary                                                South Australia is ranked 6th overall of all the
                                                       states in economic indicators, according to
The impact of COVID-19 is affecting the                the CommSec State of the State report.
construction sector in a number of ways:
                                                       More positively, non-residential building approvals
1. There has been a noticeable decline in              are holding up in South Australia, and on some
   apprenticeship commencements – see Chart 1          construction indicators, South Australia is
   below. Comparisons for the April-June period        performing noticeably better than other states.
   for the past 5 years show that commencements
   in 2020 are 55% lower than in the equivalent
   period in 2018, with substantial declines across
   all major qualifications.

Chart 1: CITB Supported Apprentice Commencements
— 3 Months to 20 June
700

600

500

400

300

200

100

  0
      2015     2016    2017    2018     2019    2020

2. The construction sector has had among the
    highest take up of the JobKeeper program and
    the program’s scaling back after 30 September
    may provide a challenge to the sector overall.
3. Some of the major drivers of housing
    construction – population growth and job
    security are showing significant stress and will
    negatively impact on construction activity until
    the Home Builder stimulus starts to take effect.
4. Building activity data is only available to the
    first quarter of 2020, before the full impact of
    the pandemic was felt. Even at that stage were
    downward trends in the value of construction
    work done and work in the pipeline.

                                                                                                             1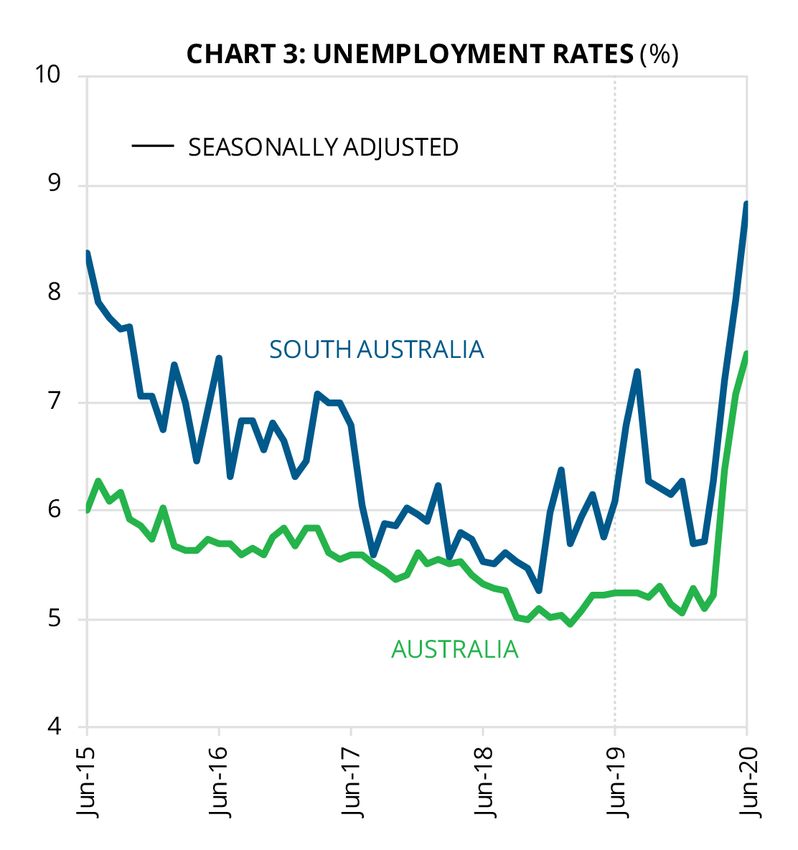
Impact on the Economy and on Building and
Construction of COVID-19 — Summary of Reports
Australian Government, Economic and Fiscal Update 23 June                   COVID-19 cases in Victoria and the corresponding
2020                                                                        measures implemented to contain the outbreak will
                                                                            weigh on activity in that state. The increase in uncertainty
Source: The Hon Josh Frydenberg MP and budget.gov.au
                                                                            about the spread of the virus is also expected to
• Note: this report was published before the COVID-19
                                                                            dampen the recovery in other parts of the country.
  situation in Victoria worsened considerably.
                                                                        •   Australia’s population growth is assumed to remain positive
•   Australia’s underlying cash balance is forecast to decrease
                                                                            but lower over the forecast period. This is mainly due to lower
    from balance in 2018-19 to a $85.8 billion deficit in
                                                                            net overseas migration. The fertility rate is also expected to
    2019-20 and a $184.5 billion deficit in 2020-21.
                                                                            fall due to the weaker economic conditions and outlook.
•   Despite the support to the economy from the measures
                                                                        •   As a result, annual population growth is assumed to slow
    the Government has taken, real Gross Domestic Product in
                                                                            to 1.2 per cent in 2019-20 and to 0.6 per cent in 2020-
    Australia is forecast to have fallen sharply in the June quarter
                                                                            21 — the lowest annual rate of growth since 1916-17.
    by 7 per cent. However, the easing of health restrictions in line
                                                                            Future migration levels remain highly uncertain, due to
    with the health advice is expected to deliver an increase in
                                                                            the path of the pandemic and the nature and duration of
    economic activity from the September quarter and beyond.
                                                                            measures taken to contain its spread at home and abroad.
•   On a calendar-year basis, real GDP is predicted to grow by
                                                                        •   As is the case globally, the evolution of the virus is the
    2½ per cent in 2021, after a fall of 3¾ per cent in 2020.
                                                                            greatest uncertainty for the domestic outlook. Additional
•   There are some positive early signs in the recovery with                significant outbreaks in Australia, or a noticeable worsening
    indicators suggesting that the unwinding of containment                 of existing outbreaks, would lead to a further contraction in
    measures in the latter part of the June quarter has                     economic activity and employment, especially if accompanied
    led to a noticeable recovery in activity and jobs.                      by the reintroduction of containment measures.

•   As a result of the pandemic, around 709,000 jobs                    •   Even if Australia is able to prevent a major regression
    were lost across the country in the June quarter.                       in health outcomes as containment measures are
                                                                            relaxed, further outbreaks in our major trading
•   The unemployment rate is forecast to peak in
                                                                            partners also pose a risk to Australia’s recovery.
    Australia at around 9¼ per cent in the December
    quarter 2020 although labour market conditions                      •   There is also significant uncertainty around the pace and
    are expected to strengthen beyond 2020.                                 shape of the recovery, given the unprecedented nature of
                                                                            this crisis. The economic recovery is forecast to be relatively
•   Even with the current outbreak and reintroduction of
                                                                            fast by historical standards. The economy could recover
    more significant containment measures in Victoria,
                                                                            more quickly than forecast if firms rapidly adjust to the new
    the Australian economy is expected to perform better
                                                                            environment and household spending returns to usual levels.
    than all major advanced economies in 2020.
                                                                        •   However, the recovery could be more protracted if confidence
•   Economic activity is expected to pick up nationally in the
                                                                            remains subdued or more people than expected lose their
    September quarter, by 1½ per cent. Activity in the quarter
                                                                            jobs, including from changes in the structure of the economy
    will be supported by the gradual easing of restrictions
                                                                            or a larger-than-expected wave of business closures.
    around most of the country that began in the latter part
    of the June quarter, which was accompanied by a partial             •   Structural change is a significant source of uncertainty;
    recovery in consumer confidence, a rebound in business                  the health and economic shock has changed many
    confidence and some improvement in the labour market.                   aspects of the way people live, including the way people
                                                                            work, shop and socialise, and it is unclear how large
•   However, the recent increase in locally acquired
                                                                            and persistent some of these changes will be.

2
•   Dwelling investment is forecast to fall by 16 per cent             in the outlook for non-mining investment, which is
    in 2020-21 nationally. The fall in the June quarter is             forecast to fall by 25½ per cent in the June quarter.
    forecast to be 7 per cent, given cancellations and delays
                                                                   •   Real-time data suggest that around three-quarters of
    in residential projects reflecting reduced demand, health
                                                                       firms have been operating under modified conditions as
    restrictions on construction sites and some supply-chain
                                                                       a result of the pandemic, including changed workplace
    disruptions. A further 11 per cent decline in dwelling
                                                                       practices, payment methods, operating hours and
    investment is anticipated in the September quarter.
                                                                       suppliers. Business solvency is also at risk with around
•   The HomeBuilder program is expected to provide a significant       two-thirds of all businesses reporting decreases
    boost to the future pipeline of work, and there are early          in revenue and a number of firms deferring loan
    indications that it has already improved confidence and            repayments and renegotiating lease agreements.
    incentivised some buyers to return to the market. The
                                                                   •   Elevated uncertainty, downgrades to investment intentions
    program is expected to contribute around $1.6 billion
                                                                       and lags between approvals and activity in the construction
    to activity in 2020-21, but total residential construction
                                                                       sector are expected to result in a more gradual recovery
    activity is expected to remain subdued for some time.
                                                                       in business investment than in household consumption.
•   New business investment is forecast to fall by 12½ per
    cent in 2020-21, driven by a significant deterioration

                                                                                                                                     3
Building and Construction Indicators
Summary of ABS indicators
South Australia
Compared to Compared to a
Monthly data Latest month previous month year earlier
Dwelling approvals (Seas. Adj., June 2020) 890 -4.6% -2.4%
• Private houses 648 -2.3% -1.2%
• Private ‘other’ dwellings 182 -10.8% -16.1%
Compared to Compared to a
Quarterly data Latest quarter previous quarter year earlier
Dwelling commencements (Mar qtr 2020, seas. adj.) 2,845 -1.2% 16.7%
Construction work done (Mar qtr 2020, chain vol. seas. adj.) $2.9b 1.1% -8.3%
• Residential $0.9b 1.8% -0.1%
• Non-Residential $0.7b 5.5% 11.9%
• Engineering $1.4b -1.4% -19.7%
Construction work in the pipeline (Mar qtr 2020, original) $6.6b 4.3.% -1.7
• Residential $2.8b -0.5% -1.0%
• Non-Residential $2.3b -11.0% -9.2%
• Engineering $1.6b 53.2% 9.4%
• Construction industry employment (Year to May qtr 2020) 70,898 na -3.5%
SOURCE: ABS DATA, VARIOUS PUBLICATIONS
4ABS Building Approvals – June 2020, Cat. No. 8731.0 dwelling approvals was 16.0% lower than a year ago.
data – Analysis by Department of Treasury and • The number of private sector houses approved
Finance for construction in South Australia fell 2.3% in
Note that monthly seasonally adjusted June and was 1.2% lower than a year ago.
estimates show considerable volatility. • Private ‘other’ dwelling approvals in South
• The total number of dwelling approvals in South Australia fell by 10.8% in June and were 16.1%
Australia in June 2020 was 2.4% lower than a year lower than their level of a year ago.
ago (seasonally adjusted). Nationally, the number of
Compared to a
Monthly data (seasonally adjusted) Latest month year earlier
Dwelling approvals (June 2020) 890 -2.4%
• Private houses 648 -1.2%
• Private ‘other’ dwellings1 182 -16.1%
Non-residential building approvals $490.3m +109.0%
Other’ dwellings includes semi-detached, town houses, units, and multi-storey apartments
1
SOURCE: ABS BUILDING APPROVALS DATA
Table 1: Seasonally Adjusted Dwelling Approvals by State
June 20 v June19
(% change)
NSW -31.7
VIC -11.1
QLD -17.3
SA 2.4
WA -10.1
TAS +3.4
AUS -15.8
SOURCE: ABS BUILDING APPROVALS DATA
5Chart 2: Total Number of Dwelling Approvals per Month • During June, the value of non-residential building
(Seasonally Adjusted) approvals rose by 18% in South Australia
and was up 109% through the year.
SOURCE: CHART REPRODUCED FROM DEPARTMENT OF TREASURY
AND FINANCE, ECONOMIC BRIEFS.
Chart 3: South Australian Non-Residential Buildings
Approved $M per month (seasonally adjusted)
SOURCE: CHART REPRODUCED FROM DEPARTMENT OF TREASURY
AND FINANCE, ECONOMIC BRIEFS.
6ABS Building Activity Australia – March Quarter 2020,
Cat. No. 8752.0 data – Analysis by CITB
QUARTERLY DWELLING UNIT COMMENCEMENTS ('000)
Chart 4: Quarterly Dwelling Unit Commencements
7 70
TREND
SEASONALLY ADJUSTED
6 60
5 50
AUSTRALIA (RHS)
4 40
3 30
2 20
SOUTH AUSTRALIA (LHS)
1 10
Mar-10
Mar-12
Mar-14
Mar-16
Mar-18
Mar-20
SOURCE: ABS DATA
• During the March quarter 2020, the number of dwelling
unit commencements in seasonally adjusted terms fell
by 1.2% in South Australia, but were 16.7% higher than
a year earlier (nationally, dwelling unit commencements
rose 3.8% but were 1.6% lower than a year earlier).
7Construction Work Done and Construction Work in the Pipeline – March Quarter
2020 – Analysis by CITB
Chart 5: Construction Work Done in the Quarter South Australia ($billion, seas. adj.)
4.0
4.0
3.5
3.5
3.0
Total
3.0
2.5
Total
2.5
2.0
Engineering
2.0
1.5 Engineering
1.5
1.0 Residential
1.0
0.5 Residential
Non-Residential
0.5
0.0
Non-Residential
Mar-10
Mar-11
Mar-12
Mar-13
Mar-14
Mar-15
Mar-16
Mar-17
Mar-18
Mar-19
Mar-20
0.0
Mar-10
Mar-11
Mar-12
Mar-13
Mar-14
Mar-15
Mar-16
Mar-17
Mar-18
Mar-19
Mar-20
SOURCE: ABS BUILDING ACTIVITY DATA
Chart 6: Construction Work in the Pipeline South Australia ($billion, original)
12
12
10
10
8
Total
8
6 Total
6 Non-Residential
4 Engineering
Non-Residential
4 Engineering
2
2 Residential
0
Residential
Mar-10
Mar-11
Mar-12
Mar-13
Mar-14
Mar-15
Mar-16
Mar-17
Mar-18
Mar-19
Mar-20
0
Mar-10
Mar-11
Mar-12
Mar-13
Mar-14
Mar-15
Mar-16
Mar-17
Mar-18
Mar-19
Mar-20
SOURCE: ABS BUILDING ACTIVITY DATA
8Other Commentary on Building and Construction
Indicators
Australian Securities and Investments Commission
– Companies Entering External Administration by
Industry
Source: Australian Securities and Investment Commission — ASIC
• The table below summarises the data for construction in South
Australia, by comparing it to all industries in South Australia
and to construction nationally. Insolvencies in construction
in 2018-19 and 2019-20 (YTD) are well below the number in
2013-14. On average, the construction sector makes up around
17% of all insolvencies in South Australia, which is well above
its employment or Gross State Product share (around 8%).
Table 2: Companies Entering External Administration
SA % of Aus
Construction SA All industries SA Construction Aust % of SA total construction
2013-14 64 393 1,802 16.3% 3.6%
2014-15 47 362 1,591 13.0% 3.0%
2015-16 55 386 1,647 14.2% 3.3%
2016-17 39 311 1,509 12.5% 2.6%
2017-18 57 341 1,354 16.7% 4.2%
2018-19 52 347 1,515 15.0% 3.4%
Jul-May YTD 45 265 1,375 17.0% 3.3%
SOURCE: ASIC
Cordell Construction Monthly – June 2020
• The State Government will match Onkaparinga
Council’s $2.65 million funding to complete the Witton
Bluff Base Trail, a 1.37km cycling and walking track
linking Christies Beach and Port Noarlunga, paving
the way for construction to start in December.
• Walkerville Oval is set to undergo an $11.25 million
redevelopment following the release of plans by
Walkerville Council. The redevelopment will include a two
storey building with a gymnasium, bar, change rooms,
function space, grandstand and new netball court.
• Concept plans have been released for a $32 million
redevelopment of Glenunga International High School. The
upgrade will include a new three storey science and technology
building and double court gymnasium building with a two
storey annex accommodating health and physical education
spaces, change rooms, service learning areas and amenities.
9ANZ-Property Council Survey – September Quarter expectations have deteriorated further over recent months as
2020 businesses reassess the long-term outlook for office space.
Source: Property Council of Australia • The national outlook for construction and forward orders,
• The ANZ-Property Council Survey for the September however, are both now positive and improving, clearly
quarter showed a modest improvement in sentiment helped by the HomeBuilder scheme. In a special question
across Australia’s property sectors, although it remains on the Commonwealth Government’s HomeBuilder
deep in negative territory as COVID-19 and the associated program, respondents within the residential sector were
shutdown of economic activity cuts across the economy. broadly positive about the scheme, with 60% reporting
that it would have a positive impact on their business.
• The impact of COVID-19 is immense. Nationwide, almost
all respondents report being negatively hit. Encouragingly, • While the program looks to have had a material impact on the
60% of businesses expect the impact to improve over the outlook for a majority of businesses in the housing sector,
coming quarter. However keep in mind that this survey closed it will not be a panacea for either the residential or overall
on 1 July, before Melbourne’s shutdown was announced. property markets. And with the outlook still challenging, the
economy is likely to need more stimulus in coming months.
• In the residential sector, overall sentiment remains
negative across all states and territories. Price • In commercial property, sentiment remains deeply
expectations fell further into negative territory, while negative across all sectors except industrial, where
the employment outlook remains challenging. confidence is now back in positive territory. Sentiment
in the office sector declined and was broadly flat in the
• The COVID impact has been widespread across states and tourism sector where confidence is the weakest.
sectors, with residential, office, industrial, retail and tourism
sectors all heavily impacted. Not surprisingly, the tourism
sector has been the hardest hit, although office property
Chart 7: The Year Ahead Expectation for Residential
Construction
SOURCE: ANZ-PROPERTY COUNCIL
10• The improvement in construction expectations is likely to • The national average is currently 76, and has increased by 14
take a little while to feed into residential building approvals. points since last quarter. Importantly, South Australia recorded
An improvement over coming months looks likely, although the biggest quarterly increase of all states in the country.
any recovery will be crimped by the drop in overseas
• South Australians are also the most optimistic when it
migration and an extended period of high unemployment.
comes to the future impacts of COVID-19, with 68 per
• Confidence across South Australia’s property cent expecting things to improve over the next three
sector is slowly returning – and it’s happening at a months, in comparison to 60 per cent nationally.
faster rate than every other state in the nation.
• The State Government performance index enjoyed
• Statewide confidence in South Australia sits at 86 for the a significant increase in South Australia, jumping
September 2020 quarter, lifting 26 points since last quarter. from -1.9 percent to 32.3 per cent – giving the State
Government the second highest confidence rating
in the nation, topped only by Western Australia.
Chart 8: ANZ/Property Council Confidence Survey,
September Quarter
SOURCE: THE PROPERTY COUNCIL OF AUSTRALIA
11Sourceable: Housing Construction Trades Remain in oversupply and in the three months to the end of
Balance – Jul8 28, 2020 June they are now in a marginal undersupply.
Source: Sourceable • Demand for skilled trades may have eased due to social
• The supply and demand of tradespeople in distancing requirements on site and households not
residential construction remains in balance despite feeling comfortable inviting trades people into their
the coronavirus, the latest data suggests. homes due to the risk of transmitting COVID-19.
• Releasing its latest report, Housing Industry • On the other hand, anecdotal reports suggest that demand
Association said its HIA Trades Availability Index may have increased due to a rise in small renovation activity.
nationally recorded a level of -0.07 in the June With more people working from home, households found
quarter, down from +0,03 in the March quarter. it easier to schedule a skilled tradesperson to complete
smaller jobs as they did not have to take time off work.
• At this level, trades are considered to be in shortage, but
the level of shortage is considered to be moderate. • There was also a reduction in the supply of skilled trades
as some trades people elected not to work during
• All up: seven of thirteen trades examined are in this period due to the increased risk of contracting
shortage: bricklaying, ceramic tiling, carpentry, the virus or due to the closure of schools.
roofing, plastering, other trades and joinery.
• The adverse impact of the COVID-19 restrictions
• Meanwhile, six trades are in oversupply: electrical, general on new home building would not have been a large
building, landscaping, site preparation, painting and plumbing. factor in June. The impacts on new home building
• Trades were in balance across most locations but were were expected to emerge during the September
in shortage in regional South Australia and regional quarter but these are likely to be alleviated due to the
Western Australia and in oversupply in Perth. Australian Government’s HomeBuilder program.
• In March 2020, skilled trades were in a very minor
12Employment and Unemployment
ABS Labour Force Australia, June 2020 – Cat. No.
6202.0 (analysis from Department of Treasury and
Finance)
• During June, the unemployment rate was 8.8% in South
Australia in seasonally adjusted terms (7.4% nationally).
• South Australia has the highest
unemployment rate of all the states.
Chart 9: Unemployment Rates (%)
SOURCE: CHART REPRODUCED FROM DEPARTMENT OF TREASURY AND
FINANCE, ECONOMIC BRIEFS.
• In seasonally adjusted terms, total employment
in South Australia rose by 11,400 (1.4%) and
rose by 210,800 (1.7%) nationally in June.
• Through the year seasonally adjusted employment growth
was down 4.4% for South Australia and down 4.1% nationally.
• South Australia’s labour force participation rate rose
in June to 61.8% but remains well below its peak.
• Underemployed workers are those who are employed
part-time and who want (and are available for more hours
of work than they currently have. The underemployment
rate in South Australia was 12.3% in June. As a result, the
overall labour force underutilisation rate was 21.1% in June,
up from 15.2% a year earlier (nationally the rate is 19.1%).
13Vacancy Report – June 2020, Australian Government
Department of Employment, Skills, Small and Family
Business
Source: Australian Government
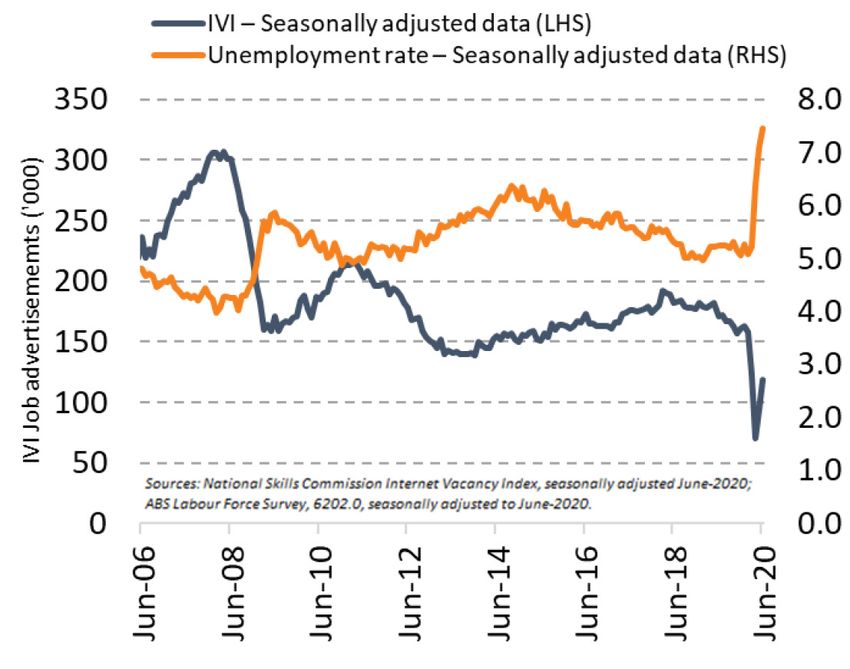
• In seasonally adjusted terms, the Internet Vacancy
Index (IVI) nationally increased by 26.3% (or 24,600
job advertisements) in June 2020. Despite this
increase, job advertisements are 31.0% (or 53,100
advertisements) below the level recorded in June 2019.
• Compared with a year ago, vacancies in
South Australia were down 13.9%.
Chart 10: IVI Change, by State/Territory (%)
Chart 11: IVI Job Advertisements and Unemployment
Rate, Australia
14Commentary on General Economic Conditions
ABS Retail Trade Data – May 2020, ABS Cat. No.
8501.0 (analysis by Department of Treasury and
Finance)
• Due to the impacts of COVID-19 on retail trade,
the ABS has suspended the trend series.
• During May, nominal retail turnover in South
Australia rose by 16% in seasonally adjusted terms
(nationally, nominal retail turnover rose by 17%).
This followed large falls in the previous month.
• Compared with a year earlier, nominal retail turnover was
8.0% higher in South Australia and 5.8% higher nationally
Chart 12: Through Year Growth in Real Retail Turnover –
Seasonally Adjusted
SOURCE: CHART REPRODUCED FROM DEPARTMENT OF TREASURY AND
FINANCE, ECONOMIC BRIEFS.
CommSec – State of the States, July 2020 on relative population growth. But South Australia is ranked
eighth on relative economic growth and seventh on two other
Source: Commonwealth Bank indicators – equipment investment and relative unemployment.
• For the first time since October 2009, Tasmania holds
the mantle of the best performing economy in its own • In terms of construction work, the measure used for
right. Three months ago Tasmania shared top spot analysis was the total real value of residential, commercial
with Victoria. The ACT remains in third spot from NSW and engineering work completed in trend terms in
but both economies have lost ground on the top two. the March quarter. In five of the states and territories,
Queensland is back in fifth spot from South Australia. Then construction work in the March quarter was higher than
follows Western Australia and the Northern Territory. the decade average, up from four in the previous quarter.
• South Australia is now in sixth position on the economic
performance rankings. South Australia is second ranked
15Chart 13: Construction Work Done, Percent Change March Quarter on Decade Average Chart 14: Dwelling starts, percent change March quarter on decade-average SOURCE: COMMSEC, ABS 16
DISCLAIMER

This publication has been produced for general information only
and is not intended to constitute advice. Readers relying on the
content of the publication do so entirely at their own risk.

No warranty (express or implied) is given as to the accuracy or
completeness of information provided. The information may be
true and correct at the date of publication, but this may change
after publication. The CITB is not responsible for providing
updates on such information.

All projections and forecasts are based on assumptions. These
assumptions may not hold true and therefore such projections and
forecasts cannot be relied upon. The CITB is not responsible for
providing updates on such projections and forecasts cannot be
relied upon.

All statements of opinion by the CITB represent the subjective
views of the CITB and the CITB gives no warranty that such
statements are correct. The publication may include statements
of opinion by third parties which do not necessarily reflect the
opinion of the CITB.

All links to third party websites and references to third parties are
included for convenience only and do not constitute endorsement
of the material on those sites, or endorsement of the relevant third
parties and their product or service.

Readers should make their own assessment of all information
provided (including statements of opinion and projections and
forecasts) and consider obtaining independent professional
advice before making any decisions based on such information.

In no event is the CITB (or its trustees, officers, employees or any
related body corporate) liable for any liability, loss, risk or damage
(including incidental or consequential damages) incurred or
suffered (directly or indirectly) out of the use of any information
contained in this publication, whether based on contract, tort or
other legal action.

Copyright in the publication belongs or is licensed to the CITB
and no part of this publication may be used, reproduced or copied
without the CITB’s consent.

                                                                         17
THE FUTURE IS YOURS TO BUILD
You can also read