Burlington Stores Inc. (NYSE:BURL) - Give it a Burl Sally Jiao, Senior Analyst - WestPeak Research ...
←
→
Page content transcription
If your browser does not render page correctly, please read the page content below

Burlington Stores Inc. (NYSE:BURL)
Give it a Burl

Sally Jiao, Senior Analyst
BCom 2023
July 23rd, 2021
Give it a Burl
         Executive Summary
                      Company Analysis                                                          Industry Analysis
                                                                          •   Industry Drivers: The industry caters to customers who are
                                                                              seeking to purchase branded products at significantly lower
                                                                              prices. The business model is therefore driven by (1)
                                                                              economic recessions & downturns and (2) the availability of
                                                                              in-season products from suppliers.
                                                                          •   Market Structure: Overall apparel industry is highly
•   Overview: Burlington Stores is an American off-price retailer             fragmented with many competitors. However, within Off-
    that offers branded apparel, accessories, and home goods at               Price retail, three key players control approximately 90% of
    up to 60% off of their original price.                                    the market share.
•   Strengths: High barriers to entry, strong supplier                    •   Historical/Projected Growth: Off-price retail is projected to
                                                                              increase its market share within the retail industry
    partnerships, and lean inventory management.                              significantly in upcoming years due to the decline of
•   Strategy: BURL’s fiscal 2021 initiatives include: (1) Driving             department stores, accelerated by the COVID0-19 pandemic.
    comparable sales growth; (2) Enhancing retail store base; and             Off-price retail’s CAGR over the next five years is projected to
    (3) Increasing operating margins.                                         be 4.7% versus the retail industry at 3.1%.

                      Investment Theses                                                    Valuation & Target Price
                                                                          •   Discounted Cash Flow analysis, Comparable Companies
          COVID-19 accelerated consolidation within the apparel retail        analysis were conducted to determine the intrinsic share
          industry and shifted consumer demographics. This presents
          off-price retailers with an opportunity to gain market share.
                                                                              price. We also took analyst estimates on the street into
                                                                              account.
          BURL’s real estate strategy will allow it to capitalize on      •   DCF was given a heavier 50% weighting due to the lack of
          macroeconomic trends. This potential is largely being               appropriate competitors within the off-price retail industry as
          overlooked by the market.                                           well as the predictability of future income streams.
                                                                          •   Based on our valuation of $376.92, we recommend a BUY
          With an experienced management with a track record of               rating for BURL at $329.97 with an implied return of 14.5%.
          success, BURL can effectively execute its “Burlington 2.0
          strategy” and drive shareholder value.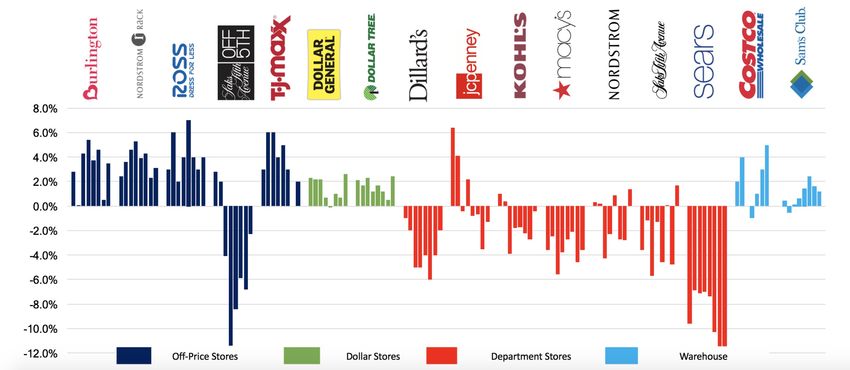
Give it a Burl
                Company Overview
                                                                              Company Highlights

•      Subsector: Off-Price Retail.                                                                              Moderate                                 Other Large Off-
•      Sector: Consumer Discretionary.                                                                        Department Store                             Price Retailers
•      Business & Revenue Model: BURL derives over 99% of its net sales                   Store Size               >=80,000            25000 -32000             30,000
       from stores operated under the “Burlington Store” brand. This is the               (sq.ft.)                                     (2021 Debut)
       only reportable revenue segment as of 2021. The store base is
       geographically diversified with a total of 761 stores located in 45                Product            Broad apparel range w/    Apparel, Baby       Similar to BURL in
       states and Puerto Rico.                                                            Breadth                 more depth             Products,          categories, less
•      Historical Performance: Burlington has demonstrated a strong                                                                     Accessories              depth
       history of growth prior to the pandemic, with a CAGR of 8.6% from                  Brands               Moderate brands,        Premium and          Premium and
       FY13 to FY19. For the past eight quarters, the company has beaten                                         private label        moderate brands      moderate brands
       consensus EPS estimates by USD$0.01 to USD$0.32.
                                                                                          Pricing                 Promotional          EDLP/Off-price       EDLP/Off-Price

                                                                                          Sourcing /          Pre-season sourcing       Substantial in-      Reliance on
                                 Financial Metrics                                        Vendors               strategy, limited
                                                                                                                    flexibility
                                                                                                                                       season liquidity
                                                                                                                                      for opportunistic
                                                                                                                                                              packaway
                                                                                                                                                          merchandise; pre-
    Cumulative Shareholder Return Performance, Assumes Initial Investment of $100                                                           buys           season cuttings

    $500.00                                                                               Customers             Older (45+ years)      Younger (20-39       Younger (20-39
                                                                                                                $78K avg.income            years)               years)
    $400.00
                                                                                                                                      $64K avg. income     $77K avg. income
    $300.00
    $200.00
                                                                                                                      Growth Strategies
    $100.00
                 2016          2017         2018         2019       2020         2021
                                                                                                                                        Leaner inventory in FY21 expected
                                                                                          1         Drive comparable sales growth           to aid opportunistic buys.
               Burlington Stores, Inc.          S&P 500 Index       S&P Retailing Index
    Enterprise Value                  $23.4B      Revenue (FY21E)                 $7.0B   2            Enhance retail store base
                                                                                                                                        Long-term target of 2000; 100 new
    Market Cap                        $19.8B      EBITDA (FY21E)                  $0.9B                                                  stores expected to open in FY21.

    P/E                                32.2x      EBITDA Margin                   13.5%                                                 FY21 margins expected to expand by
                                                                                          3            Increase operating margins
    EV/EBITDA                         -279.7x     Debt / EV                       19.9%                                                         125bps to 43%.

              Source: Investor Presentation; 10K Company Filings
Give it a Burl
               Company Overview
                       Revenue & Margin Analysis                                                           Company Head/Tailwinds
                            Brand Merchandise Assortment                                                           Growth Opportunities
                    Menswear (5%)
                                              Coats (5%)                             •      Recent M&A activities in retail industry encourage off-price
                                                                                            retailers to gain significant market share.
                                                           Women's Ready-to-Wear     •      BURL is a well-established brand within the United States w/ high
             Youth Apparel/Baby                               Apparel (21%)                 customer loyalty, which it can use to drive sales and store counts.
                    (15%)                                                            •      Based on off-price benchmarks, BURL has the potential to
                                                     Accessories and Footwear               drastically increase its profit margin through optimizing footprints.
                            Home (19%)                         (21%)
                                                                                                                        Challenges
                       Historical & Projected Revenue Growth                         •      BURL competes with major, well-known players in the off-price
                                                                                            industry, as well as department stores and online retailers that
         Total Revenue (Thousands)           • Historically, BURL opened 35-45              offer seasonal brand-name merchandise at substantial markdowns.
                                                stores annually.                     •      The popularity of e-commerce as well as its adoption by TJX and
  10000                                      • The store base is due to expand by           ROST, two of BURL’S strongest competitors, may pose significant
   8000                                        100 in FY21 with the new real                challenges to the company’s long-term growth.
   6000                                        estate strategy.
   4000
                                             • We expect 50 new stores to open                              Competitive Advantages
                                               in FY22 before gradually tapering
   2000
                                               off to the conservative estimate of
         0                                     35 stores per year.
             2016 2018 2020 2022 2024 2026

                Historical & Projected EBIT Margins (% of Revenue)                                                       Liquidity for
                                                                                         High Barriers to Entry     Opportunistic Buying
16.00%                                       • EBIT margins in pre-pandemic
                                                                                           Significant capital        Compared to ROST          Strong Supplier
14.00%                                         years had been expanding
12.00%                                                                                    investments, strong         and TJX, which rely          Network
                                               overtime.
10.00%                                                                                   supplier relationships,       primarily on pre-       BURL possesses a
                                             • EBIT margins are projected to
 8.00%
                                               continue this upwards trajectory             and oligopolistic       season cuttings, BURL     strong and diverse
 6.00%                                                                                                                obtains most of its
                                               due to smaller stores and more              industry structure                                  supplier network
 4.00%
                                               efficient inventory management.            create high barriers        inventory through       consisting of many
 2.00%
                                                                                                to entry.            opportunistic buying     branded retailers.
 0.00%
                                                                                                                           practices.
         2016 2018 2020 2022 2024 2026

             Source: Company Filings, Investor Presentation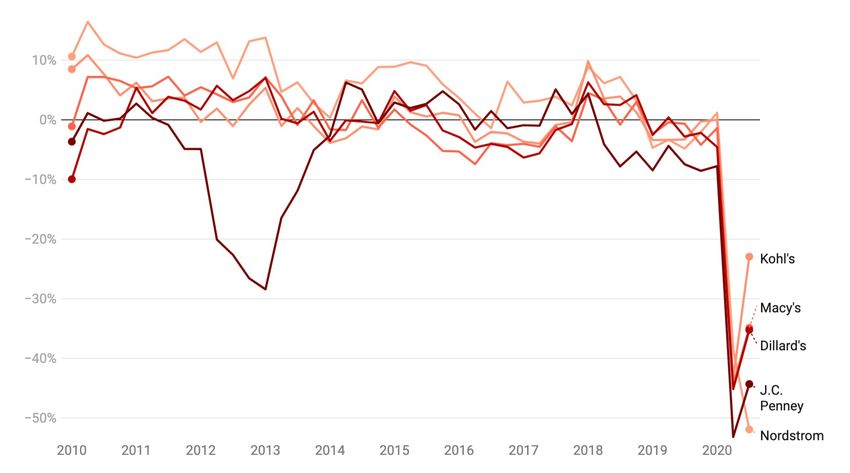
Give it a Burl
Industry Overview
Industry Key Metrics Key Trends
Off-Price Benchmarks Upward Trajectory Expected for Off-Price Retail
• Economic Downturns: The rise in U.S. jobless claims filed in the past
13.5% $42B 4.5% month belies improving labor market conditions. During a downturn,
customers are on the hunt for bargains. The continuous increase in
EBIT Margin U.S. Market Size Comp. Growth U.S. inequality further contributes to this phenomenon.
• Growth of E-Commerce: The rise of fast fashion, e-commerce giants
Market Size YOY Growth – Off-Price Sector V.S. Apparel Retail Industry
such as Amazon and SheIn poses a significant threat to off-price
retail as they attempt to appeal to similar target audiences.
20.00% • During the pandemic, off-price • M&A Activity: Due to COVID-19, many struggling department stores
have engaged in mergers, acquisitions, and in some cases,
0.00% retailers suffered a greater loss
bankruptcy filings. The retail apparel industry as a whole has
-20.00%
due to the difficulties of starting e- undergone significant consolidation, presenting an unique
commerce channels. opportunity for off-line retail to gain market share.
-40.00%
• However, this is not expected to
2016 2017 2018 2019 2020
Apparel Retail Off-Price Retail last as stores re-open.
Competitive Landscape
BURL Consistently Increases Market Share in Off-Price Retail Key Competitors and their Market Share within Off-Price Retail
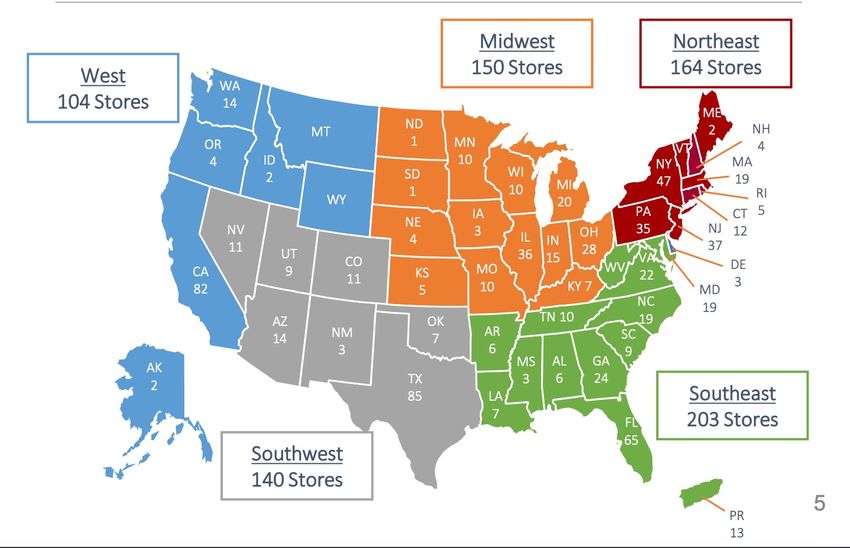
• Structure: The retail apparel industry as a whole is highly
fragmented and competitive. However, the off-price retail sector
is oligopolistic in nature, with 89.4% of the market share being 12.80%
dominated by three key players. 47.00%
• Historical Trends: ROST, TJX, and BURL have dominated the 29.60%
industry for the past five years. Meanwhile, smaller companies,
such as JWN and DBI have seen their market shares dwindle. In
fact, Payless Holdings was driven to file for Chapter 11 Bankruptcy
in 2017 due to the fierce competition. TJX Cos (TJX) Ross (ROST)
• BURL’s Market Share Since 2015, BURL has steadily increased its
market share from 10.4% to 12.8% through offering in-season Burlington (BURL) Nordstrom (JWN)
apparel at lower prices than those of its competitors. Designer Brands (DBI) All Others
Source: Euromonitor, Bloomberg
Give it a Burl – Investment Thesis
            Shifts in Demographics and Industry Dynamics Drive Growth

         On the supply side, COVID-19 has accelerated consolidation within the retail apparel industry…
          2019 Comp Sales Growth                                          Recent M&A Activity                                                 Quarterly Revenue Growth –
                                                                                                                                                  Department Stores

                                                                                          As a result, brands resorted                   Additionally, the share loss from major
Prior to the pandemic, off-price retail                During the pandemic,
                                                                                                to wholesaling their                           department stores present a
had already began stealing market share away                many struggling apparel
                                                                                                Inventory at low prices,                       ripe opportunity for capture by
from large department stores.                        retail stores went under M&A.
                                                                                         benefitting off-price retailers.                 off-price retailers.

           …While on the demand side, it has shifted consumer preferences towards bargain purchases
        Low personal discretionary income..                   …and rising debt among younger generations                      …should continue to drive appeal for off-price
                                                        90%                                                                    US Pop
22000                                                   80%
                                                                                                                             Off-Price
21000                                                   70%
                                                                                                                                         0%     20%       40%        60%     80%        100%
20000                                                   60%
                                                                                                                               Und er 25K     25 - 50K    50 - 75K    75 - 100K      100 - 150K
19000                                                   50%
18000                                                   40%                                                                   US Pop
17000                                                   30%                                                                 Off-Price
                                                        20%
          FEB

          SEP

          FEB
         JUN
          JUL

         NOV
         OCT
         APR

         DEC
         MAR

         AUG
         MAY
          JAN

          JAN

                                                                                                                                         0%     20%       40%        60%     80%        100%
                                                              2003
                                                              2004
                                                              2005
                                                              2006
                                                              2007
                                                              2008
                                                              2009
                                                              2010
                                                              2011
                                                              2012
                                                              2013
                                                              2014
                                                              2015
                                                              2016
                                                              2017
                                                              2018
                                                              2019
                                                              2020                                                               18 to 24                25 to 34                 35 to 44
                        2020                  2021                                                                               45 to 54                55 to 64                 65 or older
                                                                                                                            Demographic of off-price customers vs U.S. population
                                                        U.S. national student debt as % of Gross Domestic Product             : Favors younger generations w/ lower incomes

          Source: Bloomberg, Company Filings, U.S. Census Bureau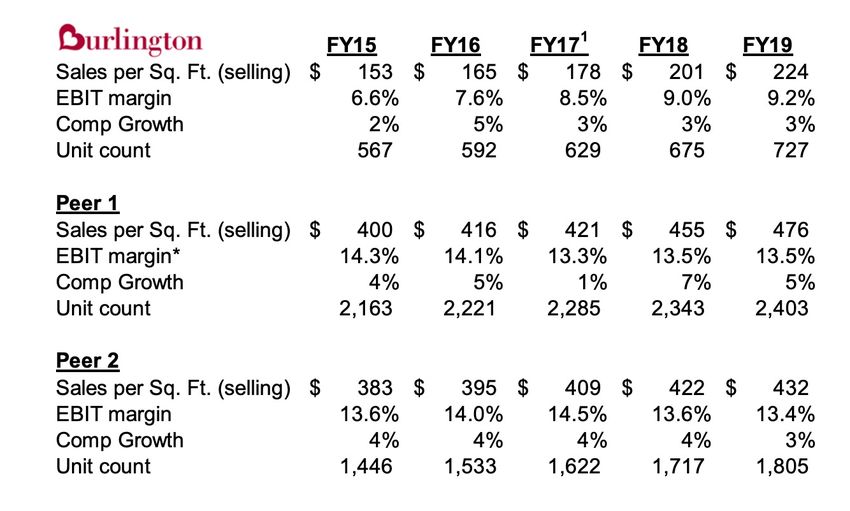
Give it a Burl – Investment Thesis
Real Estate Strategy Implies Significant Economic Benefits
“Burlington 2.0” Strategy capitalizes on new industry tailwinds through aggressive store expansions
Tighter control on liquidity;
1 Chase the sales trend opportunistic buys Management doubled its long-term target of store base
from 1000 to 2000 due to increasing confidence in small
Faster turns, lower markdowns;
2 Higher Just-in-Time Inventory
Fresh receipts to support sales
store prototype
Merchant and planning head count; Gross New Store Openings Year Avg Sq. Ft
3 Invest in buying & planning
Improved training, tools
2017 45000
150
More responsive supply chain; 100
3 More operational flexibility 100 68 76 62 2018 43000
More flexible store staffing model 48
50 30 2019 42000
More productive retail locations;
3 Smaller store prototype 0 2020 40000
Lower occupancy & operating expenses
16
17
18
19
20
E
2021E 32000
21
20
20
20
20
20
20
Smaller stores imply leaner inventory… …and more “Treasure Hunt” experiences
Unit Economics should improve to meet industry benchmarks Case Study – Supermarket Space • Smaller physical stores
Walmart $45.00 allow BURL to better
service the growing
Kroger $40.00 demand for “treasure
Aldi and
Whol e Foods $39.00 Trader’s hunt” experiences
Joe’s bucket through higher inventory
Trader Joe's $36.00 sizes are turnovers.
Albertson $34.00
similar to • Bargains are presented in
stores with a self service shopping
Aldi $34.00 larger environment, and the
formats
Sprouts $32.00
“first come first serve”
sentiment encourages
Lidi $31.00 impulsive buying and
Smaller Size /=/ Smaller Average Bucket Spend per Trip large shopping volumes.
Source: Euromonitor, Investor Presentations, Earnings Call Transcript, Grandview Market Research
Give it a Burl – Investment Thesis
             Strong Balance Sheet and Management Support Ambitious Expansions

              BURL’s current balance sheet should support new store openings and transformations...
       Net Debt/EBITDA has continuously decreased since 2012...                  …While rising EBITDA margins demonstrate strong record of cash generation

4.5                                                                             1000
      3.9
  4                                                                                                                    %
               3.4                                                                                                 1
3.5                                                                                                           R: 1
                                                                                800                        CAG
  3                       2.7    2.7
2.5                                                                             600
  2                                      1.8
                                                1.4                             400
1.5                                                     1.1
                                                                                                                                                        Covid
  1                                                             0.7    0.6
                                                                                200                                                                      Era
0.5
  0                                                                               0
      2012    2013       2014    2015   2016    2017   2018    2019   2020             2012   2013       2014   2015       2016   2017   2018   2019     2020

              …Under a strong leadership team with extensive experience in off-price merchandising

                            Michael O’Sullivan – Chief Executive Officer
                                                                                                                 Fred Hand – Chief Operating Officer
                     •   Joined in September 2019 from Ross Stores (ROST)
                                                                                                     •    Has served as COO since July 2020; previously chief
                     •   At ROST, Michael worked for 16 years as their COO &
                                                                                                          customer officer & executive vice president of stores
                         managed major functional areas such as supply chain,
                                                                                                     •    In previous roles, he drove improvements in
                         finance, IT, and merchandise allocations.
                                                                                                          operating costs for individual stores
                     •   Led company to achieve 18% annual EPS growth rate.

                           Jennifer Vecchio –Chief Merchandising Officer                                        John Crimmins – Chief Financial Officer
                     •   Has been with the company since 2015, but has                               •    Became CFO in October of 2019.
                         served as CMO since April 2019.                                             •    Came to Burlington in 2011 as a Senior Vice President
                     •   Over 20 years of experience in various merchandising                             in Finance & played a key role in improving company
                         positions in ROST and Macy’s                                                     balance sheet.

        Source: Company Website, Investor Presentations, Company Filings
Give it a Burl - Valuation
            Intrinsic Valuation
                                                              Free Cash Flow (mm)
                                                                                                                        Key Assumptions
$1,200.00
                                                                                                 • Revenue: Forecasted based on number of stores and
$1,000.00                                                                                            comparable sales growth. Number of net new stores
                                                                                                     opened is predicted to reach 75 in FY 21, 50 in FY 22,
 $800.00                                                                                             before tapering off to an average of 35 per year.
                                                                                                     Comparable sales growth is expected to remain constant
 $600.00                                                                                             at 2.5% before decreasing to 2% in subsequent years.
                                                                                                 •   EBITDA Margins: Expected to expand with the transition
 $400.00                                                                                             to lean inventory management before stabilizing at
                                                                                                     approx. 17%, ~5% above the industry average
 $200.00                                                                                         •   CAPEX: Forecasted to increase to 30% of net P&E in the
                                                                                                     first three years to account for mass expansion, before
   $0.00
                                                                                                     gradually declining to historical range of 20-25% (in line
             2016   2017   2018   2019   2020   2021   2022    2023   2024   2025     2026           with management expectations)
-$200.00
                                                                                                 •   Exit Multiple: Median EV/EBITDA multiple of peer set.

                       Perpetuity Growth                                                                      Exit Multiple
  Perpetuity Growth Rate                                          2.5%         Terminal EV/EBITDA Multiple                                                15.0 x
   PV sum of unlevered FCF                                     4,668.1          PV sum of unlevered FCF                                                4,668.1
   Terminal value                                             25,247.9          Terminal value                                                       23,010.20
  Enterprise Value                                            29,916.0         Enterprise Value                                                       27,678.3
   Add: Cash                                                   1,530.0          Add: Cash                                                              1,530.0
   Less: Debt                                                  4,850.0          Less: Debt                                                             4,850.0
    Less: Other EV adjustments                                                      Less: Other EV adjustments                                               -
  Equity Value                                                26,596.0         Equity Value                                                             24,358.3
    Shares outstanding                                            66.6              Shares outstanding                                                      66.6
  Implied Share Price                                   $      399.46          Implied Share Price                                               $       365.85
Give it a Burl - Valuation
                  Relative Valuation
                                                                   Comparable Companies

(Figures in mm CAD)                                                              EV/Sales Multiple                             EV/EBITDA Multiple                   Company Fundamentals
                                           Equity     Enterprise    2021A            2022E            2023E          2021A          2023E             2022E       YoY Revenue    EBITDA
Company                           Ticker   Value        Value      EV/Sales         EV/Sales         EV/Sales      EV/EBITDA      EV/EBITDA         EV/EBITDA       Growth       Margins
ROSS STORES INC             ROST           43,625.9     43,915.2         2.4 x             2.2 x           2.1 x        28.4 x           15.1 x          13.9 x        -21.87%       10.89%
TJX COMPANIES INC           TJX            80,473.7     86,535.9         1.8 x             1.8 x           1.7 x        25.9 x           14.0 x          12.9 x        -22.96%        9.35%
FIVE BELOW                  FIVE           11,012.7     11,790.7        4.1 x              3.5 x           3.0 x        22.2 x           22.4 x          18.9 x         6.25%        22.96%
CANADA GOOSE HOLDINGS INC   GOOS            4,817.4      6,108.4         5.5 x             4.6 x           4.0 x        28.9 x           16.3 x          13.0 x         -5.68%       22.30%
LULULEMON ATHLETICA INC     LULU           47,722.7     47,328.1         7.7 x             6.9 x           6.1 x        36.9 x           27.4 x          22.5 x        10.62%        23.58%

BURLINGTON STORES INC       BURL           21,221.1     24,541.1         2.8 x             2.5 x           2.4 x        23.3 x          19.7 x           17.2 x        -20.89%       15.03%

Median                                                                                     3.5 x           3.0 x                        16.3 x           13.9 x         -5.68%       22.30%
Mean                                                                                       3.8 x           3.4 x                        19.0 x           16.2 x         -6.73%       17.82%

High                                                                                       6.9 x           6.1 x                        27.4 x           22.5 x        10.62%        23.58%
Low                                                                                        1.8 x           1.7 x                        14.0 x           12.9 x        -22.96%        9.35%

 •        Comparable companies were chosen based on two main categories: growth and core business. Within the core
          business segment, BURL competes with TJX and ROSS, the two other major players within the off-price retail
          industry. However, given that BURL is expected to exponentially ramp up growth in the next few years through
          aggressive store openings, we believe that GOOS, FIVE, and LULU serve as more appropriate peers due to their
          similar growth and EBITDA margin profiles.

 •        Relative to the core business, BURL is trading at a premium on EV/Sales and EV/EBITDA. However, we believe that
          this is justified given its higher potential for growth and margin expansion (its EBITDA Margin is already
          significantly above both TJX and ROST). We believe that as it continues to grow, it should re-rate to even higher
          multiples in line with the growth group.

              Source:
Give it a Burl - Valuation
Valuation Summary
Valuation Football Field Valuation Methodology
• Intrinsic and relative valuation were weighted 50%
and 25% each, with more emphasis being placed on
Analyst Estimates the former due to the lack of appropriate
competitors within the off-price retail industry.
Exit Multiple • The remaining 25% was composed of price targets
obtained from sell-side coverage of BURL.
Perpetuity Growth
Intrinsic & Relative Valuation
EV/EBITDA DCF Valuation
Perpetuity Growth Implied Price $ 399.46
Exit Multiple Implied Price $ 365.85
EV/Sales
Comps Valuation
Comps - EV/EBITDA Implied Price $ 266.96
$200.00 $250.00 $300.00 $350.00 $400.00 $450.00 $500.00
Comps - EV/Sales Implied Price $ 482.61
Select Price Targets from Sell-Side
Current Target
$365 $380
Recommendation Beth Reed Matthew Boss
$354 $370
Michael Binetti Adrienne Yih
We recommend a BUY rating for Burlington at $329.97 (Jul 23
Close) with a target price of $376.92 and an expected upside of $385 $345
14.5% Kimberly
Simeon Siegel
Greenberger
Consensus Target Price: $366
Source:Give it a Burl
Risks & Catalysts
Catalysts Risks
Future Bankruptcies & Potential Store Locations
• New stores may move into Pier 1 or 1
Modell’s Sporting Goods locations.
High
Both chains filed for Chapter 11
bankruptcy protection in 2020 and 3
are closing all their stores.
Impact
Medium
2
• Future bankruptcies of department
stores could pose more
opportunities for gaining market 4
share within the industry.
Low
Supply Chain Disruptions within Traditional Retail
Low Medium High
• The second wave of COVID-19 could bring about further disruptions
and cancellations in the supply chain for traditional department Likelihood
stores. If the government continues to impose stricter restrictions Dependence on New Openings: New stores may not generate
on social gatherings, inventory will stockpile in department stores. 1 expected profits due to factors such as locational disadvantages.
• Off-price retailers can take advantage through sourcing BURL’s financial position may be adversely affected.
unwanted/oversupplied merchandise at significantly lower prices.
Supplier Relationships: Ability to offer lower-than-average prices
Quarterly Earnings Release 2 & introduce in-season items may be hindered if attractive
branded merchandise cannot be purchased in large quantities.
• New store openings may drive growth that is evident in quarterly
earnings as soon as in the next quarter. Given that BURL has
Increased Competition: Some department stores, mass
historically consistently beaten analysts’ consensus EPS estimates, a
positive earnings release is not unlikely and will likely drive the share 3 merchants, and specialty apparel stores have started to offer off-
price concepts and this trend increases competition for BURL.
price towards the target.
Seasonality: Majority of operating income is typically realized
4 during the second half of the year. Significant amounts of
inventory must be carried before holiday periods.
Source: Company FilingsYou can also read