Results presentation 3 March 2019 - For the 53 weeks ended - Pick n Pay Investor Relations
←
→
Page content transcription
If your browser does not render page correctly, please read the page content below

Results presentation
 For the 53 weeks ended
      3 March 2019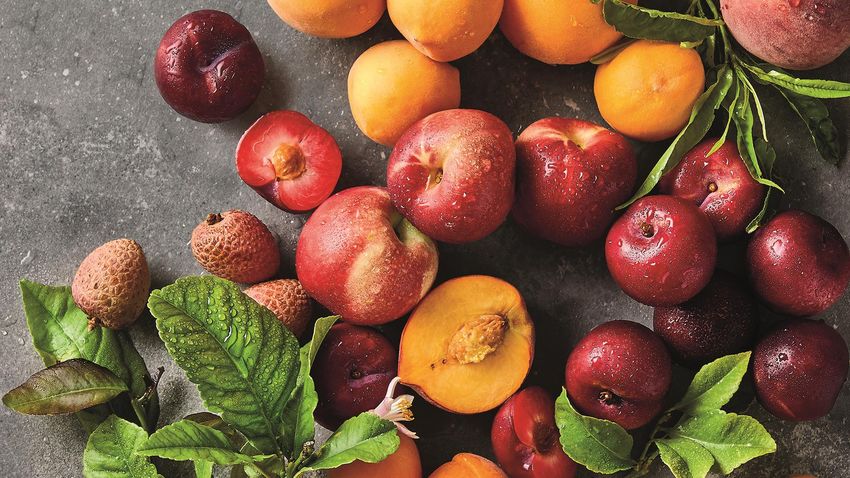
Chairman’s introduction
         Gareth Ackerman | Chairman

         Results overview
Agenda
         Bakar Jakoet | Chief Finance Officer

         Progress on our plan
         Richard Brasher | Chief Executive Officer

                                                     2
Chairman’s
Introduction
Gareth Ackerman
    Chairman
Chairman’s introduction

                                                In FY19 we achieved:

                                                  •   Lower prices

                                                  •   Better reach

                                                  •   More customers

                                                  •   Volume growth

                                                  •   Dividend growth

  Congratulations to the Pick n Pay and Boxer teams for delivering the
          strongest underlying performance in several years              4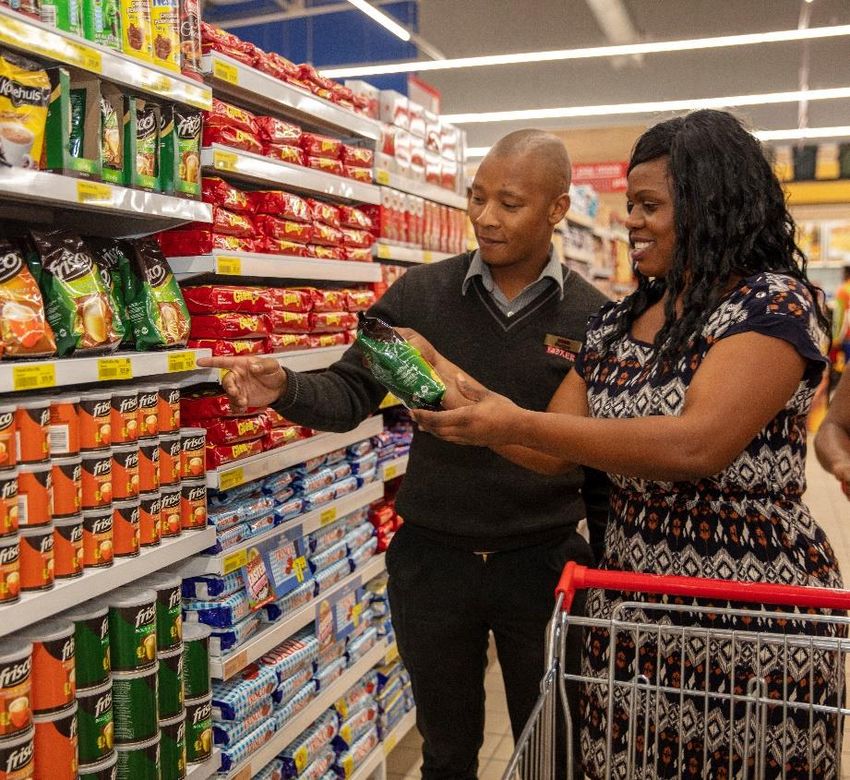
Chairman’s introduction

Sustainable development goals     Our customers still seek great value products
                                  with good service from a caring, ethical
                                  company. But they also look to us for ethical
 What we do aligns most closely   sourcing, environmental sustainability, healthy
 with 7 of the United Nations     product choices, transparent labelling and
 Sustainable Development Goals
                                  more.

                                  Today I’d like to focus on three areas
                                  of our sustainability strategy:

                                  Creating economic opportunity

                                  Alternatives to plastic

                                  Developing our people

                                                                               5
Chairman’s introduction

                                                                  Creating economic opportunity

                                                                  •   Investing in enterprise and
                                                                      supplier development

                                                                  •   Sourcing products locally and
                                                                      from small black-owned and
                                                                      women-owned businesses

                                                                  •   A first-of-its-kind spaza-to-market
                                                                      store conversion programme

Dikeledi Mosime, CEO and owner of Tin-Pac promotional packaging

We partnered with over 100 small businesses in FY19
                                                                                                            6
Chairman’s introduction

                          Alternatives to plastic

                          •   We have taken a number of
                              steps to reduce plastic in the
                              business including several
                              reusable bags and reduction
                              in packaging in our Own
                              Brand products

                          •   Our recycled plastic bags
                              will keep 2,000 tonnes of
                              plastic out of the
                              environment each year

                                                               7
Chairman’s introduction

                                          Developing our people

                                          We support our people through:

                                          •   Creating thousands of jobs

                                          •   Recognising skill and development and
                                              rewarding them with promotions

                                          •   Training and mentoring colleagues

                                          •   Management and leadership
                                              programmes

 We offer over 300 different training programmes to our people, ranging from
  basic literacy and numeracy to management and leadership programmes                 8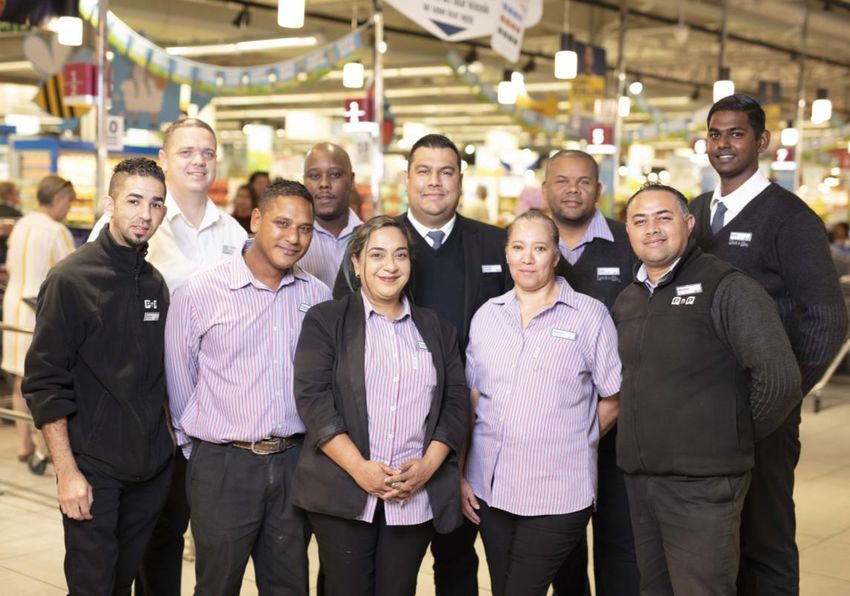
Chairman’s introduction

            OUR BUSINESS IS BUILT ON 3 CORE VALUES

   1                    2                  3
        Consumer            Business           Doing good is
       sovereignty          efficiency         good business

                                                               9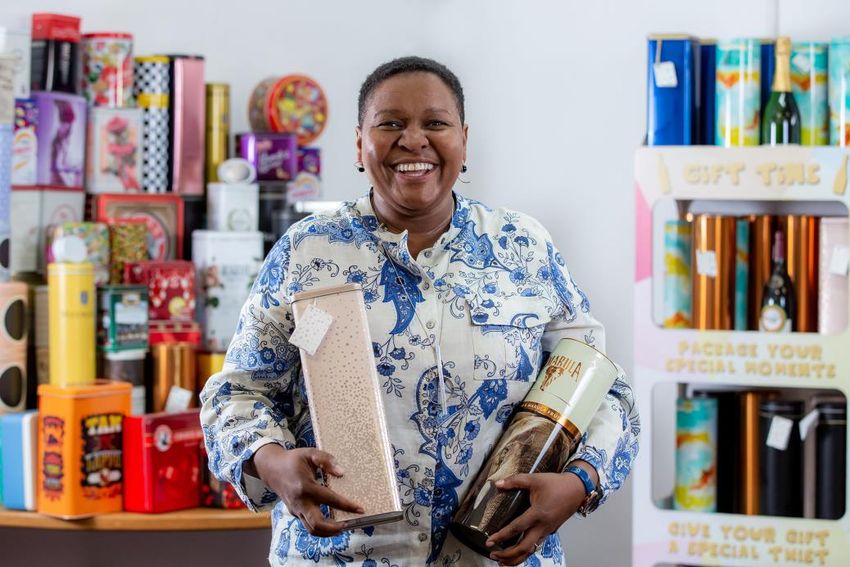
Results overview
     Bakar Jakoet
  Chief Finance Officer
Result overview – 53 weeks
FY19 FY19
53 weeks 52 weeks* The Group follows a 52-week
retail calendar - which requires
the catch-up of an additional
Turnover growth 9.6% 7.1% week every 6 years
2019 is a 53-week period, and
its results are not comparable
PBT growth 24.4% 17.3% with the 52-week 2018
The 53rd week added R2bn to
turnover and a R126.6m to
PBT margin 2.5% 2.4% PBT
Unless stated otherwise, the
presentation that follows is on
HEPS growth 25.2% 18.0% a 52-week basis, providing an
assessment of our comparable
performance
*Please refer to the appendix provided for additional comparable pro forma information 11Strong performance in a tough market
%
Successful execution,
FY19* FY18# change
consistent earnings growth
Turnover R86.3bn R80.5bn 7.1
Gross profit margin 19.0% 18.9% Greater investment in the
customer offer underpinned
Trading profit R2 049.0m R1 819.9m 12.6
by cost discipline and
Trading profit margin 2.4% 2.3% operating efficiency
Profit before tax (PBT) R2 073.2m R1 768.1m 17.3
Volume growth without
PBT margin 2.4% 2.2% margin sacrifice
PBT - South Africa R1 831.9m R1 480.2m 23.8
Solid performance from South
PBT margin – South Africa 2.2% 1.9% Africa division - PBT up
HEPS 326.71 cents 276.98 cents 18.0 23.8%
Diluted HEPS 322.65 cents 271.61 cents 18.8
HEPS up 18.0%
* The 2019 information presented is on a comparable 52-week basis. Please refer to the appendix provided for further detail
Diluted HEPS up 18.8%
#The 2018 information presented is on a restated basis. Please refer to note 12 of the summarised financial statements for
further information
12Long-term plan drives sustained earnings growth
2019 Stronger business, competing
2018
effectively
327.20 326.71 322.65
Earnings growth reflects
substantive improvements in
Cents per share
276.98 customer offer
273.64 271.61
Diluted HEPS reflects the
dilution effect of share options
+ + +
19.6% 18.0% 18.8%
Basic EPS HEPS Diluted HEPS
13Growing shareholder returns
2019 Total dividend up 22.4%
2018
231.10
192.00 188.80 Annual dividend cover of 1.5
155.40 times HEPS maintained for the
full 53 weeks
+ + +
17.1% 23.6% 22.4% The Group has delivered a
compound annual growth in
33.40 39.10 dividends declared of 20%
Interim dividend Final dividend Total dividend over the past 5 years
Total dividends paid over 6 years - R4.6bn
Rm
20%
1 099
833 897
715
565
442
2014 2015 2016 2017 2018 2019
14Volume growth and market share gains
FY19 FY18 Group turnover up 7.1%, with
Turnover growth 7.1% 5.1% LFL sales growth of 4.8% in a
Internal selling price inflation -0.3% 2.2% tough market
Like-for-like turnover growth 4.8% 2.2%
Improved customer offer delivers
Volume growth 5.1% - 5.1% volume growth
Turnover growth from net new space 2.3% 2.9%
Internal selling price deflation of
Net new stores 110 124
0.3%
Customer growth (number of transactions) 4.6% 2.6%
Basket size growth (average transaction value) 2.8% 2.7% Market-leading sales growth of
7.4% in South Africa (LFL 5.2%),
with volume growth of 5.5%
Volume trend Inflation
% Volume growth
7
6
Net new stores added 2.3% to
turnover growth
5
4
3 4.8
2 3.8 3.4
1
0
-1
-2 130 new stores and 20 store
-3
closures
2014 2015 2016 2017 2018 2019
15Competitive with tight margin management
Gross profit margin increased
Group gross profit margin % to 19.0%
More competitive in a tough
Effective
consumer environment
Customer
buying and
investment
distribution
Lower everyday prices, with
fewer and deeper promotions
Price investment supported by
18.9 19.0
• Better buying
• Operating efficiency
• Cost discipline
Improved performances from
company-owned Pick n Pay
and Boxer stores positive for
FY18 FY19 gross profit margin
16Growing value-added financial services platform
FY19 FY18 % Other income up 6.1%
Rm Rm Change
Franchise fee income down
Other trading income 1 889.9 1 782.0 6.1 2.5% with a change in the
Pick n Pay Express franchise
Franchise fee income 389.9 400.1 (2.5) agreement to drive the growth
of this format
Operating lease income 527.8 446.1 18.3
Franchise fee income up 4.5%
Commissions and other income, 972.2 935.8 3.9 on a comparable basis
including value-added services
Growth in operating lease
income driven by strategic
head leases (related rental
expenses included within
occupancy costs)
Strong growth across all
categories of value-added
services, with VAS income up
41.5%
17More effective operations
FY19 FY18 % % LFL Expense growth contained below
Rm Rm change change turnover growth
Trading expenses 16 258.0 15 191.0 7.0 5.3 Labour costs and occupancy
costs up 6.2% and 6.9%
Employee costs 7 102.0 6 688.7 6.2 5.9 respectively driven by growth
across store and distribution
estate
Occupancy 3 299.5 3 086.6 6.9 3.3
LFL labour costs of 5.9% reflect
Operations 3 463.0 3 178.8 8.9 6.1 above inflation increases
Merchandising & LFL occupancy costs up just
administration 2 393.5 2 236.9 7.0 4.9 3.3%, despite high increases in
security and insurance costs
Operations costs reflect a broad
repairs and maintenance
programme and higher
depreciation charges related to
our capital investment
programme
18Improved profit margins
FY19 FY18 EBITDA margin up 0.1%pt to
% % of % of 3.9%
change turnover turnover
Depreciation and amortisation
EBITDA
*
11.1 3.9 3.8 up 10.5%, in line with the
Group’s ongoing capital
EBIT* 11.5 2.5 2.4 investment programme
Leading performance from
Profit before tax Group’s South Africa division
(before capital items) 15.6 2.4 2.2
Net finance costs decreased by
38.5% or R56.6m,
Profit before tax 17.3 2.4 2.2
underpinned by:
• Stronger cash generation
Profit before tax - South Africa • Improved inventory
21.6 2.2 2.0
(before capital items) management
• Lower borrowings over the
Profit before tax - South Africa 23.8 2.2 1.9 year
Tax rate of 25.0%, driven by
Profit after tax 19.9 1.8 1.6
tax impact of share-based
payments
*excluding capital items
19Challenging markets outside South Africa
2019
2018
Revenue up 2.2%, and up
+2.2% 5.3% in constant currency
R4 749.4m terms, with LFL revenue
R4 648.1m growth of 1.5%
Ongoing challenges outside
South Africa, in particular:
• constrained consumer
environment in Zambia
Segmental revenue
-16.2% • economic uncertainty and
R287.9m currency illiquidity in
Number
of stores Zimbabwe
R241.3m
148 Segmental profits down 16.2%
year-on-year, including a
in 2019
decrease in our share of
associate’s profits of 6.3%
Opened 6 new stores - 3 in
Segmental profit*
Eswatini and 3 in Zambia - and
* Segmental profit comprises the segment’s trading result and directly attributable costs only. No allocations closed 2 stores in Namibia
are made for indirect or incremental cost incurred by the South Africa segment relating to this division
20Resilient business in Zimbabwe
FY19 FY18 % The adoption of the newly
Rm Rm change recognised RTGS currency in
October 2018 resulted in a day
Share of TM’s earnings 109.0 116.3 -6.3 one forex loss on translation of
foreign debt of R42.1m
Trading result 151.1 116.3 29.9
Excluding this forex loss TM
Forex loss (42.1) - contributed R151.1m to the
Group’s result, up 29.9% on last
Investment in TM 184.4 365.6 -49.6 year
The Group has recognised its
investment in TM at a rate of 3.3
RTGS to the USD (4.3:1 ZAR)
The foreign currency devaluation
is recognised through equity
reserves
The fair value of TM exceeds its
book value of R184.4 million and
no impairment is required
21Net funding position improved by R0.7bn
Rbn Cash generation and utilisation – FY19 Group generated R1.9bn of
free cash flow over 52 weeks:
(0.2) • Cash from operations of
3.7 R3.7bn up 12% on last year
(0.4) 0.3 (1.5)
• Working capital performance
in line with last year,
notwithstanding impact of
new stores and distribution
centres
1.9 (0.9) • Strong inventory
management with LFL stock
down 10.5% on last year
(0.3)
• Capital investments to
0.7 improve estate of R1.5bn
Cash Working Tax & net Proceeds CAPEX Free cash Dividends Share Net cash
generated capital interest from sale flow purchases inflow Almost R1.0bn paid to
from
operations
of assets
shareholders
22Strong cash generation, lower gearing
53 weeks 52 weeks 52 weeks The 53-week net funding position
FY19 FY19 FY18 reflects the Group’s monthly
Rm Rm Rm payment calendar, with supplier
payments made over month-end
Cash 1 503.2 1 090.3 1 129.1
The Group’s comparable 52-week
Cost-effective overnight net funding position improved by
(1 800.0) (300.0) (1 800.0)
borrowings R665.0m on last year
Strong free cash flow driven by:
Cash and cash equivalents (296.8) 790.3 (670.9)
• Increased profitability
• Improved working capital
1 to 3-month borrowings (1 325.0) (1 325.0) (400.0)
management
Secured borrowings - - (128.8) • Consistent returns on investment
The Group utilises 1 to 3-month
Net funding (1 621.8) (534.7) (1 199.7) debt to take advantage of
competitive interest rates
The Group’s liquidity position
+
remains strong, with R4.3bn
R665m
unutilised borrowing facilities at
year-end
23Continued investment supports growth strategy
FY19 FY18 Capital investment in line with
Rm Rm
growth and refurbishment strategy
Expansion into new stores 476 652
68 new company-owned stores
Improving existing stores 620 673 opened during the year - 42
Pick n Pay and 26 Boxer
Improving the customer experience 1 096 1 325
Broad and impactful refurbishment
Investing in future infrastructure 164 87 programme, touching more stores
in a single year than ever before
Maintaining current infrastructure 213 237
103 stores modernised during the
Total capital investment 1 473 1 649 year
Strong discipline – savings on
capital budgets while delivering
against plan
R2bn planned for FY20
24Progress on our plan
Richard Brasher
Chief Executive OfficerFY19 result snapshot
Group FY19 SA FY19
growth growth
Turnover 7.1% 7.4% • Strong turnover growth, particularly
in South Africa
• Gained market share throughout the
LFL volume 5.1% 5.5% year
• Exceptional value for customers
reflected in price deflation of 0.3%
Profit before
tax* 15.6% 21.6%
• Volume growth of 5.1% (5.5% in SA)
• PBT growth of 15.6% and HEPS
growth of 18.0%
HEPS 18.0% n/a
*Excluding capital items 26
Information presented is on a comparable 52-week basisConsistent execution of our plan has delivered six
years of growth
Group turnover (Rbn) Outperforming the market
Group SA sales growth
+7%
CAGR 86.3
80.5
76.6
71.6
66.2
62.4
57.9
Market sales growth
FY18 FY19
FY13 FY14 FY15 FY16 FY17 FY18 FY19
Source: Nielsen data
Group PBT margin (% T/O) Return on capital employed
+1.2 43%
%pts 2.4 39%
2.2 2.2
2.0
1.8 33% 32%
1.4 30%
1.2
25% 25%
23%
20%
16%
FY13 FY14 FY15 FY16 FY17 FY18 FY19 FY10 FY11 FY12 FY13 FY14 FY15 FY16 FY17 FY18 FY19
We have delivered a HEPS CAGR of 23.7% over the past six years 27Our FY19 result was built on five engines of growth
Value-
SA’s most Africa’s Growth
added Force
trusted favourite across
customer for good
retailer discounter Africa
services
1 2 3 4 5
Doing good is
Pick n Pay Boxer Services Rest of Africa
good business
Great prices, Unbeatable prices Making financial Adaptable model Communities,
better quality and and promotions, and other services designed to grow people and the
more innovation giving customers a seamless part of sustainably in environment are
for customers in the best value in the shopping trip African markets central to our
all segments the industry business
28FY19 Highlights: value for customers
Internal deflation
• Exceptional value for customers was rewarded
with LFL volume growth of 5.1%
+3.4%
• Price reductions on thousands of products,
with a focus on fresh produce and meat
• Fewer, deeper, more effective promotions
• Price investment equivalent to one free
-0.3% weekly shop for customers over the past year
• Performed well over Black Friday and Festive
CPI Food PnP Deflation
season with good growth in sales
South Africa’s most trusted retailer | 29FY19 Highlights: unbeatable quality
• Launched Fresh Promise, guaranteeing the
quality of our produce, butchery and bakery
products across all price points
• Substantially improved fresh meat and produce
offer, rewarded by strong sales growth
• New packaging, improved quality, better
ranges
• Strong collaboration with suppliers on
specifications, ordering and waste management
South Africa’s most trusted retailer | 30FY19 Highlights: own brand innovation
• 500 products launched, including
- meal solutions
- health snacks
- pet food
- diapers
• 700 products re-designed
• Customers responding well with strongest sales
in baking, convenience and health ranges
• Own brand participation is at 21% with plans to
accelerate in FY20
• PnP own brand won 30 first place Sunday Times
awards in 2018
South Africa’s most trusted retailer | 31FY19 Highlights: personalised loyalty
• Voted SA’s best loyalty programme for the 6th year in a
row – Sunday Times Top Brand survey for 2018
• 7.2m active Smart Shoppers
• R6.6bn in personalised discounts offered with a 30%
increase in redemptions
• Launched partnership with BP to award points for fuel –
over 1 million Smart Shoppers have benefited already
• TymeBank customers earn points everywhere and
double points at PnP
• Smart shoppers using their mobile app benefit from
cardless swipe and switch points and save at tills
• New Baby Club and Pet Club launched after very
successful Wine Club: 100,000+ members
South Africa’s most trusted retailer | 32FY19 Highlights: more stores, better stores
FY19 new stores
• Opened 130 new stores across the Group,
including 29 new supermarkets
• Investing in convenience: more Express stores
+62 in partnership with BP
• 45 PnP corporate stores refurbished, e.g. with
+42 new layouts for produce, health and beauty,
+26 general merchandise and liquor
• 31 Boxer stores and 7 Rest of Africa stores
refurbished
• Opened 23 clothing stores and 37 liquor stores
Boxer Corporate Franchise
• Closed 20 underperforming stores
South Africa’s most trusted retailer | 33FY19 Highlights: greater operating efficiency
• Trading expense growth contained at 7% despite
above-inflation increases in rents, rates, electricity
and fuel
• Good cost control in stores
- LFL electricity costs down 1.8% year-on-year and we
use less total electricity today than 10 years ago
- 20% reduction in water usage in WC - learnings being
rolled out nationally
• Progress on Supply Chain centralisation
- Total centralisation up from 65% in FY18 to over 75%
- New KZN DC has 80% grocery centralisation, 70%
fresh and 50% liquor
- A record of 3m cases picked in one week through
Longmeadow
South Africa’s most trusted retailer | 34FY19 Highlights: Boxer
• Customers love Boxer for its unbeatable prices
and promotions and excellent customer service
• Strong double-digit customer growth
• Exceptional performance in Butchery
• Successful investment in Bakery delivered record
growth in FY19
• 60% sales growth on own brand products
• Boxer now has 240 own brand SKUs and 15%
participation
Africa’s favourite discounter | 35FY19 Highlights: Boxer
• Boxer opened 26 new stores, and now has 270
stores
• Three-quarters of the supermarket estate (123
stores) are now in the New Generation format
• Operating costs very well-controlled
• Good management of shrinkage
• Agreed a new 3-year wage deal with the union
• New DC opened in Gauteng in January and Boxer
now has over 40% centralisation in the division
Africa’s favourite discounter | 36FY19 Highlights: greater digital innovation
+40% Value-added services growth in FY19
More money counters, taking the total
+52
to 210
In cash withdrawals processed through
R30bn
our tills – over 75m transactions
550k Money-transfer customers
✓ TymeBank partnership – 250,000
accounts opened
Store account customers. Responsible
✓ In FY20 we will add Hollard Insurance to 125k
approach to granting credit
our portfolio of services
Value-added customer services | 37FY19 Highlights: leading online offer
Exciting new website features • 25% growth in online sales through our
dedicated online DCs
• 90% increase in visitors to our website, over
50% coming from a mobile device
• New features include Your Favourites, shorter
time between order and delivery, one-hour
delivery slots
• Online DCs deliver small and single-pick orders
to Express and Market stores, which more than
doubled in the year
• Click-and-collect sales more than doubled, now
accounting for nearly 10% of order volume
• Smart Shoppers are enjoying our app - 1m
downloads in FY19
Value-added customer services | 38FY19 Highlights: growth outside South Africa
• Despite economic challenges, our African
operations remain resilient
• Segmental revenue grew 2.2%, weighed down by
local currency weakness
REST OF AFRICA
STORE FOOTPRINT • In constant currency terms, revenue grew 5.3%
• 6 new stores opened in the division
Zimbabwe: 57
+3 • Renovated 7 stores in Zimbabwe with 2
Zambia: 20 conversion to Pick n Pay – 20 out of the 57 stores
are now branded PnP
Namibia: 36 • Commenced development on 1 store in Nigeria,
to open in FY20, and plan 2 more
Botswana: 12
• Notwithstanding challenging trading conditions
the division contributed R241m in segmental
+3 profit to the group
Lesotho: 3
Eswatini: 20
Growth across Africa | 39FY19 Highlights: resilient Zimbabwean operation
• Our team has performed magnificently for customers
in a challenging environment
• Despite currency uncertainty and inflation, we kept
our stores stocked and shelves full
• 97% of our supply is sourced locally in Zimbabwe
• We stayed open for customers throughout all the
political disruption
• Strong double-digit volume and customer growth
• To support staff we provided additional increments
for transport, food, loans, leave and once-off
bonuses
Growth across Africa | 40FY19 Highlights: Force for good
Schools Club Food & Clothing donations Reduced plastic waste
Over 3,300 schools supported & R80m in food and clothing 100% recycled plastic bag reduces
nearly 6 million beneficiaries donated in FY19 plastic waste by 2,000 tonnes p.a.
Small businesses Food security People n Planet
Mentored and granted access to 3,000 community & home gardens The new banner under which our
market to >100 small businesses empowering 15,000 families Force for Good work is done
Force for good | 41Looking forward
• Very pleased with what we have done over the past year - testament to our planned approach and
consistent delivery over a number of years
• More to come – we are determined to maintain momentum as we get within sight of our target to
restore a PBT margin at or above 3%
• Our work will continue to be organised around our engines of growth
1 2 3 4 5 6
Boxer -
Pick n Pay - Bearing Value-added Growth Doing good
Africa’s
most trusted down on customer outside is good
favourite
retailer costs services South Africa business
discounter
Have the right Accelerate Ensure costs More reasons Grow Be a good and
offer and the growth to increase at a and more ways sustainably in responsible
right model for establish the lower rate than to shop with other African neighbour in
the different leading limited- sales Pick n Pay and markets every
customers we range Boxer community we
serve discounter in serve
Africa
Looking forward | 42The total market is R900bn & we have a 10% share
Less affluent market Middle market More affluent
75% households 20% households 5% households
& projected 2018-2022
60% spend
Distribution of formal
25% spend 15% spend
grocery spend (%)
growth (R’bn)
+ + +
R50bn R30bn
R110bn
Boxer
Boxer’s unbeatable value combined with Pick n Pay’s range of formats and offer, in Corporate
and with our Franchise partners, position our Group well to serve all customers
Corporate
Franchise
convenience supermarkets hypermarkets online
Looking forward | 43Looking forward: more for less
• More great promotions
• More new PnP and Boxer stores • Lower prices
• More smaller convenient formats • Lower build costs
• More own brand innovation • Lower operating costs
• More innovation in services • Lower stockholding
• More stores in Africa • Lower waste
• More investment in People n Planet
We will make our business even better for our customers,
stakeholders and the communities we serve
Looking forward | 44Thank you Richard Brasher Chief Executive Officer
You can also read