Investor Presentation - H1-FY20| 7 November 2019 - Infratil
←
→
Page content transcription
If your browser does not render page correctly, please read the page content below

Investor Presentation – H1-FY20| 7 November 2019

2. Investor Presentation – H1-FY20 | 7 November 2019

Contents

• FY-20 first half performance

• Market overview

• Generation

• Retail

• Outlook

• Additional information

3.   Investor Presentation – H1-FY20 | 7 November 2019

4. Investor Presentation – H1-FY20 | 7 November 2019

5. Investor Presentation – H1-FY20 | 7 November 2019

6. Investor Presentation – H1-FY20 | 7 November 2019

Investor Presentation – H1-FY20 | 7 November 2019
Market overview
The electricity and telecommunications industries are both dynamic and changing rapidly.
 Market dynamic                                          Trustpower’s position
                                                         Hydro storage will help manage peaks caused by increased intermittent
 Forecast for a material increase in
                                                         generation.
 renewable generation as New
                                                         Trustpower has the capability and capacity to participate in generation
 Zealand de-carbonises.
                                                         development.
                                                         Trustpower’s value led bundled strategy allows it to manage margin squeeze if
 Variable wholesale energy costs.
                                                         prices increase, and loyalty if they decrease.
                                                         Increased ISP system build for the Rugby World Cup will allow for increased
 Increased demand for data.
                                                         demand. Two new international connection points installed this period.
 Global consumer demand for                              Further investment in the bundle with Wireless Broadband and Mobile
 bundled services.                                       creating strategic differentiation from emerging competitors.

8.   Investor Presentation – H1-FY20 | 7 November 2019
9. Investor Presentation – H1-FY20 | 7 November 2019
Generation volumes – 6 months
Generation volumes significantly impacted                                           • Highbank out for three months (43 GWh
by hydrology.                                                                         reduction).
                           Generation volumes (incl KCE)                            • NI inflows down 23% against H1 FY-19 (down 11%
  140
                                                                                      on 10-year averages).
  120
                                                                                    • Volumes down 178 GWh (15%) total vs FY-19
  100
                                                                                      (in line with 10-year averages).
      80
GWh

      60

      40

      20

       0
           April     May           June      July        August         September
                   2019 North Island hydro    2019 South Island hydro
                   2018 North Island hydro    2018 South Island hydro

10. Investor Presentation – H1-FY20 | 7 November 2019
NZ wholesale prices above average
Average wholesale electricity prices Apr - Sept
160
Highbank Outage
140
120
100
Wholesale prices in
$ / MWh
80 FY-20 materially
60
above same period
in FY-19.
40
20
0
Apr May Jun Jul Aug Sep
FY-18 FY-19
11. Investor Presentation – H1-FY20 | 7 November 2019Trustpower storage
Trustpower controlled storage
150
140
130
Trustpower storage
120
has recovered well,
Storage (GWh)
110 creating a strong
100 position to capitalise
on above average
90
wholesale prices.
80
70
60
Jan-18 Apr-18 Jul-18 Oct-18 Jan-19 Apr-19 Jul-19 Oct-19
Total Storage Mean Storage
12. Investor Presentation – H1-FY20 | 7 November 2019Highbank Outage
Trustpower’s diverse Generation portfolio
highlights resiliency during unplanned outage.
• Damage to the guide bearing of Trustpower’s
fourth largest machine, located at Highbank
Power Station, resulted in a three-month forced
outage.
• This was the worst single machine point of failure
across the Trustpower Generation fleet but
demonstrated the resiliency of a diverse
portfolio.
80t rotor
13. Investor Presentation – H1-FY20 | 7 November 2019Highbank Outage
• The outage represented a 43GWh loss during this
time which while significant, represented only
~2% of total annual Trustpower output.
• There were no health and safety incidents during
the 4,750 hour refurbishment period.
Bearing Housing put in place
ready for alignment
14. Investor Presentation – H1-FY20 | 7 November 2019Building capability for the future Asset enhancements are a key strategic priority and help to fill the expected long-term NZ energy gap. Trustpower is implementing a structured generation enhancement programme with a dedicated team focused on increasing Trustpower’s long-run potential value from three main enhancement areas: – Increasing water sources for generation. – Operating our schemes more efficiently. – Adding more capacity and flexibility. • The enhancements team have currently identified opportunities that once commissioned are anticipated to add an additional ~60 GWh per year, with further work ongoing to identify additional areas for value. • Trustpower’s current average annual output is 1,922 GWh per year. The projects include turbine upgrades to provide better efficiency and capacity, generator upgrades to increase capacity and efficiency plus improved water capture and conveyance to maximise generation and reduce spill. 15. Investor Presentation – H1-FY20 | 7 November 2019
16. Investor Presentation – H1-FY20 | 7 November 2019
Bundled strategy continues to add value
  Current Connections                                                                Electricity Only vs Multi-Product Churn
                                                           25%
  Electricity                                266,000

  Gas                                        40,000        20%

  Telco                                      100,000*
                                                           15%
  2+ product customers                       111,000
*NOTE: 100,000 telco customers with ~157,000 connections   10%

                                                           5%

 Consistently >80% of all new customer                     0%
 acquisitions take two or more products.                         Aug-17     Nov-17      Feb-18   May-18      Aug-18      Nov-18     Feb-19   May-19      Aug-19

                                                                          Electricity Only       Dual Fuel            Triple Play      Electricity and Telco

17. Investor Presentation – H1-FY20 | 7 November 2019
Simple digital solutions delivering great outcomes
Cancellations Trustpower vs. Industry
25.0% We beat the industry when
it comes to Fibre
20.0% cancellations by a wide
margin. Our Track and
Trace, a customer centred
15.0%
release on the Trustpower
App, helps our customers
10.0% navigate the complex fibre
connection journey. This
5.0% bespoke feature drives
high levels of customer
satisfaction and makes sure
0.0%
Apr-19 May-19 Jun-19 Jul-19 Aug-19 Sep-19 we retain our customers.
Chorus Trustpower UFF Trustpower Chorus Industry UFF Industry
NOTE: June uplift is related to twelve “ Landlord permission not given “ connections being cancelled
18. Investor Presentation – H1-FY20 | 7 November 2019Simple digital solutions delivering great outcomes
Digital Billing Growth
60%
56%
50% 47%
39%
41% Digital billing has mitigated
5.9 million posted bills
40%
since FY-17.
30%
Good for the planet and
delivering significant cost
20%
efficiencies.
10%
0%
FY 2017 FY 2018 FY 2019 YTD FY 2020
19. Investor Presentation – H1-FY20 | 7 November 2019Customer choice driving significant digital engagement
0 20 40 60 80 100
• Over 1.1 million (72%) of the customer Phone
contacts this year have been handled via
Email
digital channels, with satisfaction ratings on 2020 YTD
par with those enjoyed by our staffed Webchat
channels.
Virtual Agent
• The Trustpower App is now active on more FY 2019
Trustpower App
than 79,000 devices and re-engagement
remains high at 80%. Online account self
service
• There is a significant programme of new FY 2018 SMS Balance
feature releases to ensure the App remains
our customers anytime-online channel of IVR Outages
choice. Chat Bot
FY 2017
Facebook (pm)
20. Investor Presentation – H1-FY20 | 7 November 2019Trustpower is one of the fastest growing Telco's in New Zealand • Over the last five years Trustpower has lifted its telco customer numbers by over 65,000 100,000 Telco (13,000 p/a). • Trustpower is tied fourth equal for broadband Customers market share and has been one of the fastest growing Telco's in New Zealand. • In October we celebrated reaching 100,000 telco customers. • 67% of our customers are now on fibre (up from 52% same time last year). • 93% of our telco customers are now taking medium and fast speed fibre plans (100+MB download). 21. Investor Presentation – H1-FY20 | 7 November 2019
Purposeful investment into our ISP network
We are continuing to strengthen our ISP network to deliver a premium
service to customers. Some of the work we have undertaken over the last
six months includes:
• Forming Strategic partnership with Hawaiki.
• Upgraded Akamai caches to 100G to support additional load on the network
  during the Rugby World Cup.
• Trustpower now owns and operates sites in three countries; NZ, Australia, USA
  with scoping in flight to increase this.
• Over the last six months we have built two sites in the United States (Silicon Valley
  and Portland, Oregon) and added multiple new handovers and points of
  presence, with increased bandwidth productivity to 100G in the South Island.            Trustpower ISP Operations and Delivery
                                                                                          Manager Ginny Buell says that the ISP network
                                                                                          we’ve built is like a highway with a ‘Trustpower
Control over our own network means that our customers                                     customers only’ lane. Trustpower customers are
experience seamless streaming, gaming and browsing.                                       the only ones able to travel on it – meaning no
                                                                                          traffic jams and faster travel times.

22. Investor Presentation – H1-FY20 | 7 November 2019
Additional network capacity improves customer experience The additional capacity to support the anticipated load on the network during the Rugby World Cup was successful - providing a fast, high quality internet and customer experience during peak traffic times. We now have a platform that we can leverage for growth which will deliver benefits beyond FY-20 and ensures that we can continue to provide high quality and high-speed internet, particularly for gaming platforms and new streaming services such as Disney+ and Apple TV Plus. These heavy-demand loads used less than 50% of our network capacity. 23. Investor Presentation – H1-FY20 | 7 November 2019
Trustpower ISP outperforms
Trustpower’s ISP has ranked 1st on the Netflix speed index for 19 of
the last 22 months, including the last eight consecutive months.
                                                               Netflix ISP Leaderboard scores
       4.4

       4.3                                                                                                                                          Trustpower’s continued
       4.2                                                                                                                                          investment in ISP
       4.1                                                                                                                                          is evident in our
                                                                                                                                                    performance, and provides
Mbps

       4.0

       3.9                                                                                                                                          a solid platform for further
       3.8                                                                                                                                          growth and opportunities.
       3.7

       3.6
             May-17    Aug-17         Nov-17          Feb-18         May-18         Aug-18         Nov-18         Feb-19          May-19   Aug-19
                                                        Trustpower         Spark (best speed)       Vodafone NZ

NOTE: Since October 2018, the Spark line is measuring only their Fibre speeds, Trustpower is weighted average of fibre and DSL.
Source: https://ispspeedindex.netflix.com

24. Investor Presentation – H1-FY20 | 7 November 2019
AIMing high - Leveraging our ISP network to benefit the community • We continue to build partnerships in the communities we operate in to achieve shared value. • In September we provided streaming services for the Anchor Aims Games production company, enabling the games to be streamed internationally. • We also leveraged our network to provide free public wi-fi across 13 sites, available to the 11,500 participants and their supporters across the weeklong event. 25. Investor Presentation – H1-FY20 | 7 November 2019
Growth ambitions in retail continue
• Trustpower launched Wireless Broadband
  offerings in market in August.
• Mobile offering coming soon.
• Our smart metering deployment
  programme continues with >30,000 meters
  deployed so far.

26. Investor Presentation – H1-FY20 | 7 November 2019
Investor Presentation – H1-FY20 | 7 November 2019
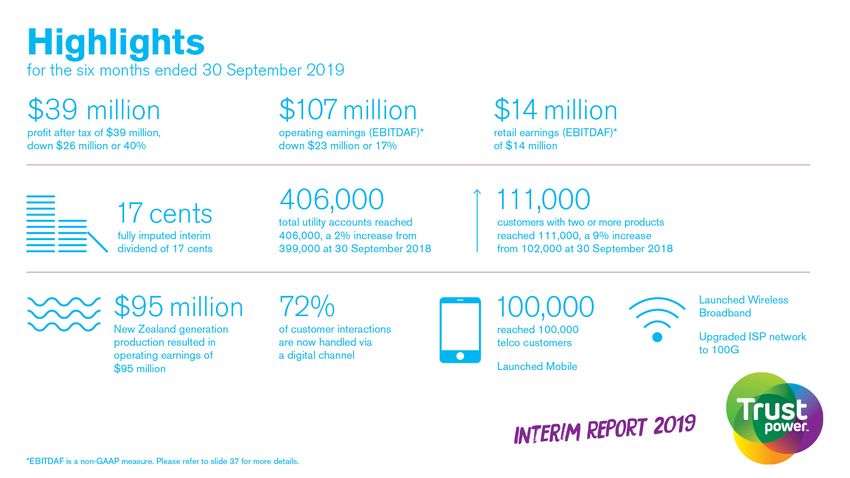
Financial performance comparison
• The first half of FY-20 was impacted by lower generation volumes and higher generation operating costs, reflective of
  plant outages and materially lower inflows.
• Continued investment into capability and customer acquisition and service also weighed on the result.

NOTE: Telco normalisation relates to a large telco cost of sale accrual released September 2018 that related to prior periods.
*EBITDAF is a non-GAAP measure. Please refer to slide 37 for more details.

28. Investor Presentation – H1-FY20 | 7 November 2019
Retail performance comparison
                                         Accounting
                                         adjustments

                                                                                   Timing of transfer    Continued
                                                                                     price increases    investment

NOTE: *EBITDAF is a non-GAAP measure. Please refer to slide 37 for more details.

29. Investor Presentation – H1-FY20 | 7 November 2019
Debt capital management & dividend
Funding sources ($M) Facility utilisation and maturity
$135m
400
$200m
300
$M
200
$436m 100
-
0-1 1-3 3-5 5-7 7+
Bank Senior Bonds Unutilised Bank
Bank Senior Bonds Unutilised Bank
Interim dividend declared of 17cps – fully imputed.
All ordinary dividends are expected to be fully imputed from now onwards.
30. Investor Presentation – H1-FY20 | 7 November 2019Outlook
Trustpower is well positioned for the
Trustpower has previously indicated it expects FY-20
second half of FY-20 due to:
EBITDAF* guidance to be at the bottom end of its
• Current levels of water storage.
guidance range ($205m - $225m). Trustpower confirms
• Forecast firm prices. that it expects its FY-20 EBITDAF to be in the range
• Completion of Highbank outage. $200m - $215m), assuming currently observable pricing
• Growing bundled customer numbers. and expected hydrology.
We believe we have built and continue to
build a robust, agile business that has the
capability to capitalise on opportunities. We
are committed to investing today, to deliver
sustainable and solid future value tomorrow.
NOTE: *EBITDAF is a non-GAAP measure. Please refer to slide 37 for more details.
31. Investor Presentation – H1-FY20 | 7 November 201932. Investor Presentation – H1-FY20 | 7 November 2019
Trustpower key facts
• Tauranga based national electricity generator and retailer of energy and telco.

• History dates back to 1915 as the Tauranga Electric Power Board.

• Market capitalisation circa ~$2.6B

• Key Shareholders Infratil (51%) and TECT (26.8%).

• NZ generation capacity (hydro) of 487 MW producing an average of ~1,922
   GWh per annum.

• 111,000 customers have more than one product.

• Approximately 800 FTE employees.

33. Investor Presentation – H1-FY20 | 7 November 2019
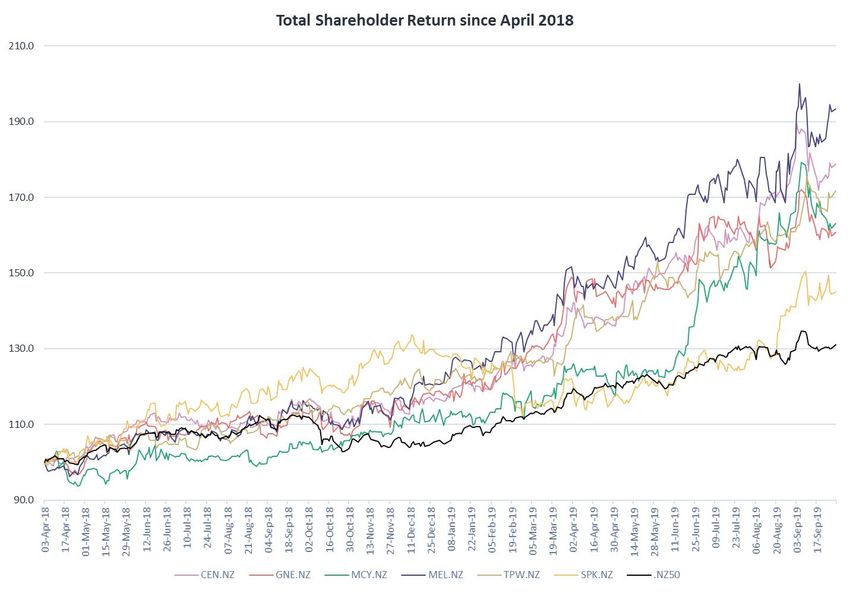
Trustpower adds shareholder value

34. Investor Presentation – H1-FY20 | 7 November 2019
Netback
                                                                               FPVV Netback
          160

          140

          120

          100
  $/MWh

           80

           60

           40

           20

           -
                        2015                            2016                              2017                     2018   2019

                                                               Total Netback       Excluding CTA   ASX benchmark

35. Investor Presentation – H1-FY20 | 7 November 2019
Value-led bundles provide superior value
Customer persistence Value-led retail bundles demonstrate higher
customer value than non-bundled, or price-led
100%
90%
80%
campaigns:
• Better customer retention.
Customers remaining
70%
60% • Higher average electricity volumes.
50%
• Higher-value telco plans.
40%
• Better sales conversion and leakage.
30%
20%
10%
0%
1 2 3 4 5 6 7 8 9 10 11
Years since acquisition
Price-led bundle Value-led bundle Electricity only
36. Investor Presentation – H1-FY20 | 7 November 2019Non-GAAP measures
• Underlying Earnings is a non GAAP (Generally Accepted Accounting Principles) financial measure. Trustpower believes that this measure is an important additional financial
measure to disclose as it excludes movements in the fair value of financial instruments which can be volatile year to year depending on movement in long term interest rate and
or electricity future prices. Also excluded in this measure are items considered to be one off and not related to core business such as changes to the company tax rate or
impairment of generation assets.
• EBITDAF is a non GAAP financial measure but is commonly used within the electricity industry as a measure of performance as it shows the level of earnings before impact of
gearing levels and non-cash charges such as depreciation and amortisation. Market analysts use the measure as an input into company valuation and valuation metrics used to
assess relative value and performance of companies across the sector. The EBITDAF shown in the financial statements excludes the Australian business which is a discontinued
operation.
• Reconciliation between statutory measures of profit and the two measures above, as well as EBITDAF per the financial statements and total EBITDAF, are given below:
2019 2018
Profit after tax 38,678 64,869
Fair value losses on financial instruments 12,249 1,033
Impairment of assets 2,381 291
Changes in income tax expense in relation to adjustments (4,096) (371)
Underlying earnings after tax 49,212 65,822
Operating profit 72,705 103,420
Impairment of assets 2,381 291
Fair value losses on financial instruments 12,249 1,033
Amortisation of intangible assets 4,984 7,821
Depreciation 14,784 17,078
EBITDAF 107,103 129,643
37. Investor Presentation – H1-FY20 | 7 November 2019Disclaimer While all reasonable care has been taken in the preparation of this presentation, Trustpower Limited and its related entities, directors, officers and employees (collectively "Trustpower") do not accept, and expressly disclaim, any liability whatsoever (including for negligence) for any loss howsoever arising from any use of this presentation or its contents. No representation or warranty, expressed or implied, is made as to the accuracy, completeness or thoroughness of the content of the information. All information included in this presentation is provided as at the date of this presentation. Except as required by law or NZX listing rules, Trustpower is not obliged to update this presentation after its release, even if things change materially. The reader should consult with its own legal, tax, investment or accounting advisers as to the accuracy and application of the information contained herein and should conduct its own due diligence and other enquiries in relation to such information. The information in this presentation has not been independently verified by Trustpower. Some of the information set out in the presentation relates to future matters, that are subject to a number of risks and uncertainties (many of which are beyond the control of Trustpower), which may cause the actual results, performance or achievements of Trustpower or the Trustpower Group to be materially different from the future results set out in the presentation. The inclusion of forward-looking information should not be regarded as a representation or warranty by Trustpower or any other person that those forward- looking statements will be achieved or that the assumptions underlying any forward-looking statements will in fact be correct. This presentation may contain a number of non-GAAP financial measures. Because they are not defined by GAAP or IFRS, they should not be considered in isolation from, or construed as an alternative to, other financial measures determined in accordance with GAAP. Although Trustpower believes they provide useful information in measuring the financial performance of the Trustpower Group, readers are cautioned not to place undue reliance on any non-GAAP financial measures. This presentation is for general information purposes only and does not constitute investment advice or an offer, inducement, invitation or recommendation in respect of Trustpower securities. The reader should note that, in providing this presentation, Trustpower has not considered the objectives, financial position or needs of the reader. The reader should obtain and rely on its own professional advice from its legal, tax, investment, accounting and other professional advisers in respect of the reader’s objectives, financial position or needs. 38. Investor Presentation – H1-FY20 | 7 November 2019
You can also read