Executive Compensation: The Good, the Bad and the Ugly
←
→
Page content transcription
If your browser does not render page correctly, please read the page content below
Executive Compensation: The Good, the Bad and the Ugly

Summary

The US E&P sector has rebounded strongly from its 2020 lows, driven by the move of WTI prices above
$70/bbl and the promise of a new business model. However, the combination of higher commodity
prices and a rising rig count has sparked a debate over whether the vows of capital discipline taken by
CEOs at the depths of the crisis will hold. Are we truly charting a new course forward for the sector, or
will this be a repeat of the 2016-2018 cycle when misplaced growth ambitions drove a collapse in
valuation multiples? From our perspective, the fate of the industry hinges on whether Boards can
successfully align executive compensation with the new E&P business model. As Charlie Munger once
said, “show me the incentive and I’ll show you the outcome.” With that directive in mind, we thought it
made sense to review company 2021 proxy statements and assess the degree to which Boards have
addressed the deficiencies we highlighted in our original white paper on governance, “Bringing
Alignment and Accountability to the E&P Sector.”

Our conclusion is that the progress over the past year has been too incremental relative to the scale of
shareholder value destruction over the past decade. While we are encouraged by the significant shift
away from production metrics within short-term incentives, the evolution of long-term incentives has
been far more measured. The percentage of time-based compensation remains too high, while the
performance-based component is still largely tied to relative total shareholder return (TSR) within a
narrow peer group. Furthermore, the pandemic once again exposed the unwillingness of Boards to hold
management teams accountable, even after a protracted period of shareholder value destruction. As we
highlight in the paper, total CEO compensation in 2020 was only 1% lower than 2018 despite a 60%
decline in share prices over the same period. If we truly want to end the pro-cyclical behavior that has
historically plagued the industry, commodity prices can no longer serve as both a tailwind and scapegoat
for rewarding executives.

The goal of this paper is to help ensure that that the progress made over the past year is viewed as a
starting point for further engagement between investors and Boards. Investors should applaud those
who are willing to make more meaningful changes to their compensation plans and hold the laggards
accountable. Higher commodity prices may temporarily alleviate some of the investor pressure on
reforming governance, but it is important to remember that this is a highly cyclical industry destined to
repeat the mistakes of the past if the underlying issues around alignment and accountability are not
properly addressed.

A Failed Business Model

Over the past decade the E&P industry prioritized growth over returns. It continued to reinvest at
excessively high rates despite the inability to cover its cost of capital. In theory, companies were
attempting to maximize Net Asset Value, but the strategy failed to account for the underlying cyclicality
of commodity prices or the continued deferral of free cash flow in an environment where investors are
increasingly concerned about the transition away from fossil fuels. Even as investors abandoned the
sector and valuation multiples collapsed, the industry remained committed to a failed business model.
Why did the value destructive behavior persist for so long? Why did it take a global pandemic and
negative oil prices to finally see a commitment to a new model? From our perspective, the answer lies in

                                                                                                            1
the misalignment of incentives. We previously identified three key deficiencies in the governance of
public E&P companies:
1. Asymmetry Between Success and Failure
A lack of downside risk to job security or compensation results in a pro-cyclical bias and
excessive risk-taking. The industry has not only found a way to get paid for the beta in a rising
commodity price environment, but it is also able to use it as an excuse when prices fall. That
asymmetry materializes in consistent payouts over 100% of target bonuses, large cash payouts
into bankruptcy, low dismissal rates for CEOs and discretionary adjustments to compensation
plans when the macro environment deteriorates. We have called for greater accountability at
the Board level, so executives operate with a clear sense of downside risk. Given that 2020
might have been the ultimate downside scenario it provides a real-time look at how willing
Boards were to hold management teams accountable.
2. Low Insider Ownership
Low levels of insider ownership result in an agency problem between shareholders and
management. Given the separation of ownership and control, compensation plans must
motivate managers to internalize the wealth effects of their decisions. Kimmeridge believes that
long-term incentives at the CEO level should be 100% performance-based, while change of
control payouts should be restructured to promote alignment with shareholders.
3. Reliance on Relative TSR with a Narrow Peer Group
Investors often criticize the herd mentality within the E&P industry. We attribute it to the
disproportionate reliance on relative TSR where most executives can receive 100% of their
target long-term incentives for median performance. Executives continually evolve their
strategy to ensure they look similar enough to peers and chase what is currently rewarded by
the market. This is often at the expense of pursuing a strategy that would be in the best interest
of their long-term shareholders. That is why investors are paranoid about what will happen if
the market begins to reward production growth again. We have advocated for incorporating
financial metrics such as cumulative free cash flow and return-based metrics within long-term
incentives. Incentives should be tied to successful execution of the corporate strategy, rather
than simply the outcome of relative share price performance. Additionally, when relative TSR is
utilized, companies should broaden out the peer group so that it is representative of the
opportunity set across the sector using indices. Finally, we have advocated for a matrix
approach to the intersection of relative and absolute performance so that the penalty for
negative returns goes beyond capping payouts at 100% of target.
To address these three deficiencies and promote greater alignment and accountability, Kimmeridge
proposed the following principles for reforming executive compensation:
1. Eliminate growth metrics and discretion from short-term incentives
2. 100% performance-based long-term incentives that are only settled in shares
3. Deemphasize relative TSR for absolute TSR and long-term financial metrics
24. Increase change of control payouts with improved shareholder alignment
What follows is our assessment of Boards’ willingness to hold management teams accountable in 2020
and embrace these principles in establishing their 2021 compensation plans. For this analysis we
reviewed the disclosures in the Proxy Statements for 27 public US E&P companies (“US E&P
Companies”) and highlight examples of companies which we believe made industry-leading progress
within their compensation plans.
Accountability
2020 was the ultimate test in Board accountability. The exceptional volatility in both commodity and
share prices forced Boards to react real-time. It became clear which Boards were willing to hold
management teams accountable and which were focused on ensuring their executives were still
rewarded as their share prices collapsed. Maybe it was the severity of the crisis or the heightened
scrutiny on the issue, but we did finally see most annual bonuses paid below target in 2020.
Figure 1: Short-Term Incentive Payout as a Percentage of Target (2020)
Source: Proxy Statements1
However the median payout of 95% still seems unjustifiably high for what transpired last year when the
median share price return was -36%. And there was significant clustering around a 90% payout of target
for stocks that were down between 20-67%:
1
Short-Term Incentive (STI) payout relative to 100% target for 25 of the 27 US E&P Companies. Excludes OAS and WLL, which declared
bankruptcy in 2020.
3Figure 2: Short-Term Incentive Payout Relative to TSR (2020)
Source: Proxy Statements and Bloomberg2
Overall, we saw a median decline in total CEO compensation of 14% compared to 2019, but that still
only represents a 1% decline from 2018 levels. During that three-year period, those same companies
had a TSR of -60%.3
And while the bonus payouts in 2020 may seem less egregious now given the recovery in share prices
since last November, it is important to note that Boards actively changed compensation plans at the
depths of the crisis once it became clear that companies would miss their operational and financial
targets. Some Boards instituted a corresponding cap on the payout of adjusted metrics, while some
allowed their executives to enjoy elevated payouts even after moving the goal post. Here are examples
of the different approaches that Boards took:
Matador: Zero cash bonuses to any named executives in 2020; total CEO pay -79%
Murphy: No changes to STI metrics and only paid out 36% of target bonus
Devon: Updated goals in March 2020 but negative discretion reduced payout from 153% to 75%
Hess: Adjusted STI targets and weightings in June 2020 but capped payout at 50% of target
Pioneer: Adjusted STI goals but reduced maximum score by 50%; payout was 75% of target
Apache: Introduced new STI metrics for 2H2020 with no cap and paid out 137% of target
2
Short-Term Incentive (“STI”) payout relative to 100% target for 25 of the 27 US E&P Companies. Excludes OAS and WLL, which declared
bankruptcy in 2020.
3
Median change in compensation calculated for 19 of the 27 US E&P Companies which maintained the same CEO from 2018-2020. Cumulative
three-year TSR calculated on Bloomberg from 1/1/18 to 12/31/20.
4Callon: Introduced a new incentive program in September 2020 that would allow executives to
receive quarterly cash awards from a pool equal to 2.5% of free cash flow for six quarters through
2021 up to $6M
While some may be sympathetic to the argument that executives could no longer deliver on their
original targets as the pricing environment deteriorated, we have yet to witness the reciprocal. When oil
prices rise more than expected and targets are easier to achieve, Boards never seem to raise the bar to
mitigate the payout. This is the asymmetry we have consistently highlighted as the underlying flaw in
compensation for the industry.
The crisis also exposed the fallacy that Boards foster alignment between shareholders and executives
through long-term, stock-based incentives. Any criticism of executive compensation plans often
engenders a response around the need to look at realized compensation versus grant date value. The
argument is that even if a CEO is paid 100% of the grant value for their long-term incentives (LTI), the
realized value goes up and down with the share price. The issue, however, is that as the stock falls the
CEO generally receives a greater number of shares each year. The CEO effectively dollar cost averages
without having to risk any of their own capital. We would highlight Range Resources as an example of
how executives can benefit from the underlying volatility in their share price, irrespective of the longer-
term performance trend. While this is a wide-spread issue across the sector, the share prices of natural
gas-focused companies like Range recovered earlier than the oilier E&Ps, making the appreciation in
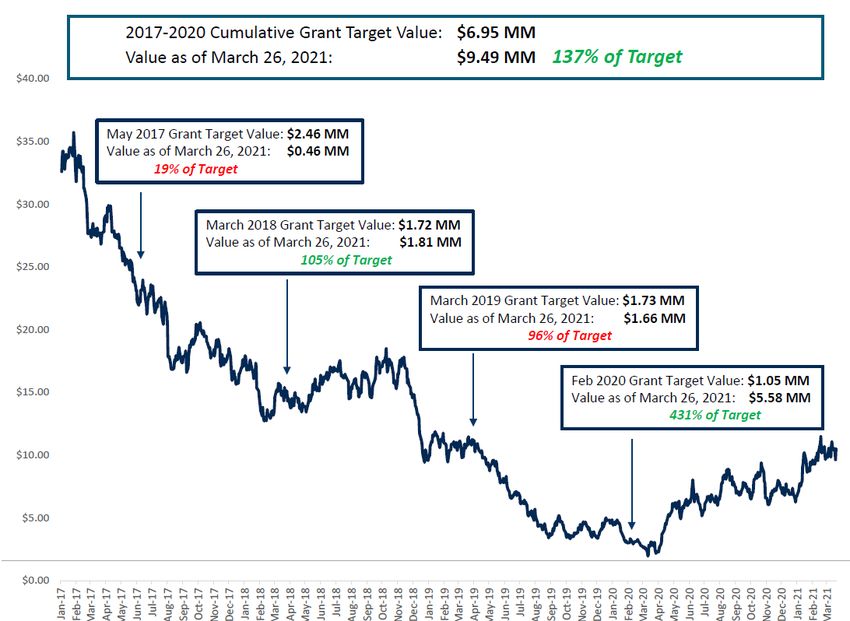
value of the 2020 LTI grants evident in the 2021 proxy filing.
At the time of proxy filing in March 2021, Range’s share price had declined by 68% from the start of
2017 and materially underperformed the S&P E&P index (XOP), which had fallen by 50%. However, as
disclosed in their proxy filing, the value of the CEO’s TSR Performance Share Units (PSUs) from those
four years were tracking at 137% of target. This is largely the result of the CEO being awarded his
performance shares at $3/share in February 2020, where the expected value had increased by over
400% as of March 2021. Additionally, Range benefited from a self-selected peer group in which one-
quarter of the 2020 companies declared bankruptcy and the only penalty for negative TSR over the
years was a cap of 100% of target.
5Figure 3: Range Resources TSR PSU Grant Date Target vs. Value as of March 26, 2021
Source: Range Resources Proxy Statement and Bloomberg4
To their credit, some Boards did identify the potential dilution associated with awarding stock-based
compensation during an extreme dislocation in the market and adjusted the cost basis to mitigate the
impact.
• Matador: LTI share awards based on $12.50/share vs. the actual $2.41 share price on grant date
• Antero: Deferred grant date from April to July to account for low share price.
• SM Energy: Deferred grant date from July to December to account for low share price.
• EOG: Granted same number of shares as 2019, resulting in a ~50% reduction in grant value.
It will be quite telling which companies choose to continue their selective disclosure of expected realized
compensation, which was clearly an attempt to divert investor attention away from the SEC
standardized disclosure of grant date target value. While they were eager to advertise the lower
potential payouts as share prices fell, they may be less willing to disclose the lucrative payouts
associated with the 2020 awards.
4
Chart prepared by Kimmeridge using grant date target value and expected value as of 3/26/21 for 2017-2020 PSU awards as disclosed in
Range’s 2021 proxy statement. Final realized value could prove to be meaningfully different based on absolute and relative TSR.
6Principle #1: Eliminate Growth Metrics and Board Discretion
Investor criticism around metrics related to volume growth and the degree of discretion in annual
bonuses appears to be resonating. A recent study by compensation consultant Meridian noted that in
2018 production was the single most common metric for public E&P companies, with a weighting of 25%
of annual incentive targets. In 2021, less than half of the companies still had production as a
performance metric and the weighting has shrunk to 11%. Importantly, we have seen the prevalence of
return-based metrics, which we highlighted in our original paper as having the highest historical
correlation to TSR, rise from 14% to 68%. Meridian also found that annual incentive plans are
increasingly quantitative, with the percentage allocated to qualitative or discretionary factors having
decreased from 27% to 18%.5
Figure 4: E&P Annual Incentive Metric Prevalence
Source: Meridian
Principle #2: Performance-Based Incentives Settled in Shares
Time-based stock acquired at zero cost, without a performance threshold, is simply a payoff for
continued employment. While it may be necessary to retain certain employees, we believe long-term
incentives for the CEO should be 100% performance-based. If a CEO wants to depart for greater time-
based compensation, they are the not the right person to lead the company. We have seen some
incremental progress on this front, but the average long-term incentive structure for CEOs is still 40%
time-based.
5
Meridian Energy Insights Post #69 - E&P Short-Term Incentive Design Reflects Changing Priorities
7Figure 5: Time-Based Percentage of Long-Term CEO Incentives
Source: Proxy Statements
We would highlight notable improvement from previous outliers like Centennial (CDEV), which moved
from 33% to 50% performance-based, as well as the companies that raised the bar after emerging from
bankruptcy, with Oasis (OAS) and Whiting (WLL) moving to 75% and 70% performance-based,
respectively. The clear leader on this front has been Pioneer (PXD), which has structured CEO long-term
compensation to be 100% performance-based. We hope to see the rest of the industry follow Pioneer’s
lead and abandon time-based stock awards for CEOs.
Principal #3: Deemphasize Relative TSR for Absolute TSR and Long-Term Financial Metrics
This is the area where we have seen some improvement, with more companies incorporating absolute
performance payouts, adding broader indices as a measure of relative performance and including
financial metrics within their long-term incentive plans. One concern we have is that indices are being
adopted as if they were just another peer on a long list of companies used to measure relative
performance, which obviously dilutes the relevance of using a comprehensive index. We believe indices
should replace the self-selected peer group all together, like we saw with Oasis and Laredo. Another
concern is that most Boards are still willing to pay 100% of target for median relative performance with
negative absolute returns. Shareholders should demand that the bar is raised for what is meant to be
performance-based compensation. We believe the below elements within company plans are helping
redefine long-term performance incentives.
TSR Calculation in LTI
• Oasis: 50% absolute TSR and 25% relative TSR (half measured against Russell 2000 index)
• Laredo: 25% absolute TSR and 25% relative TSR using E&P stocks in the Russell 2000 index
8• Cimarex: 50% reduction to payout for negative absolute TSR
• PDC Energy: Modifier of 50-150% vs. target forfollow suit. We recognize that there is not a one-size-fits-all approach to designing executive
compensation programs and our intention is not to be prescriptive at the individual company level.
However, we maintain that there are basic principles that could help foster greater alignment and
accountability. A consistent theme over the past year has been the outsized progress within post-
bankruptcy companies, which highlights the benefit of starting with a clean sheet of paper. We
recognize the challenges of inertia at public companies and recommend that all companies go through
the exercise of starting with a tabula rasa, rather than trying to tinker with existing plans. As the sector
continues to struggle with reestablishing investor credibility, we believe overhauling executive
compensation plans is the key to accelerating a change of perception.
10THIS PAPER REPRESENTS THE VIEWS AND OPINIONS OF KIMMERIDGE ENERGY MANAGEMENT COMPANY, LLC AND ITS
EMPLOYEES AND AFFILIATES (KIMMERIDGE) AS OF THE DATE HEREOF AND IS SUBJECT TO CHANGE. THE OPINIONS EXPRESSED
HEREIN ARE NOT REPRESENTATIVE OF OUR VIEWS ON ANY PARTICULAR COMPANY, RATHER THEY REFLECT OUR VIEWS ON THE
US ENERGY INDUSTRY AS A WHOLE. ALL DATA USED IN THIS PAPER HAS BEEN SOURCED FROM PUBLIC FILINGS OF US E&P
COMPANIES UNLESS OTHERWISE NOTED AND, WHILE BASED ON SOURCES WE CONSIDER TO BE RELIABLE, WE DO NOT
REPRESENT THAT THE INFORMATION PRESENTED HEREIN IS ENTIRELY ACCURATE OR COMPLETE AND IT SHOULD NOT BE RELIED
ON AS SUCH. THIS PAPER IS PROVIDED FOR INFORMATIONAL PURPOSES ONLY AND IS NOT MEANT TO BE RELIED UPON IN
MAKING ANY INVESTMENT OR OTHER DECISION. NOTHING HEREIN IS DESIGNED TO BE A RECOMMENDATION TO PURCHASE OR
SELL ANY SECURITY, INVESTMENT PRODUCT OR VEHICLE. THERE IS NO GUARANTEE THAT IMPLEMENTING THE VIEWS PRESENTED
IN THIS PAPER WILL YIELD POSITIVE RESULTS FOR ANY INDIVIDUAL E&P COMPANY OR THE ENERGY INDUSTRY AS A WHOLE.
CERTAIN EXAMPLES PROVIDED IN THIS PAPER CONTAIN THE PERFORMANCE RESULTS OF ONE PARTICULAR COMPANY AND
RESULTS COULD DIFFER DEPENDING ON THE PARTICULAR COMPANY USED IN THE EXAMPLE OR WHETHER A PARTICULAR GROUP
OF COMPANIES WAS USED IN THE COMPARISON. THE PRICE AND VALUE OF INVESTMENTS REFERRED TO IN THIS PAPER MAY
FLUCTUATE. PAST PERFORMANCE IS NOT INDICATIVE OF FUTURE RESULTS. NOTHING IN THIS PAPER REPRESENTS INVESTMENT
PERFORMANCE OF KIMMERIDGE OR ANY KIMMERIDGE SPONSORED FUND. INVESTING IN ANY SECTOR, INCLUDING THE E&P
SECTOR, INVOLVES SIGNIFICANT RISKS.
11You can also read