Prediction of daily and cumulative cases for COVID 19 infection based on reproductive number (R0) in Karnataka: a data driven analytics
←
→
Page content transcription
If your browser does not render page correctly, please read the page content below
www.nature.com/scientificreports
OPEN Prediction of daily and cumulative
cases for COVID‑19 infection
based on reproductive number
(R0) in Karnataka: a data‑driven
analytics
Kuralayanapalya Puttahonnappa Suresh1, Sharanagouda S. Patil1,
Bharath Prasad Cholanayakanahalli Thyagaraju1, Srikantha Gowda Ramkrishnappa1,
Divakar Hemadri2 & S. Chandrashekara3*
To estimate the reproductive number (R0) of the coronavirus in the present scenario and to predict
the incidence of daily and probable cumulative cases, by 20 August, 2020 for Karnataka state in India.
The model used serial interval with a gamma distribution and applied ‘early R’ to estimate the R0 and
‘projections’ package in R program. This was performed to mimic the probable cumulative epidemic
trajectories and predict future daily incidence by fitting the data to existing daily incidence and the
estimated R0 by a model based on the assumption that daily incidence follows Poisson distribution.
The maximum-likelihood (ML) value of R0 was 2.242 for COVID-19 outbreak, as on June 2020. The
median with 95% CI of R0 values was 2.242 (1.50–3.00) estimated by bootstrap resampling method.
The expected number of new cases for the next 60 days would progressively increase, and the
estimated cumulative cases would reach 27,238 (26,008–28,467) at the end of 60th day in the future.
But, if R0 value was doubled the estimated total number of cumulative cases would increase up to
432,411 (400,929–463,893) and if, R0 increase by 50%, the cases would increase up to 86,386 (80,910–
91,861). The probable outbreak size and future daily cumulative incidence are largely dependent
on the change in R0 values. Hence, it is vital to expedite the hospital provisions, medical facility
enhancement work, and number of random tests for COVID-19 at a very rapid pace to prepare the
state for exponential growth in next 2 months.
Coronavirus disease (COVID-19), a novel virus originated from Wuhan a city in the Hubei Province of China
at the end of 2019, has progressed rapidly to become a global epidemic. In February 2020, the World Health
Organization (WHO) designated the disease as COVID-19 and declared it as a global pandemic, as the disease
has spread to nearly all the continents and the cases are rising at an exponential rate1.
The present study is aimed at predicting the spreading efficiency of the COVID-19 in Karnataka, which is
one among the 28 states of India. The state has a total population of 6.41 crore, which is ~ 4.7% of the overall
population of India. The first case of the COVID-19 in India was reported on January 30, 2020 in a couple who
had a travel history to Dubai2. In Karnataka, the first case was detected on March 09, 20203. On March 12, 2020
the World Health Organization (WHO) announced COVID-19 as a global pandemic to emphasize on the rapid
spread of the disease to multiple countries and continents4.
As on June 23, 2020 the state’s case fatality rate was 1.01%, which was significantly lower than the global aver-
age and other Indian states with moderate number of cases5. Karnataka can be considered as moderately affected
state with 9399 confirmed cases, 5730 recovered and 142 d eaths6. More than two-thirds of the cases in the state
have emerged from the migrant travelers from other states, mainly Maharashtra, Tamil Nadu, Delhi, Gujarat etc.
1
Department of Spatial Epidemiology, ICAR-National Institute of Veterinary Epidemiology and Disease Informatics,
Bengaluru, Karnataka, India. 2Department of Virology, ICAR-National Institute of Veterinary Epidemiology and
Disease Informatics, Bengaluru, Karnataka, India. 3ChanRe Rheumatology and Immunology Centre and Research,
Bengaluru, Karnataka, India. *email: chandrashekara_s@yahoo.com
Scientific Reports | (2021) 11:10075 | https://doi.org/10.1038/s41598-021-89573-x 1
Vol.:(0123456789)www.nature.com/scientificreports/
Restricted space and high population density of the country are the key factors influencing the transmissibil-
ity of COVID-19. The forecasting of the probable number of cases is essential to create awareness and arrange
effective disease control measures7. There is a major threat associated with increase in disease spread, as most of
the population belongs to below poverty line and the country does not have huge resources for medical inter-
ventions proportional to the population. The options to manage the disease are acquiring herd immunity and
implementing lockdown or restricting the population m ovement8. In the present study, we have calculated the
reproductive number ( R0) of COVID-19 at an early stage of viral disease outbreak, to predict the daily incidence
and cumulative cases for the next sixty days (till August 20, 2020).
Methodology
Focus. A confirmed case of COVID-19 infection is defined as those with a positive result for viral infection
and history of acute respiratory illness for the collected specimens. A suspected case is defined as a patient with
symptoms of COVID-19 infection, but not confirmed by viral nucleic acid testing. An actual estimate of the
serial interval was considered by estimating the time from onset of illness in a primary case (infector) to illness
onset in a secondary case (infected) in a transmission chain9. Serial interval can only be estimated by linking
dates of onset for infector-infected data pairs, and these links are difficult to be established. R0 is defined as the
actual expected number of secondary cases that one primary case will generate in a susceptible p opulation10.
Data source. All the data were derived from cloud sourced database published in the official website of
Ministry of Health and Family Welfare of India11. The data for model development were updated from April
14, 2020 to June 21, 2020. However, the initial data were not considered, as the serial interval did not reflect the
average behavior for effectively modelling the epidemic curve and number of effective cases was very low due to
imposing strict lockdown in the state.
Model development and statistical analysis. To estimate the contiguous transmissibility of COVID-
19 in the state, the study employed the ‘early R’ statistical package to evaluate the R0 in the early stage of the dis-
ease outbreak12. R refers to the average number of secondary infected cases by one primary infected person dur-
ing the infectious period. If R > 1, the number of cases increases; if R < 1, the number of infected cases reduces,
and the disease will die out. When R = 1, it suggests that infectious disease has become an endemic within the
community.
R is calculated by the probability of the spread of infection upon contact with an infected person, based on
the number of contacts and the duration within the infected person that can help to spread the infection. Here,
β refers to the probability of infection transmitted (transmission rate) multiplied by the contact levels and 1/α is
the duration of infection transmitted. The mathematical model used to estimate R for COVID-19 in this study
is represented below:
β
R=
α
Serial interval (SI) distribution data was calculated to estimate R0, and there was inadequate information about
total number of cases to estimate serial interval. The value of serial interval (mean and standard deviation) was
fixed with a gamma distribution, as earlier d escribed13. The ‘get_R’ function was used to estimate the distribution
of R0 with maximum-likelihood (ML). A bootstrap strategy with 500 times resampling was adopted to get larger
set of likely R0 values. These R0 values were subsequently presented in a histogram format, calculated the cumula-
tive cases and interquartile range for these values. R package of ‘projections’ was used to estimate the probable
epidemic trajectories simulation, prediction of future daily incidence and cumulative c ases14. The simulation and
prediction were generated by fitting the data to an existing daily incidence, a serial interval distribution, and the
estimated R0 by a model based on the assumption that daily incidence followed Poisson distribution determined
by daily infectiousness, which is denoted as
t−1
t = ysw(t − s)
s=1
w (t – s) is the vector of probability mass function (PMF) of serial interval distribution and ys is the real-time
incidence at s time14,15. The study also computed the prediction of daily incidence and cumulative cases for the
next 60 days using a bootstrap resampling method (500 times). All the statistical analysis and disease forecast
model was developed by using R version 3.6.3.
Results
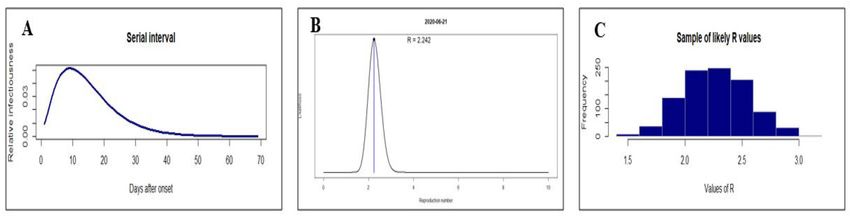
The COVID-19 serial interval distribution is shown in Fig. 1A. Using the serial interval distribution, as described
above, the maximum likelihood estimate (MLE) value of R 0 was found as 2.242 for COVID-19 outbreak at the
present stage in Karnataka (Fig. 1B). Bootstrap strategy was adopted to obtain 500 likely R 0 values. The distribu-
tion of these R
0 values was presented as histogram plot (Fig. 1C). The estimated median with 95% confidence
interval (CI) of R
0 values was 2.242 (1.50–3.00), as on June 21, 2020.
The probable number of daily new cases for the next 60 days was calculated based on existing data (Fig. 2).
The daily number, at seven days’ interval (between June 22, 2020 and August 20, 2020) with 95% confidence
interval (CI) of probable new cases at actual R0 (2.242) will be 255 (200–310), 250 (195–305), 253 (202–303),
261 (207–315), 277 (221–333), 293 (244–361), 312 (254–370), 339 (280–398), 356 (294–418), 378 (303–453),
Scientific Reports | (2021) 11:10075 | https://doi.org/10.1038/s41598-021-89573-x 2
Vol:.(1234567890)www.nature.com/scientificreports/
Figure 1. The distribution of serial interval (A), the present likely value of reproductive number ( R0) estimated
by the Maximum-Likelihood (ML) method (B), a sample of 500 likely R0 values using a bootstrap resampling
method (C) for COVID-19 in Karnataka.
Predicted Daily Incidence
30000
25000
Daily Cases
20000
15000
10000
5000
0
22-Jun
23-Jun
24-Jun
25-Jun
26-Jun
27-Jun
28-Jun
29-Jun
30-Jun
1-Jul
2-Jul
3-Jul
4-Jul
5-Jul
6-Jul
7-Jul
8-Jul
9-Jul
10-Jul
11-Jul
12-Jul
13-Jul
14-Jul
15-Jul
16-Jul
17-Jul
18-Jul
19-Jul
20-Jul
21-Jul
22-Jul
23-Jul
24-Jul
25-Jul
26-Jul
27-Jul
28-Jul
29-Jul
30-Jul
31-Jul
1-Aug
2-Aug
3-Aug
4-Aug
5-Aug
6-Aug
7-Aug
8-Aug
9-Aug
10-Aug
11-Aug
12-Aug
13-Aug
14-Aug
15-Aug
16-Aug
17-Aug
18-Aug
19-Aug
20-Aug
Date
Actual_R0 25 Increase 50% Increase 75% Increase Doubled_R0
Figure 2. The probable epidemic trajectories of predicted daily cases for COVID-19 in Karnataka, India, June
22, 2020 and August 20, 2020. Red, yellow, black, orange line shows the probable daily cases, if the R 0 value is
doubled, 75%, 50% and 25% respectively. Blue line shows the probable number of daily cases, if R 0 value was
unchanged, for the next 60 days.
414 (332–496), respectively. If the R0 value is presumed to increase by 25% (2.802), 50% (3.363) and 75% (3.923);
the corresponding predicted daily new cases will be 1100 (970–1230), 3085 (2807–3362), and 9080 (8452–9708).
If the R0 (4.484) gets doubled (100%) than actual R0, the daily new cases will drastically reach up to 27,831
(25,729–29,932) at the 60th day (August 20, 2020).
The range of cumulative number of cases for the next 60 days is shown in Fig. 3. The probable cumulative
number of cases at seven days’ interval (between June 22, 2020 and August 20, 2020) with 95% CI at actual R 0
(2.242) will be 9405 (9350–9460), 10,832 (10,646–11,018), 12,318 (12,032–12,604), 13,860 (13,496–14,223),
15,498 (15,009–15,987), 17,187 (16,604–17,769), 19,034 (18,358–19,710), 20,998 (20,192–21,803), 23,067
(22,092–24,041), 25,261 (24,130–26,391), 27,238 (26,008–28,467), respectively. If R 0 (2.802) value is presumed
to increase by 25% (2.802), 50% (3.363) and 75% (3.923); the corresponding predicted cumulative incidences will
be 45,635 (43,011–48,258), 86,386 (80,910–91,861), and 184,167 (172,572–195,762). If R 0 (4.484) gets doubled
(100%) than actual R0, the probable cumulative number of cases will reach up to 432,411 (400,929–463,893) at
the end of prediction date (August 20, 2020).
Discussion
Using the current data and the proposed pandemic model, the current study provides an estimation of the R 0
for COVID-19 during the present stage of disease spread in Karnataka. The estimated distribution of R 0 is about
2.242 (95% CI 1.50–3.00), which is similar to a set of previously published estimates, ranging from 2.286 (95%
CI 1.4–3.9) to 3.58 (95% CI 2.89–4.39). It is equivalent to the reported estimate from a recent study with a larger
sample size, which suggested the R 0 of 3.77 (95% CI 3.51–4.05)4,16,17. The wide ranges and the difference in R 0
values reported by different studies indicates that exact estimation of R0 is quite challenging, because it is difficult
to calculate the exact total number of infected cases during an epidemic. The R0 value is usually affected by a set
of factors like analysis, environmental circumstances, modeling procedures and statistical c aliber18.
Scientific Reports | (2021) 11:10075 | https://doi.org/10.1038/s41598-021-89573-x 3
Vol.:(0123456789)www.nature.com/scientificreports/
Predicted Cumulative Incidence
450000
400000
Cum. Daily Cases 350000
300000
250000
200000
150000
100000
50000
0
22-Jun
23-Jun
24-Jun
25-Jun
26-Jun
27-Jun
28-Jun
29-Jun
30-Jun
1-Jul
2-Jul
3-Jul
4-Jul
5-Jul
6-Jul
7-Jul
8-Jul
9-Jul
10-Jul
11-Jul
12-Jul
13-Jul
14-Jul
15-Jul
16-Jul
17-Jul
18-Jul
19-Jul
20-Jul
21-Jul
22-Jul
23-Jul
24-Jul
25-Jul
26-Jul
27-Jul
28-Jul
29-Jul
30-Jul
31-Jul
1-Aug
2-Aug
3-Aug
4-Aug
5-Aug
6-Aug
7-Aug
8-Aug
9-Aug
10-Aug
11-Aug
12-Aug
13-Aug
14-Aug
15-Aug
16-Aug
17-Aug
18-Aug
19-Aug
20-Aug
Dates
Actual_R0 25% Increase 50% Increase 75% Increase Doubled_R0
Figure 3. The probable epidemic trajectories of predicted cumulative cases for COVID-19 in Karnataka, India,
June 22, 2020 and August 20, 2020. Red, yellow, black, orange line shows the probable daily cases, if the R
0 value
was doubled, 75%, 50% and 25% respectively. Blue line shows the probable number of cumulative cases, if R 0
value was unchanged, for the next 60 days.
In the present study, the accuracy of estimated R 0 is mainly dependent on the identification of all the infected
cases in Karnataka. According to the report from Ministry of Health and Family Welfare of India, all the sus-
pected cases and cases who had close contact with confirmed cases contracted viral infection after testing.
Therefore, the percentage of unidentified cases is thought to be very low. In contrast, previous studies were mainly
focused on the estimation of R 0 in Wuhan, C hina4,16. Moreover, in contrast to such studies, the disease that can
be transmitted from animals to individuals for SARS-Co V was absent among the extensively larger population
of India4,9. Therefore, the R
0 estimated in the current study only depicts the human-to-human transmissibility
of COVID-19 and not from animals to human transmissibility. In Karnataka, the community level transmission
has already begun and cases could be rising in the next 2 months19. The current results have concluded that the
R0 is low due to enforcement of strict quarantine and lockdown measures in Karnataka. The current estimations
also denote the silent spread of the virus at an exponential rate. Most of the patients, who are testing positive,
are asymptomatic. Such cases within incubation may also cause continuous spread of the novel virus and this
may also partially explain why low R 0 was noted at current stage19.
The current study has also estimated the daily incidence, cumulative cases, and the probable size of the
outbreak for the next sixty days. According to the analysis, the daily incidence and the magnitude of outbreak
are largely dependent on the value of R 0. If the R
0 (2.242) value is presumed to remain unaffected, the probable
cumulative number of infected cases may reach 27,238 (26,008–28,467) at the 60th day, suggesting more popu-
lation would be infected in future. Karnataka has adopted strict measures to control the spread of infection by
enforcing strict lockdown and quarantining the suspected cases. As a result, the transmissibility is expected to
reduce in the future days. But, due to relaxation in lockdown, improper social distancing, and population mixing
would lead to natural process of disease transmission, infected cases might increase in future due to change in
R0 value. If the R0 (2.802) value increased by 50%, the infected cases will increase up to 86,386 (80,910–91,861),
and if, R0 (3.923) increased by 75%, the infected cases will rise up to 184,167 (172,572–195,762). The scenarios
such as opening of schools and colleges, migration of travelers from highly infected states, unhygienic condi-
tion at markets and crowded places, increase in religious conglomeration, and opening of overseas travelling
may contribute to increase in number of active cases at rapid pace. This may lead to doubling of R0 (4.484) than
actual R0 (2.242) values and the infected probable cumulative cases will reach up to 432,411 (400,929–463,893)
at the end of 60th day (20 August, 2020). The present data-driven analytics is mainly aimed at predicting the
probable epidemic size. It also highlights the importance of controlling the transmissibility among population, to
prepare the state by arranging all medical facilities and resources to manage the estimated exponential increase.
R0 is not an intrinsic characteristic value of SARS-CoV pathogen, but it describes the transmissibility of that
pathogen within the specific population and settings. Hence, R0 mainly depends on socio-demographic variable
and the biology of infectious agent. Serial interval indicates that COVID-19 infection leads to rapid cycles of
transmission from one generation of cases to the next. The difference between these distributions suggests that
using serial interval estimates from SARS data will result in overestimation of the COVID-19 basic reproduction
number and correct ascertainment on dates of illness onset is critical to calculate the serial interval20,21.
The current trend shows that there will be a geometric progression in the upcoming days due to relaxation of
lockdown and negligent attitude of citizens regarding the infection spread, such as not using face mask, improper
social distancing, mixing of more population, going to unhygienic market places, and not following strict advices
given by the public health officials to consult doctors. Although the patient recovery rate is rising, the current
trends indicate unprecedented increase in number of daily new cases and death rate due to COVID-19 infection.
Scientific Reports | (2021) 11:10075 | https://doi.org/10.1038/s41598-021-89573-x 4
Vol:.(1234567890)www.nature.com/scientificreports/
Even though stringent control measures are being implemented by the Government, there is increased chances of
following the predicted geometric progression pattern, as the new cases identified in state are mainly in health-
care workers, police, BMTC, KSRTC and railway staffs, auto-rickshaw drivers, footpath vendors, delivery boys
and salesmen. Such individuals may serve as super spreaders and it is essential to identify such hospital-based
outbreaks and community-based clusters through continuous testing. Hospital provisions (in both public and
private sectors) and medical facility enhancement work and number of random tests for COVID-19 infection
should be continued at a very rapid pace to prepare the state for managing the predicted exponential growth.
Through such current interventions and preparations, the Government of Karnataka is looking forward to flat-
ten the pandemic curve.
Conclusion
At the present stage of infection in Karnataka, the estimated R 0 with 95% CI for COVID-19 is about 2.242
(1.50–3.00). The future daily incidence, probable cumulative cases and outbreak size are mainly dependent on
value of R0. Due to the relaxation in lockdown, negligent attitude of people in maintaining social distancing, not
taking precautionary measures and population mixing may accentuate the natural process of disease transmis-
sion. The number of active cases may double in the forthcoming days due to change in R 0 value. The present
findings highlight the importance of reducing transmissibility in controlling the probable outbreak size as well
as to enhance the hospital provisions and medical facility (number of random tests) at very rapid pace to prepare
the state for managing the worst situation for the months of September and October.
Received: 9 July 2020; Accepted: 5 January 2021
References
1. WHO Director-General’s remarks at the media briefing on 2019-nCoV on 11 February 2020. https://www.who.int/director-gener
al/speeches/detail/who-director-general-s-remarks-at-the-media-briefi ng-on-2019-ncov-on-11-february-2020.
2. India Fights Corona COVID-19 in India, Corona Virus Tracker | mygov.in. https://www.mygov.in/covid-19/.
3. Coronavirus Bengaluru Cases: One Intel employee in Bengaluru potentially exposed to coronavirus, under quarantine. The Eco-
nomic Times. https://economictimes.indiatimes.com/tech/internet/one-intel-employee-in-bengaluru-potentially-exposed-to-
coronavirus-under-quarantine/articleshow/74470605.cms.
4. Special report: The simulations driving the world’s response to COVID-19. https://w ww.n ature.c om/a rticl es/d
41586-0 20-0 1003-6.
5. Covid-19 pandemic in India updates: Coronavirus status by city and state. https://www.pharmaceutical-technology.com/news/
india-covid-19-coronavirus-updates-status-by-state/.
6. Health Department Bulletin—COVID-19 INFORMATION PORTAL. https://c ovid1 9.k arnat aka.g ov.i n/n ew-p age/H
ealth%2 0Dep
artment%20Bulletin/en.
7. Jung, S. et al. Real-time estimation of the risk of death from novel coronavirus (COVID-19) infection: Inference using exported
cases. J. Clin. Med. 9, 523 (2020).
8. Kloeden, P. E. & Pearson, R. A. The numerical solution of stochastic differential equations. ANZIAM J. 20, 8–12 (1977).
9. Fine, P. E. M. The interval between successive cases of an infectious disease. Am. J. Epidemiol. 158, 1039–1047 (2003).
10. Li, Q. et al. Early transmission dynamics in Wuhan, China, of novel coronavirus-infected pneumonia. N. Engl. J. Med. 382,
1199–1207 (2020).
11. MoHFW | Home. https://www.mohfw.gov.in/.
12. Jombart, T. et al. earlyR: Estimation of Transmissibility in the Early Stages of a Disease Outbreak (2020).
13. Virus cases in Hong Kong apartments recall SARS memories. https://apnews.com/article/2b93091de34ceb1b5ac9443be8abee4c.
14. Jombart, T. et al. projections: Project Future Case Incidence. (2020).
15. Nouvellet, P. et al. A simple approach to measure transmissibility and forecast incidence. Epidemics 22, 29–35 (2018).
16. Wu, J. T., Leung, K. & Leung, G. M. Nowcasting and forecasting the potential domestic and international spread of the 2019-nCoV
outbreak originating in Wuhan, China: A modelling study. Lancet 395, 689–697 (2020).
17. Zhao, S. et al. Preliminary estimation of the basic reproduction number of novel coronavirus (2019-nCoV) in China, from 2019
to 2020: A data-driven analysis in the early phase of the outbreak. Int. J. Infect. Dis. 92, 214–217 (2020).
18. Delamater, P. L., Street, E. J., Leslie, T. F., Yang, Y. T. & Jacobsen, K. H. Complexity of the basic reproduction number ( R0). Emerg.
Infect. Dis. 25, 1–4 (2019).
19. Jun 22, B. M. B. / U., 2020 & Ist, 10:03. Covid-19 Cases in Bangalore: Community transmission has begun in Bengaluru. Bangalore
Mirror. https://bangaloremirror.indiatimes.com/bangalore/cover-story/community-transmission-has-begun-in-bengaluru-and-
cases-could-keep-rising-over-the-next-two-months-says-dr-cn-manjunath/articleshow/76500579.cms.
20. Nishiura, H. et al. The rate of underascertainment of novel coronavirus (2019-nCoV) infection: Estimation using Japanese pas-
sengers data on evacuation flights. J. Clin. Med. 9, 419 (2020).
21. Wang, W., Tang, J. & Wei, F. Updated understanding of the outbreak of 2019 novel coronavirus (2019-nCoV) in Wuhan, China. J.
Med. Virol. 92, 441–447 (2020).
Author contributions
K.P.S.: conceptualization, modelling concept, results generation and analysis; S.S.P.: data collection and results
interpretation; B.P.C.T.: data collection, R coding, results generation and literature collection; S.G.R.: program-
ming and R coding; D.H.: inferential analysis and discussion; S.C.: conceptualization, inferential analysis, and
discussion.
Competing interests
The authors declare no competing interests.
Additional information
Correspondence and requests for materials should be addressed to S.C.
Reprints and permissions information is available at www.nature.com/reprints.
Scientific Reports | (2021) 11:10075 | https://doi.org/10.1038/s41598-021-89573-x 5
Vol.:(0123456789)www.nature.com/scientificreports/
Publisher’s note Springer Nature remains neutral with regard to jurisdictional claims in published maps and
institutional affiliations.
Open Access This article is licensed under a Creative Commons Attribution 4.0 International
License, which permits use, sharing, adaptation, distribution and reproduction in any medium or
format, as long as you give appropriate credit to the original author(s) and the source, provide a link to the
Creative Commons licence, and indicate if changes were made. The images or other third party material in this
article are included in the article’s Creative Commons licence, unless indicated otherwise in a credit line to the
material. If material is not included in the article’s Creative Commons licence and your intended use is not
permitted by statutory regulation or exceeds the permitted use, you will need to obtain permission directly from
the copyright holder. To view a copy of this licence, visit http://creativecommons.org/licenses/by/4.0/.
© The Author(s) 2021
Scientific Reports | (2021) 11:10075 | https://doi.org/10.1038/s41598-021-89573-x 6
Vol:.(1234567890)You can also read