8 Financial position of public-sector institutions - National Treasury
←
→
Page content transcription
If your browser does not render page correctly, please read the page content below
8
Financial position of
public-sector institutions

 In brief
 •   The financial performance of several large state-owned companies continued to deteriorate sharply over the
     past year, leading to an increasing drain on public resources.
 •   The Public Finance Management Act (1999) requires major state-owned companies to generate sufficient
     financial resources from their operations to meet their obligations to employees, the public and debt holders.
     Few are meeting these requirements: liabilities are growing faster than assets, with a consequent decline in
     aggregate net asset value of 5.6 per cent in 2018/19.
 •   The combined net asset value of the three large development finance institutions – the Development Bank of
     Southern Africa (DBSA), the Industrial Development Corporation (IDC) and the Land Bank – increased to
     R139.4 billion in 2018/19.
 •   The social security funds will pay out R211 billion in benefits and collect R238 billion in contributions over the
     medium term. Large surpluses in the Unemployment Insurance Fund and the Compensation Fund, however,
     are more than offset by Road Accident Fund liabilities, which are expected to reach R605 billion by 2022/23.
 •   In 2018/19, the Government Employees Pension Fund paid out R102.5 billion in benefits funded by investment
     income of R84.2 billion and contributions of R75.6 billion.

      Overview

T
      his chapter discusses the financial position of state-owned                             Public-sector institutions need
      companies, development finance institutions and social security                         to be well governed,
      funds. Their mandates include building and operating infrastructure,                    operationally sound and
financing social and economic development, and augmenting the country’s                       financially sustainable
social security system. To meet their objectives, these institutions need to
be well governed, operationally sound and financially sustainable.
The 2019 Budget Review outlined a set of urgent reforms for Eskom,
acknowledging that it was the largest state-owned company in need of
significant restructuring – but not the only one. Since then, there has been
some progress. The Department of Public Enterprises has published a
roadmap for Eskom’s reform, outlining the utility’s role as part of a

                                                                                                                            89
2020 BUDGET REVIEW

                                  reformed electricity supply industry, and will report on progress at key
                                  milestones. South African Airways (SAA) has been placed in voluntary
                                  business rescue. The business rescue practitioners are expected to publish
                                  their plan within a matter of weeks.
Apart from Road Accident          With the exception of the Road Accident Fund, the financial positions of
Fund, financial position of       the social security funds are sound. They are able to meet their long-term
social security funds remains     obligations, as is the Government Employees Pension Fund. Over the past
sound                             year, government has taken steps to strengthen governance and
                                  transparency at the Public Investment Corporation.

                                         State-owned companies
                                  Unlike their private counterparts, most state-owned companies hold
                                  developmental rather than profit-driven mandates. Nonetheless, these
                                  entities need to be financially self-sustaining. In recent years, a pattern of
                                  mismanagement and poor governance at major state-owned companies
                                  has led to operational failures, financial distress and increased demands
                                  for taxpayer support through the national budget. This problem is
                                  compounded by broad, sometimes unfunded mandates and, in some
                                  cases, outdated business models.
Average return on equity at       The financial performance of state-owned companies continues to
state-owned companies has         deteriorate. Liability growth has outpaced that of assets, with a
fallen sharply                    consequent decline in net asset value, eroding the ability of these entities
                                  to meet their financial obligations and deliver on their mandates. Average
                                  return on equity, a measure of how effectively net assets are used to create
                                  value, fell sharply in 2018/19 – the most recent year for which data is
                                  available. This decline is largely the result of weak revenue growth, high
                                  compensation costs and rapidly growing debt-service costs.

Table 8.1 Combined balance sheets of state-owned companies1
                                                                                  2                 2
 R billion/per cent growth             2014/15            2015/16           2016/17        2017/18      2018/19
 Total assets                            1 037.5           1 178.6           1 224.3         1 263.2     1 269.0
                                           13.9%             13.6%              3.9%            3.2%        0.5%
 Total liabilities                         739.2             818.2             870.3           901.1       927.0
                                           16.2%             10.7%              6.4%            3.5%        2.9%
 Net asset value                           298.3             360.4             354.0           362.1       342.0
                                            8.6%             20.8%             -1.8%            2.3%       -5.6%
 Return on equity (average)                -2.5%              0.6%              0.7%           -0.8%       -8.2%
1. State-owned companies listed in schedule 2 of the PFMA, excluding development finance institutions
2. Numbers may differ from earlier publications due to restatement or error
Source: National Treasury
                                  As the scale of financial challenges in state-owned companies has become
                                  apparent, many have struggled to access capital markets. In combination
                                  with weak cash flows (Figure 8.1), this has reduced their capital spending,
                                  resulting in delayed delivery of much-needed social and economic
                                  infrastructure. It has also affected their ability to meet debt commitments.
                                  The Public Finance Management Act requires state-owned companies
                                  listed in schedule 2 to generate sufficient financial resources from their
                                  operations to meet obligations to employees, the public, creditors and
                                  debt holders. Increasingly, however, these entities rely on external
                                  funding, government-guaranteed debt and bailouts to sustain operations.

90
CHAPTER 8: FINANCIAL POSITION OF PUBLIC-SECTOR INSTITUTIONS
Figure 8.1 Negative cash flows at state-owned companies*
Debt principal repayments
Interest payments
Capital expenditure
Net cash from operations
Net cash flow after interest, debt service and capital expenditure
100
50 89
85 80
67 64
0
R billion
-57
-86 -79
-50 -103 -98
-51
-100 -47
-34 -43
-28
-49
-150 -38 -44 -35
-69
-200
2014/15 2015/16 2016/17** 2017/18** 2018/19
*Companies listed in schedule 2 of the PFMA, excluding development finance institutions
**Numbers may differ from earlier publications due to restatement or error
Source: National Treasury
Over the past 12 years, government has allocated R162 billion to the Eskom accounts for
financially distressed state-owned companies shown in Table 8.2. These 82 per cent of fiscal support to
allocations generally provide short-term support, but cannot substitute for state-owned companies over
the far-reaching structural reforms needed to return them to operational past 12 years
and financial stability. Of the total allocations, Eskom accounts for
82 per cent. In 2019/20, government allocated R49 billion to Eskom and
committed R112 billion in medium-term funding.
Table 8.2 Summary of recapitalisations and bailouts of state-owned companies
Eskom South African Denel South African South African Total
Airways Express Broadcasting
R billion Corporation
2008/09 10.0 – – 0.4 – 10.4
2009/10 30.0 1.5 – – – 31.5
2010/11 20.0 – – – – 20.0
2011/12 – – – – – –
2012/13 0.7 – 0.4 – – 1.1
2013/14 – – – – – –
2014/15 – – – – – –
2015/16 23.0 – – – – 23.0
2016/17 – – – – – –
2017/18 – 10.0 – – – 10.0
2018/19 – 5.0 – 1.2 – 6.2
2019/20 49.0 5.5 1.8 0.3 3.2 59.8
2008/09-2019/20 (history) 132.7 22.0 2.2 1.9 3.2 162.0
2020/21 56.0 10.3 0.6 0.2 – 67.1
2021/22 33.0 4.3 – – – 37.3
2022/23 23.0 1.8 – – – 24.8
2020/21-2022/23 (MTEF) 112.0 16.4 0.6 0.2 – 129.2
Total 244.7 38.4 2.8 2.1 3.2 291.2
Source: National Treasury
912020 BUDGET REVIEW
Debt obligations
Debt repayments over next Figure 8.2 shows the long-term debt maturity profile for the seven largest
three years total borrowers. Total debt amounts to R759.9 billion, of which 62 per cent is
R178.1 billion, of which Eskom guaranteed by government. Over the next three years, debt repayments
holds R103.5 billion total R178.1 billion, of which R103.5 billion is held by Eskom.
Figure 8.2 Debt maturity profile of major state-owned companies*
Domestic capital repayments
60 Foreign capital repayments
50 Government-guaranteed capital portion
40
R billion
30
20
10
0
2020/21
2021/22
2022/23
2023/24
2024/25
2025/26
2026/27
2027/28
2028/29
2029/30
2030/31
2031/32
2032/33
2033/34
2034/35
2035/36
2036/37
2037/38
2038/39
2039/40
2040/41
2041/42
2042/43
2043/44
*Airports Company South Africa, Denel, Eskom, South African National Roads Agency Limited, SAA,
Transnet and Trans-Caledon Tunnel Authority
Source: National Treasury
Rising interest costs reflect In recent years, the ability of state-owned companies to access funding and
market doubts about state- generate sufficient cash flows to repay maturing debt has declined. Rising
owned companies’ ability to interest costs reflect market doubts about their ability to repay debt.
repay debt Increasingly, these entities require state guarantees to borrow.
Furthermore, much of the debt that has been raised is in short-term
instruments, and is used for refinancing and operations rather than capital
investment.
Figure 8.3 Borrowing costs for state-owned companies and development
finance institutions, 2018/19
Effective government borrowing cost Minimum* Maximum*
11.4
Unguaranteed 6.9 7.6
Guaranteed 6.9 7.7 13.5
0 4 8 12 16
Per cent
*Effective cost of debt for the 10 largest borrowers
Source: National Treasury
92CHAPTER 8: FINANCIAL POSITION OF PUBLIC-SECTOR INSTITUTIONS
Figure 8.3 shows the difference between borrowing costs for government State-owned companies
and state-owned companies, indicating the level of risk that the market borrow at higher rates than
attaches to the latter. Government’s average effective borrowing cost is government
6.9 per cent. State-owned companies are paying substantially more to
borrow – and the highest cost is for guaranteed debt. SAA’s borrowing
incurs nearly twice the interest rate of government.
Table 8.3 shows that in 2018/19, as in the previous year, state-owned
companies could only raise 75.4 per cent of planned borrowing. The
decline in borrowing plans has reduced or delayed capital expenditure. In
2018/19, in contrast to previous years, about 70 per cent of state-owned
companies’ domestic borrowing was in long-term instruments.
Nonetheless, this debt continued to be used for refinancing maturing debt.
Table 8.3 Borrowing requirement of selected state-owned companies1
2
2017/18 2018/19 2019/20 2020/21 2021/22 2022/23
R billion Budget Outcome Budget Outcome Revised Medium-term estimates
Domestic loans (gross) 70.1 54.4 61.8 46.1 46.6 51.2 32.3 27.1
Short-term 17.9 29.4 20.1 13.9 13.2 14.2 10.6 7.0
Long-term 52.2 25.0 41.7 32.2 33.4 37.0 21.7 20.1
Foreign loans (gross) 65.0 48.8 52.0 39.7 37.7 37.4 38.6 39.9
Long-term 65.0 48.8 52.0 39.7 37.7 37.4 38.6 39.9
Total 135.1 103.2 113.8 85.8 84.3 88.6 70.9 67.0
Percentage of total:
Domestic loans 51.9% 52.7% 54.3% 53.7% 55.3% 57.8% 45.6% 40.4%
Foreign loans 48.1% 47.3% 45.7% 46.3% 44.7% 42.2% 54.4% 59.6%
1. Airports Company South Africa, Eskom, SANRAL, SAA, Transnet and Trans-Caledon Tunnel Authority
2. ACSA and TCTA not included, as no forecast was provided
Source: National Treasury
Overall, these trends reflect the deteriorating financial state of major state-
owned companies. Without effective structural reforms, this cycle of lower
funding access and higher reliance on government is set to continue.
Eskom
Eskom relies on state support to operate. The utility reported a net profit Eskom, which does not
of R1.3 billion at 30 September 2019, but it is not generating enough cash generate sufficient cash to
to cover debt and finance costs. This is partly a result of non-payment by cover debt and finance costs, is
municipalities and other consumers. Government is working with reliant on state support
municipalities to strengthen governance and financial management.
Eskom’s immediate priority is to stabilise its operational and financial
position, as discussed in Annexure C of the 2019 Medium Term Budget
Policy Statement.
Government has provided significant financial support to Eskom since
2008. This includes R105 billion in 2019/20 and 2020/21, which is
conditional, to improve accountability and address inefficiencies. The
conditions include reducing primary energy costs, containing other costs
and making progress on restructuring. Eskom provides regular updates on
these conditions, and government reviews its cash flows on a daily basis.
Eskom has begun the process of separating its three operating activities –
generation, transmission and distribution – each of which will soon have
its own board and management structure.
932020 BUDGET REVIEW
Transnet
Transnet borrows on the Transnet operates South Africa’s port, freight rail and pipeline
strength of its own balance infrastructure. The group’s net profit increased from R4.9 billion in
sheet 2017/18 to R6 billion in 2018/19, supported by fair-value adjustments on
leased investment properties. Transnet, which borrows on the strength of
its own balance sheet, raised R6.7 billion through commercial paper, bank
loans and development finance institutions in 2018/19. It invested
R14.7 billion to maintain rail and port capacity, and R3.2 billion to expand
infrastructure and equipment.
Rating agencies downgraded Transnet’s credit rating, citing increased
liquidity risk as a result of loan covenants triggered by an audit qualification
on the 2018/19 annual financial statements.
South African Airways
R16.4 billion set aside over SAA’s board placed the airline into voluntary business rescue in December
medium term for SAA to repay 2019 as a result of its inability to meet financial obligations. Since 2008/09,
guaranteed debt and cover SAA has incurred net losses of over R32 billion. Government has set aside
debt-service costs R16.4 billion over the medium term for SAA to repay its guaranteed debt,
and cover debt-service costs. Government anticipates that additional
funding will be required to cover restructuring costs in line with the
business rescue plan.
South African Express
Government needs to assess SA Express, illiquid and insolvent, is unable to settle either short- or long-
its appetite for continued term obligations as they become due. Cumulative losses amount to
ownership of SA Express R1.2 billion over the past 10 years. The airline was recently placed under
involuntary business rescue, which it intends to appeal. Government will
need to assess its appetite for continued ownership of the carrier, given
that it has a limited role in the local aviation market.
Denel
Denel’s role in a modern Denel, the state-owned military and aerospace equipment manufacturer,
defence industry needs to be faces serious liquidity problems. In response, government provided Denel
defined with R1.8 billion in 2019/20. State guarantees granted to the entity amount
to R6.9 billion. Additional funding of R576 million is allocated for 2020/21.
This support is allocated with conditions that emphasise the need for Denel
to speedily implement its turnaround plan. The plan includes exploring
private-sector participation, optimising its property and plant, and
developing an appropriate funding model. It is critical for government to
define Denel’s role in a modern defence industry.
South African Broadcasting Corporation
Government allocated Government allocated R3.2 billion to the SABC in 2019/20, of which
R3.2 billion to SABC in 2019/20 R2.1 billion has been transferred, to enable the broadcaster to pay its bills.
to enable it to pay its bills The conditions included reviewing broadcasting sector policies to respond
to advances in technology, costing the developmental mandate and
evaluating opportunities for private-sector participation. The remaining
R1.1 billion is expected to be transferred to the SABC by 31 March 2020.
94CHAPTER 8: FINANCIAL POSITION OF PUBLIC-SECTOR INSTITUTIONS
Development finance institutions
To support government in achieving inclusive growth and the objectives of
the National Development Plan, development finance institutions require
supportive governance structures, financial sustainability and
developmental impact. They also require strong capacity.
The net asset value of the three largest development finance institutions – Combined net asset value of
the DBSA, IDC and Land Bank – increased by 4.7 per cent in 2018/19 to DBSA, IDC and Land Bank
R139.4 billion. The institutions transitioned to the International Financial increased by 4.7 per cent in
Reporting Standard 9 during the period, which resulted in higher 2018/19
impairments, causing a slight decrease in net loan books.
Table 8.4 Financial position of selected development finance institutions
R billion 2016/17 2017/18 2018/19
IDC
Total assets 129.8 137.0 144.6
Loan book 26.7 30.7 25.9
Equity and other investments 103.1 106.3 118.7
Total liabilities 41.5 44.9 49.3
Net asset value 88.3 92.1 95.3
DBSA
Total assets 83.7 89.2 89.5
Loan book 76.6 75.0 75.8
Equity and other investments 7.1 14.2 13.7
Total liabilities 51.6 54.9 52.3
Net asset value 32.1 34.3 37.2
Land Bank
Total assets 45.4 49.5 52.4
Loan book 41.0 43.4 44.5
Equity and other investments 4.4 6.1 7.9
Total liabilities 39.0 42.8 45.5
Net asset value 6.4 6.7 6.9
Source: National Treasury
Land Bank
The Land Bank supports development and transformation of the
agricultural sector. In 2018/19, it disbursed R5.1 billion of developmental
and transformational loans, significantly up from R1.6 billion in 2017/18.
The bank is refocusing on the development of smallholder farmers and
aims to adopt financially and economically sustainable practices. During
2018/19, the Land Bank used R377.4 million of the R400 million joint Land
Bank/IDC drought relief fund to provide low-interest loans to affected
areas. In addition, it agreed with the Jobs Fund to provide concessional
credit and support to small- and medium-scale emerging farmers.
Industrial Development Corporation
The IDC finances industrial development across Africa. Over the medium IDC approved R13.1 billion in
term, it will focus on financing and facilitating the adoption of emerging financing in 2018/19, down
technologies and creating new industries. In 2018/19, the IDC approved from R16.7 billion a year
funds totalling R13.1 billion, compared with R16.7 billion in 2017/18, and earlier
disbursed funds of R11.8 billion, compared with R15.4 billion in 2017/18.
The corporation’s profits decreased by 78 per cent from R3.2 billion in
952020 BUDGET REVIEW
2017/18 to R720 million in 2018/19, mainly due to higher once-off capital
gains recorded in 2017/18.
In 2015/16, the IDC set a five-year target to approve R23 billion for black
industrialists; by 2018/19, it had approved R21.4 billion for such projects.
This programme is expected to create about 22 600 jobs.
Development Bank of Southern Africa
DBSA’s developmental loan The DBSA finances infrastructure projects in water, sanitation,
book rose marginally to communication, energy and school infrastructure across southern Africa.
R75.8 billion It also assists with project preparation and implementation. The DBSA’s
profit increased from R2.3 billion in 2017/18 to R3.1 billion in 2018/19,
mainly due to interest income, and gains from foreign exchange and
financial instruments. During the year, its developmental loan book rose
marginally from R75 billion to R75.8 billion.
Development finance borrowing requirement
Development finance In 2018/19, the three development finance institutions borrowed
borrowing rose significantly in R56.3 billion, significantly more than the budgeted R45.4 billion. The
2018/19, largely as result of difference is attributable to a steep increase in borrowing by the Land
Land Bank lending Bank, which was used to support its lending activities. The Land Bank and
the DBSA account for 82.4 per cent of development finance borrowing.
Over the medium term, borrowing plans total R90.7 billion. In 2018/19,
nearly 90 per cent of borrowing was in domestic debt.
Table 8.5 Borrowing requirement for development finance institutions1
2017/18 2018/19 2019/20 2020/21 2021/22 2022/232
R billion Budget Outcome Budget Outcome Revised Medium-term estimates
Domestic loans (gross) 51.1 54.0 36.2 50.6 39.8 26.8 31.1 6.0
Short-term 36.2 39.0 23.9 23.1 20.3 20.9 20.8 1.0
Long-term 14.9 15.0 12.3 27.5 19.5 5.9 10.3 5.0
Foreign loans (gross) 9.3 5.6 9.2 5.7 18.0 14.4 9.6 2.8
Long-term 9.3 5.6 9.2 5.7 18.0 14.4 9.6 2.8
Total 60.4 59.6 45.4 56.3 57.8 41.2 40.7 8.8
Percentage of total:
Domestic loans 84.6% 90.6% 79.7% 89.9% 68.9% 65.0% 76.4% 68.2%
Foreign loans 15.4% 9.4% 20.3% 10.1% 31.1% 35.0% 23.6% 31.8%
1. Land Bank, DBSA and IDC
2. Land Bank and DBSA not included, as no forecast was provided
Source: National Treasury
Social security funds
Social security funds, financed through levies and taxes, provide insurance
for unemployed workers and those injured in road or workplace accidents.
Over the medium term, these funds expect to collect R238 billion in
contributions and pay R211 billion in benefits. The scale of Road Accident
Fund (RAF) liabilities, however, means that the combined financial position
of the social security funds is deeply negative.
Combined R3.3 billion cash In 2018/19, the funds had a combined cash surplus of R6.8 billion. Over the
deficit over medium term is a medium term, however, the funds will have an average combined cash
result of RAF liabilities deficit of R3.3 billion, as benefits paid out by the Unemployment Insurance
Fund (UIF) increase following legislative amendments.
96CHAPTER 8: FINANCIAL POSITION OF PUBLIC-SECTOR INSTITUTIONS
Table 8.6 Financial position of social security funds
2016/17 2017/18 2018/19 2019/20 2020/21 2021/22 2022/23
R billion Outcome Estimate Medium-term estimates
Unemployment Insurance Fund
Total assets 139.5 159.3 165.5 174.1 182.8 191.5 200.7
Total liabilities 6.4 13.4 21.2 22.3 23.4 24.5 25.7
Net asset value 133.1 145.9 144.3 151.8 159.4 167.0 175.0
1
Compensation Fund
Total assets 66.4 72.0 75.4 79.1 82.8 87.0 91.1
Total liabilities 18.5 38.5 47.8 49.8 51.8 54.2 56.6
Net asset value 47.9 33.5 27.6 29.3 31.0 32.8 34.5
Road Accident Fund
Total assets 9.2 9.8 11.2 11.5 11.7 11.8 11.9
Total liabilities 189.2 216.1 273.3 341.1 413.1 500.4 604.9
Net asset value -180.0 -206.3 -262.1 -329.6 -401.4 -488.6 -593.0
1. Compensation Commissioner for Occupational Diseases in Mines and Works
Source: National Treasury
Unemployment Insurance Fund
The UIF pays benefits to those who are out of work due to retrenchment, UIF maintains surplus, but
illness or maternity leave. Benefit payments are expected to grow from higher benefits will see it run
R11 billion in 2018/19 to R22 billion in 2022/23. Over this period, the fund cash deficit over medium term
will run an average surplus of R3.6 billion on an accrual basis and a cash
deficit. The latter is the result of retrospective payments to claimants who
were assessed and paid at a rate based on the old legislation, when they
were meant to be paid based on higher rates in the amended act. The
additional benefits are expected to cost R12.7 billion. The fund plans to
finalise these claims by 2020/21. The UIF’s net asset value is set to increase
from R144.3 billion in 2018/19 to R175 billion in 2022/23.
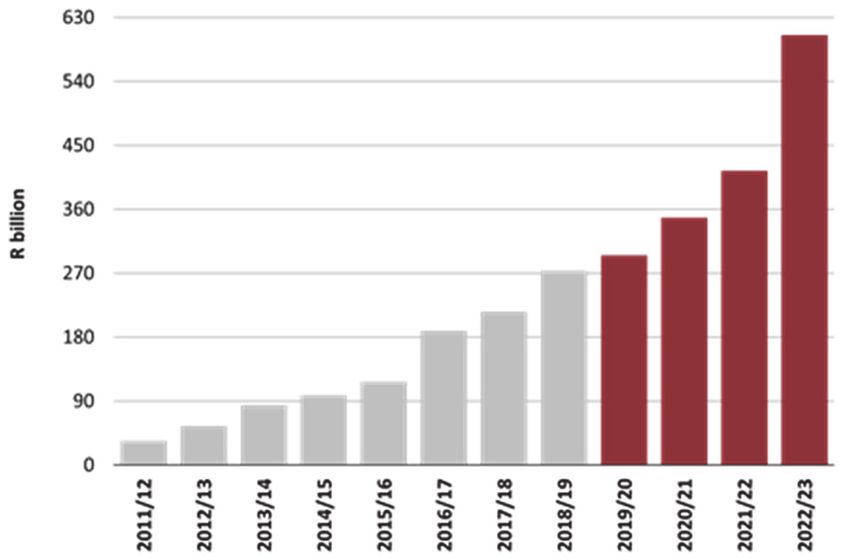
Road Accident Fund
Figure 8.4 RAF liabilities Figure 8.5 RAF annual deficit
Source: National Treasury
The RAF provides compensation for the loss of earnings, along with general
damages, and medical and funeral costs to victims of road accidents.
Claims against the fund are expected to increase from R96.4 billion in
2018/19 to R145.6 billion in 2022/23. The RAF’s revenues are insufficient
to meet its liabilities. Consequently, the accumulated deficit is forecast to
increase from R262.1 billion in 2018/19 to R593 billion in 2022/23. Over
the past 20 years, increases in the RAF levy have typically exceeded
972020 BUDGET REVIEW
inflation, yet the liabilities of the fund have grown at a faster pace. The RAF
fuel levy increases by 9c/litre on 1 April 2020.
Compensation Fund
The Compensation Fund provides compensation for disability, illness and
death resulting from occupational injuries and diseases. In 2018/19, the
fund paid out R3.9 billion in benefits and ran a surplus of R1.7 billion. Over
the medium term, the surplus is expected to average R2.5 billion due to
higher returns on investments. This will increase the fund’s net asset value.
Government Employees Pension Fund
In 2018/19, the GEPF provided retirement security to about 1.3 million
employees and 460 000 beneficiaries. Active membership has declined
slightly, reflecting government’s efforts to stabilise headcounts, while the
number of pensioners has remained relatively constant. The fund paid out
benefits totalling R103 billion in 2018/19. Contributions received increased
from R70.4 billion in 2017/18 to R75.6 billion in 2018/19, largely due to
members’ annual salary increases. The cash revenue that the fund received
from its investments grew by 17 per cent in 2018/19 to R84.2 billion.
Table 8.7 Selected income and expenditure of GEPF
R billion 2012/13 2013/14 2014/15 2015/16 2016/17 2017/18 2018/19
Revenue
Employer contributions 30.8 33.5 36.1 38.6 42.1 45.3 48.7
Employee contributions 17.1 18.7 20.3 21.7 23.4 25.1 26.9
1
Investment income 49.9 54.0 68.5 69.0 69.5 72.0 84.2
Expenditure
Benefits paid 43.2 57.9 85.8 83.1 88.3 94.9 102.5
1. Dividends on listed equities, interest on bonds and money market instruments and income from unlisted properties
and unlisted investments excludes adjustments for value of financial assets
Source: Government Pensions Administration Agency
The Public Investment Corporation invests the excess funds accumulated
by the GEPF and the social security funds. At end-March 2019, it had
R2.13 trillion in assets under management. A commission of inquiry was
appointed to investigate allegations of impropriety in 2018. The
commission has submitted its final report to the President. In the interim,
the Minister of Finance has reconstituted the corporation’s board.
Table 8.8 Breakdown of assets under management by PIC, 2018/19
Government
Unemployment Compensation
Employees 1 Other Total
Insurance Fund Fund
R billion Pension Fund
Asset class
Equity 1 032.4 40.0 16.2 – 1 088.7
Bonds 574.9 89.5 41.5 13.1 719.1
Money market 75.1 18.4 8.5 34.0 136.0
Property 95.4 4.8 0.1 1.4 101.6
Unlisted investments 70.9 13.6 1.9 – 86.4
Total 1 848.7 166.3 68.2 48.5 2 131.7
1. Includes the Compensation Pension Fund
Source: Public Investment Corporation and National Treasury
98You can also read