Macquarie Korea Infrastructure Fund
←
→
Page content transcription
If your browser does not render page correctly, please read the page content below
Macquarie Korea Infrastructure Fund
   2021 1st Quarter Asset Management Report

     Name
     Macquarie Korea Infrastructure Fund (MKIF)
     Period Quarter 1 (1 January 2021 - 31 March 2021)
     Prepared by Macquarie Korea Asset Management Co., Ltd. (MKAM)
     Fund code: 35801

WS:MSIM_Seoul:1485867:v1
Page 2 of 19 Important notice Under the Financial Investment Services and Capital Markets Act (the “Act”), Macquarie Korea Infrastructure Fund (“MKIF”) is required to upload an Asset Management Report at MKIF website, in the form and containing specific information set out in the Act, on a quarterly basis. This Asset Management Report has been prepared by MKIF in compliance with its statutory obligations. Disclaimer MKIF and Macquarie Korea Asset Management Co., Ltd. (“MKAM”), are not an authorised deposit-taking institution for the purposes of the Banking Act 1959 (Commonwealth of Australia) and its obligations do not represent deposits or other liabilities of Macquarie Bank Limited ABN 46 008 583 542 (MBL). MBL does not guarantee or otherwise provide assurance in respect of the obligations of MKIF/ MKAM. Neither MKIF, nor any member of the Macquarie Group companies, including MKAM, guarantees the performance of MKIF, the repayment of capital or the payment of a particular rate of return on MKIF securities. General advice warning The contents of this report do not constitute an offer, invitation or recommendation for the subscription or purchase of securities. It does not take into account the investment objectives, financial situation and particular needs of the investor. Before making an investment in MKIF, the investor or prospective investor should consider whether such an investment is appropriate to their particular investment needs, objectives and financial circumstances and consult an investment adviser if necessary.
Page 3 of 19

Contents

           Important notice…………………………………………………………………………………………2
           Table of contents………………………………………………………………………………………..3
           1.       General Report ................................................................................................................ 4
                    1.1       Overview ............................................................................................................... 4
                    1.2       Asset Details ......................................................................................................... 5
           2.       Management performance and term performance .......................................................... 6
                    2.1       Overview ............................................................................................................... 6
                    2.2       Management plan ................................................................................................. 6
                    2.3       Management performance .................................................................................... 6
                    2.4       Profit and Loss summary ...................................................................................... 7
           3.       Details of assets .............................................................................................................. 8
                    3.1       Asset portfolio ....................................................................................................... 8
                    3.2       Top ten invested assets ........................................................................................ 8
                    3.3       MKIF’s asset portfolio details ................................................................................ 9
           4.       Registered asset managers ........................................................................................... 11
                    4.1       Registered infrastructure asset managers .......................................................... 11
                    4.2       Change in registered infrastructure asset managers .......................................... 11
           5.       Cost summary ................................................................................................................ 12
                    5.1       Fees to service providers .................................................................................... 12
                    5.2       Total expense ratio.............................................................................................. 12
           6.       Invested asset transactions and debt facility ................................................................. 13
                    6.1       Equity transactions .............................................................................................. 13
                    6.2       Equity turnover ratio during the past three quarters ............................................ 13
                    6.3       Loan sales ........................................................................................................... 13
                    6.4       Loan injections .................................................................................................... 13
                    6.5       Debt facility status ............................................................................................... 13
                    6.6       Corporate bond status......................................................................................... 14
           7.       Notice ............................................................................................................................. 14
           Appendix I. MKIF Board of Directors ........................................................................................ 16
           Appendix II. Summary of Financial Statements........................................................................ 17
Page 4 of 19
1. General Report
1.1 Overview
Under the Financial Investment Services and Capital Markets Act (the Act)
Investment Grade: 4*
Fund name Macquarie Korea Infrastructure Fund (MKIF)
Fund type Investment company/Special asset fund/Closed-end with an option for new share issuance
Fund code 35801
Date of incorporation 12 December 2002
Date of registration 26 December 2002
Date of listing 15 March 2006
Financial year end 31 December every year
Fund maturity Perpetual (until the occurrence of dissolution events defined in the Articles of Incorporation
of MKIF)
Asset manager Macquarie Korea Asset Management Co., Ltd. (MKAM)
Sales agents The shares of the MKIF have been listed on Korea Exchange stock market. An investor
may trade the shares through the account opened at a registered securities firm.
Custodian Korea Securities Finance Corporation (KSFC)
Fund administrator Hana Investors Service Co., Ltd.
Board of directors ^ Corporate Director: MKAM
Supervisory Directors: Woo Young Jung, Hwa Jin Kim and Daeki Kim
Key staff of MKAM ^ Boum Sik Suh (CEO)
Jinwook Park (Fund Management)
Do Kyung Kim (Legal)
Ju Dong Kim (Finance)
Ronnie Kim (Risk Management)
Dae Sung Lee (Compliance)
MKIF profile MKIF, managed by MKAM, has the portfolio of infrastructure assets in Korea that have
been, or are being, constructed under the Act on Public-Private Partnerships in
Infrastructure (PPI Act).
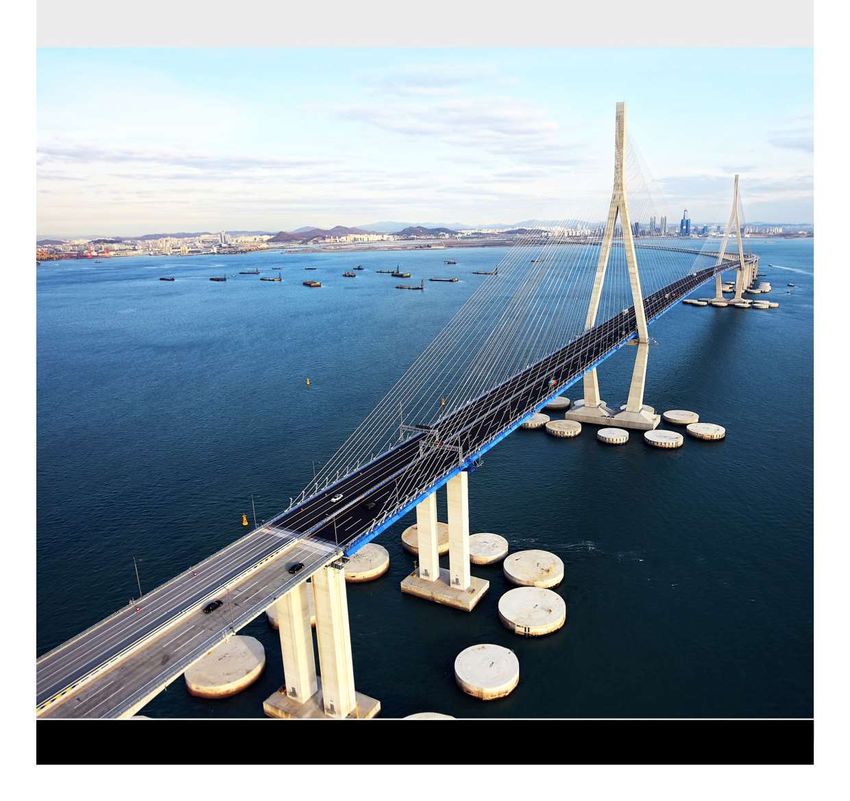
MKIF was established in December 2002 with a mandate to invest in entities that construct
or operate infrastructure businesses such as toll roads, bridges and tunnels in Korea.
MKIF invests in these infrastructure businesses through equity and debt. MKIF is focused
on generating profits from its investments and distributing these profits to its shareholders.
* MKAM assessed MKIF risk level, the investment grade, at 4 in consideration of MKIF’s target asset and associated risk. However, this is a subjective rating by MKAM and
should not be recognized as an official rating by any external rating agencies
^ See Section 4. Registered Asset Managers and Appendix I. MKIF Board of Directors for more information.Page 5 of 19
1.2 Asset Details
Under the Act, MKIF is required to report the net asset value per share (NAV per share) of its portfolio.
The total net asset value of MKIF’s portfolio is calculated by subtracting total liabilities from total assets of MKIF. MKIF’s assets
include its equity and debt investments in concession companies, cash and deposits and other investment securities. The net
asset value per share of MKIF is calculated by dividing total net asset value by the number of outstanding shares.
The Collective Investment Property Appraisal Committee of MKAM has chosen to adopt the acquisition cost as its assessment
of fair value for the unlisted equity investments under the Act and accounting principles generally accepted in Korea (K-GAAP).
In addition, the debt investments are measured at amortised cost under the Act and K-GAAP.
The calculation of the NAV per share of MKIF is set out in the table below. For the purposes of this calculation, asset and
liability information is based on the balance sheet of MKIF, which is attached as Appendix II.
(Unit: KRW, share)
Type Q4 2020 Q1 2021 % Change
Total Assets (A) 2,333,888,149,485 2,351,444,829,660 0.75%
Total Liabilities (B) 216,764,173,142 215,020,760,554 -0.80%
Net Asset Value (C=A-B) 2,117,123,976,343 2,136,424,069,106 0.91%
Shares (D) 372,192,485 372,192,485 0.00%
NAV per share (E=C/D) + 5,688.25 5,740.11 0.91%
+ NAV per share of MKIF is calculated by dividing total net asset value by the number of outstanding shares. However, as MKIF is listed on the Korea Exchange, its shares
are traded at share price.
^ MKIF completed follow-on public offering of 23,148,149 of common shares at the price of KRW 10,550 per share in 4Q 2020. NAV has been increased by KRW
241,902,247,437 net of issuance cost KRW 2,310,724,513. For details, refer to MKIF disclosure on 29 October 2020.
※ Distribution payment (during the Third quarter)
(Unit: KRW, share)
NAV per share
Balance after
Distribution Amount Payment
Date of Declaration (KRW Million) (Shares) Before declaration After declaration Remarks
2021-01-29 133,989 372,192,485 5,724.22 5,365.48Page 6 of 19
2. Management Performance and Term
Performance
2.1 Overview
Established on 12 December 2002, MKIF is a leading private sector infrastructure investor in Korea under the PPI Act and
governed by the Act. MKIF is mandated to invest in concession companies that construct or operate infrastructure assets
through equity and debt. MKIF is focused on generating profits from its investments and distributing these profits to its
shareholders. As of 31 December 2020, MKIF has committed to invest in 12 toll roads, 1 light rail transit and 1 port with a total
investment commitment of KRW 1,811.1 billion.
2.2 Management plan
MKIF is focusing on investments in loans to, and unlisted equity of, concession companies that operate infrastructure assets
under concessions from Korean central, provincial or city governments throughout the country.
Target assets for infrastructure investment in Korea have historically been concessionaires operating toll roads, bridges, and
tunnels, etc. Target portfolio company is an entity conducting facilities projects defined under Article 2 Sub-paragraph 1 of the
PPI Act.
MKIF is to invest in entities that develop and/or operate Infrastructure Assets and to target to generate stable returns to our
shareholders through capital growth and cash distribution.
2.3 Management performance
The table below sets out the historical NAV (including the distribution paid) for MKIF. As explained above and given that the
majority of MKIF’s assets are held at their acquisition cost, the net asset value is not representative of changes in the value of
the MKIF portfolio.
A. Short-term performance
(Unit: %)
Type 3 Months 6 Months 9 Months 12 Months
MKIF 7.93 10.54 12.38 14.79
Comparative Index + N/A
+ There is no comparable index available because MKIF is the only listed infrastructure fund in Korea with publicly available NAV data.
※ Performance quoted above is historical and does not guarantee future performance.
※ NAV increase by the follow-on public offering in 4Q 2020 and 3Q 2017 is not reflected in Long-term performance calculation.
B. Long-term performance
(Unit: %)
Type 1 Year 2 Years 3 Years 5 Years
MKIF 14.79 12.67 12.79 12.46
Comparative Index ^ N/A
^ There is no comparison index available because MKIF is the only listed infrastructure fund in Korea with publicly available NAV data.
※ Performance quoted above is historical and does not guarantee future performance.
※ NAV increase by the follow-on public offering in 4Q 2020 and 3Q 2017 is not reflected in Long-term performance calculation.Page 7 of 19
2.4 Profit and Loss summary
The table below sets out the profit and loss incurred by MKIF in its P&L during the Quarter, in comparison with any profit and
loss from the previous quarter.
(Unit: KRW million, %)
Equity(unlis Dividend Short-term Facilities
Type ted) Loans Income & Deposit Other Assets Total Profit (Loss)
Q1 2021 53,822 110,350 14 1 164,187
Q4 2020 54,374 4,875 10 45 59,304
2.5 Environmental, Social and Governance (ESG)
MKAM, as an affiliate of the Macquarie Group (Macquarie) and in a capacity as a manager and corporate director of MKIF, has
adopted ESG framework that Macquarie Infrastructure and Real Assets (MIRA) applies to its fund management activities to the
extent relevant and possible. MIRA(Macquarie Infrastructure and Real Assets) aims to improve the sustainability performance
of portfolio companies by addressing material ESG issues and opportunities to enhance long-term value for our investors. MIRA
addresses a broad range of ESG risks and opportunities throughout the entire investment lifecycle from screening and due
diligence through to ongoing asset management and exit. We also regularly collect a range of ESG data from portfolio
companies, allowing us to track and support improvement of their ESG performance. ESG information is communicated to
investors at least annually in fund reports provided to investors, within fund investor presentations and during one-on-one
investor meetings. We are committed to continuously improving our ESG performance and look forward to continuing to share
our progress with investors.
Macquarie Asset Management (MAM) climate change commitment
As long-term investors in companies that underpin economies and communities, we take our responsibility to address climate
change risks seriously. As stewards of these vital businesses, we have a duty to ensure they play their part in global efforts to
address our warming planet.
Macquarie Group is supporting the transition to a low carbon economy by progressing a range of initiatives to mitigate climate
change and adapt to its effects. On the fifth anniversary of the Paris Agreement, MIRA's parent company, Macquarie Asset
Management (MAM), announced a commitment to manage its global portfolio in line with net zero emissions by 2040.
The public commitment articulated our goal to implement Paris-aligned or net zero business plans at each of our fund portfolio
companies by the end of 2022. This commitment has several steps that are already underway:
measure greenhouse gas emissions of all portfolio companies;
identify pathways to reduce emissions;
develop business plans that contribute to a net zero economy by 2040, or sooner;
for new investments, target completion of these steps within 24 months of acquisition;
work with portfolio companies with the aim that they will be meeting their Paris-aligned/net zero emissions reduction
pathways by 2030; and
report on our progress annually.
This detailed commitment complements extensive activity across the broader Macquarie Group in developing and managing
renewable energy projects, helping clients on their decarbonisation pathways, and adapting infrastructure for climate resilience.
We look forward to working with our investors, portfolio companies, regulators and other stakeholders to achieve these
transformational objectives for the benefit of all. We remain grateful for these partnerships and we welcome continued
engagement as we seek to play our part in building a more sustainable future for everyone.
Please visit MIRAFunds.com for more detail regarding our climate change commitment as well as our approach to ESG,
sustainability and responsible investment.Page 8 of 19
3. Details of Assets
3.1 Asset portfolio
MKIF’s investment portfolio consists of equity(unlisted), loans, cash and deposits and other assets.
(Unit: KRW million, %)
Short-term facilities
Type Equity (unlisted) Loans + & Deposit Other assets ^ Total assets
KRW 463,910 1,265,749 65,731 556,055 2,351,445
Composition Ratio 19.73 53.83 2.80 23.65 100
+ Include loans to concession companies
^ Other assets: interest receivable, other receivables and prepaid expenses
23.65%
19.73%
2.80% Equity (Unlisted)
Loan
Short-term facilities & Deposit
Other asset
53.83%
3.2 Top ten invested assets
(Unit: KRW million, %)
Rank Type Name Acquisition Value + Composition Ratio ^
1 Subordinated loan Incheon Bridge Co., Ltd. 241,000 10.25
2 Subordinated loan BNCT Co., Ltd. 193,000 8.21
3 Subordinated loan Cheonan-Nonsan Expressway Co., Ltd. 182,250 7.75
4 Subordinated loan Gyungsu Highway Co., Ltd. 99,633 4.24
5 Equity (unlisted) Cheonan-Nonsan Expressway Co., Ltd. 93,815 3.99
6 Subordinated loan Seoul-Chuncheon Highway Co.,Ltd. 87,450 3.72
7 Subordinated loan MCB Co., Ltd. 79,000 3.36
8 Subordinated loan Seoul-Chuncheon Highway B Co.,Ltd. 74,327 3.16
9 Senior loan Kwangju Beltway Investment Co., Ltd. 74,325 3.16
10 Subordinated loan Busan New Port The 2nd Rear Road Co,.Ltd. 69,226 2.94
+ Under K-GAAP and the Act, MKIF recognizes the value of its equity investments in concession companies at their acquisition costs including transaction costs
^ Ratio refers to the contribution to total assetsPage 9 of 19
3.3 MKIF’s asset portfolio details
A. Equity securities (unlisted) (top five assets)
(Unit: Share, KRW million, %)
No. of Percentage Acquisition Appraisal Gain/ Loss Composition
Name Shares Interest Value (A) Value (B) + (B)-(A) Ratio ^
Cheonan-Nonsan Expressway Co., 17,550,000 60% 93,815 93,815 -
3.99
Ltd.
BNCT Co., Ltd. 13,284,000 30% 67,048 67,048 - 2.85
Incheon Bridge Co., Ltd. 7,826,100 64.05% 58,053 58,053 - 2.47
Gyungsu Highway Co., Ltd. 10,319,853 43.75% 52,095 52,095 - 2.22
Soojungsan Investment Co., Ltd. 1,114,880 100% 47,248 47,248 - 2.01
+ Under K-GAAP and the Act, MKIF records the value of its equity investments in concession companies at their acquisition costs including transaction costs
^ Ratio refers to the contribution to total assets
B. Equity securities (unlisted) (more than 1% of total issued shares)
(Unit: Share, KRW million, %)
No. of Percentage Acquisition Appraisal Gain/ Loss Compositio
Shares Interest Value (A) Value (B) + (B)-(A) n
Name Ratio ^
Cheonan-Nonsan Expressway Co., 17,550,000 60% 93,815 93,815 -
3.99
Ltd.
BNCT Co., Ltd. 13,284,000 30% 67,048 67,048 - 2.85
Incheon Bridge Co., Ltd. 7,826,100 64.05% 58,053 58,053 - 2.47
Gyungsu Highway Co., Ltd. 10,319,853 43.75% 52,095 52,095 - 2.22
Soojungsan Investment Co., Ltd. 1,114,880 100% 47,248 47,248 - 2.01
MCB Co., Ltd. 7,955,780 70% 33,925 33,925 - 1.44
Kwangju Beltway Investment Co., 6,610,000 100% 33,050 33,050 -
1.41
Ltd.
Kwangju Ring Road Co., Ltd. 5,775,000 75% 29,495 29,495 - 1.25
New Airport Hiway Co., Ltd. 3,665,273 24.10% 25,235 25,235 - 1.07
nd
Busan New Port 2 Rear Road 8,295,138 47.56% 18,873 18,873 - 0.80
Dongbuk Light Rail Transit 483,800 4.65% 2,419 2,419 - 0.10
Seoul-Chuncheon Highway Co.,Ltd. 3,128,435 15.83% 1,423 1,423 - 0.06
Baekyang Tunnel Ltd. 100,000 100% 1,231 1,231 - 0.05
Woomyunsan Infraway Co., Ltd. * 835,200 36% - - - -
+ Under K-GAAP and the Act, MKIF recognizes the value of its equity investments in concession companies at their acquisition costs including transaction costs
^ Ratio refers to the contribution to total assets
* Woomyunsan Infraway Co., Ltd. completed its capital reduction on 16 January 2009 and on 16 February 2016. The value of equity investment in Woomyunsan Infraway Co.,
Ltd. was recognised as zero because the total proceeds of capital reduction paid to MKIF exceeded the acquisition value of the equity investment. For details, refer to MKIF
disclosure on 14 January 2016.Page 10 of 19
C. Loans to concession companies (top five assets)
(Unit: KRW million, %)
Acquisition Interest Issued Maturity Guarantee Credit
Name Value Receivable + Date Date Rating
Incheon Bridge Co., Ltd.
241,000 44,767 18/08/2017 18/11/2037 N/A N/A
(Subordinated loan)
BNCT Co., Ltd.
193,000 370,162 25/02/2008 25/11/2032 N/A N/A
(Subordinated loan)
Cheonan-Nonsan Expressway Co., Ltd.
182,250 28,831 20/05/2005 20/05/2029 N/A N/A
(Subordinated loan)
Gyungsu Highway Co., Ltd.
99,633 46,076 29/10/2015 29/07/2039 N/A N/A
(Subordinated loan)
Seoul-Chuncheon Highway Co.,Ltd.
87,450 427 02/11/2006 28/05/2031 N/A N/A
(Subordinated loan)
+These values are accumulated interest receivables
D. Short term facilities and deposit
(Unit: KRW million, %)
Interest Composition
Name* Banks Deposit amount + Date of Deposit Maturity Date Receivable Ratio ^
N/A
* Each deposit amount exceeding 5% of the Total Assets
+ This value is the principal
^ Ratio refers to the contribution to total assets
E. Other assets
The other assets are set out in the table below and consist of accrued income.
(Unit: KRW million, %)
Type Amount Composition Ratio ^
Interest Receivable and others* 556,054 23.65
* Other assets under the invested assets composition (ex: accrued dividends, accrued income etc), exceeding 5% of the total assets
^ Ratio refers to the contribution to total assets
For more information, refer to Quarterly Business Reports and Documents of Settlement of Accounts on the website of KOFIA
(http://dis.kofia.or.kr). However, the effective dates of the Quarterly Business Reports and Documents of Settlement of
Accounts on the website of KOFIA may be different from the effective dates of this report.Page 11 of 19
4. Registered Asset Managers
4.1 Registered infrastructure asset managers*
MKAM is licensed under the Act to carry out asset management activities for MKIF. MKAM employs at least two infrastructure
asset management professionals who meet certain qualifications as follows.
Management fund other than MKIF Fund with performance fee scheme
KOFIA
Name registration Title
number Number of Total asset under Number of Total asset under
fund(s) management fund(s) management
Division
Jinwook Park 2115000350 N/A N/A N/A N/A
Director
Associate
Jae Woo Jung 2110000811 N/A N/A N/A N/A
Director
* For more details, refer to current MKIF prospectus disclosed on DART (http://dart.fss.or.kr) fund disclosure. The prospectus translated in English can be found in MKIF
website (www.macquarie.com/mkif).
4.2 Change in registered infrastructure asset managers
Period ^ Registered asset managers
October 2019 ~ Present Jaw Woo Jung, Jinwook Park
February 2019 ~ September 2019 Jae Woo Jung, Boum Sik Suh, Yoonsik Pak ( ~ March 2019)
March 2016 ~ February 2019 Yoonsik Pak, Jae Woo Jung
^ Change in registered asset managers during the past three years.
For more information, refer to ad-hoc disclosures on the website of KOFIA (http://dis.kofia.or.kr). However, the effective dates
of information displayed on the website of KOFIA may be different from the effective dates of information in this report.Page 12 of 19
5. Cost Summary
5.1 Fees to service providers
The table below sets out fees paid by MKIF to its service providers.
(Unit: KRW million, %)
Q4 2020 Q1 2021
Type Amount Ratio+ Amount Ratio+ Remarks
MKIF Management fee 8,329 0.444 8,670 0.415 Management
Sales agent fee - - - -
Custodian fee 95 0.005 103 0.005
Administrator fee 59 0.003 64 0.003
Total 8,483 0.452 8,837 0.423
Other expenses^ 496 0.026 311 0.015
Transaction fee - - - -
Securities transaction - - - -
+ Ratio refers to fees as a proportion of Net Asset Value
^ Other expenses include fund audit fee, fund settlement fee and other recurring expenditures other than transaction fee. Excluding transaction fee
5.2 Total expense ratio
(Unit: annualised, %)
Collective Investment Vehicle
Type Total Expense Ratio* Commission Ratio
MKIF Q4 2020 1.8985 -
Q1 2021 1.7775 -
* Total Expense ratio refers to a ratio calculated by dividing the total management fee and other expenses borne by the collective investment vehicle by annual average
balance of the fund (before deducting the fees and expenses) and represents the total fees and expenses borne by the investor during the management periodPage 13 of 19
6. Invested Asset Transactions and Debt
Facility
6.1 Equity transactions
(Unit: annualised, %)
Buy Sell Turnover Ratio+
Shares Amount Shares Amount Q4 2020 Annualised rate
- - - - - -
+ The Turnover Ratio shows frequency level for the equity transactions. The ratio refers to average disposal amounts divided by average retained equity amounts during the
period. Provided that the average equity investment is 10 billion and the average equity disposal amount is 10 billion, turnover ratio is 100%. High turnover ratio will increase
fund cost.
6.2 Equity turnover ratio during the past three quarters
(Unit: %)
Q3 2020 Q4 2020 Q1 2021
- - -
6.3 Loan sales
(Unit: KRW million)
Name Type Date Amount
N/A
6.4 Loan injections
(Unit: KRW million)
Name Type Date Amount
N/A
6.5 Debt facility status
(Unit: KRW million)
Name Debt facility amounts
Limit of the Cumulative to Movements in Cumulative to
Facility+ Q4 2020 Q1 2021 Q4 2020
Shinhan Bank 60,000 - - -
Samsung Fire & Marine Insurance 50,000 - - -
Industrial and Commercial Bank of China 50,000 - - -
National Agricultural Cooperative Federation 30,000 - - -
Mirae Asset Life Insurance 60,000 - - -
Total 250,000 - - -
+ MKIF refinanced its corporate debt facility (“New Facility”) on 28 January 2019 and repaid the previous corporate debt facility (“Precious Facility”). The New Facility limit of
KRW 250 billion will remain the same with the Previous Facility. For details, refer to MKIF disclosure on 28 January 2019Page 14 of 19
6.6 Corporate bond status
(Unit: KRW million)
Name Par Value Interest rate Issue Date Maturity Date Credit
Rating
Unsecured Bond Tranche 2-1 (5year) 100,000 2.980 11/06/2018 11/06/2023 AA0
Unsecured Bond Tranche 2-2 (7year) 100,000 3.205 11/06/2018 11/06/2025 AA0
+ MKIF issued KRW 200 billion of unsecured, fixed-rate bonds to repay the KRW 190 billion of short-term loan executed on 31 May 2018. For more information, please refer
to the disclosure on 11 June 2018
7. Environmental, Social and Governance (ESG)
MKAM, as an affiliate of the Macquarie Group (Macquarie) and in a capacity as a manager and corporate director of MKIF, has
adopted ESG framework that Macquarie Infrastructure and Real Assets (MIRA) applies to its fund management activities to the
extent relevant and possible. MIRA aims to improve the sustainability performance of portfolio companies by addressing
material ESG issues and opportunities to enhance long-term value for our investors. MIRA addresses a broad range of ESG
risks and opportunities throughout the entire investment lifecycle from screening and due diligence through to ongoing asset
management and exit. MIRA also regularly collect a range of ESG data from portfolio companies, allowing us to track and
support improvement of their ESG performance. ESG information is communicated to shareholders at least annually in fund
reports and fund presentations. MKAM is committed to continuously improving our ESG performance and look forward to
continuing to share our progress with investors.
Macquarie Asset Management (MAM) climate change commitment
As long-term investors in companies that underpin economies and communities, MIRA take our responsibility to address
climate change risks seriously. As stewards of these vital businesses, MIRA have a duty to ensure they play their part in global
efforts to address our warming planet.
Macquarie Group is supporting the transition to a low carbon economy by progressing a range of initiatives to mitigate climate
change and adapt to its effects. On the fifth anniversary of the Paris Agreement, Macquarie Asset Management (MAM), which
MIRA belongs to as one of its business group, announced a commitment to manage its global portfolio in line with net zero
emissions by 2040.
The public commitment articulated our goal to implement Paris-aligned or net zero business plans at each of our fund portfolio
companies by the end of 2022. This commitment has several steps that are already underway:
• measure greenhouse gas emissions of all portfolio companies;
• identify pathways to reduce emissions;
• develop business plans that contribute to a net zero economy by 2040, or sooner;
• for new investments, target completion of these steps within 24 months of acquisition;
• work with portfolio companies with the aim that they will be meeting their Paris-aligned/net zero emissions reduction
pathways by 2030; and
• report on our progress annually.
This detailed commitment complements extensive activity across the broader Macquarie Group in developing and managing
renewable energy projects, helping clients on their decarbonisation pathways, and adapting infrastructure for climate resilience.
MIRA look forward to working with our investors, portfolio companies, regulators and other stakeholders to achieve these
transformational objectives for the benefit of all. MIRA remain grateful for these partnerships and MIRA welcome continued
engagement as MIRA seek to play our part in building a more sustainable future for everyone.
Please visit MIRAFunds.com for more detail regarding our climate change commitment as well as our approach to ESG,
sustainability and responsible investment.Page 15 of 19 8. Notice Under the Act, MKAM shall prepare this report and upload it on the website of MKIF and KOFIA after confirmation from the Custodian (KSFC). For more information on the website: MKIF www.mkif.com KOFIA http://dis.kofia.or.kr
Page 16 of 19
Appendix I. MKIF Board of Directors
Supervisory directors
Name Career
Woo Young Jung Attorney, Lee & Ko
Adjunct Professor, Graduate School of Law, Korea University
Outside Director, Hanjin Shipping
Arbitrator, Korean Commercial Arbitration Board
Committee Member, Policy Advisory Committee, Ministry of Oceans and Fisheries
Legal Advisor, Industrial Bank of Korea
Legal Advisor, Bank of Korea
Hwa Jin Kim Chairman of Proxy Voting Advisory Committee, Korea Corporate Governance Service
President of Seoul Corporate Governance Forum
Hyundai Heavy Industries Group independent director
Law School professor at Seoul National University
A foreign chair-professor of Law school, University of Michigan
Daeki Kim Outside Director of Doosan Heavy Industries & Construction Co., Ltd.
Advisor to Hanwha Life Insurance Co., Ltd.
Chief of Policy Staffs, Office of the President
Senior Secretary to the President for Economic Affairs, Office of the President
Vice Minister of Culture, Sports and Tourism
Commissioner of the Korea National Statistical Office
Head of National Budget Office, Ministry of Planning and Budget
Secretary to the President for Economic Affairs, Office of the President
Economist, World Bank
Deputy Director, Economic Planning Board
Corporate director – MKAM
Name Career
Boum Sik Suh Representative Director, Macquarie Korea Asset Management Co., Ltd. (“MKAM”)
Former Managing Director, Macquarie Korea Opportunities Management Limited
Joined Macquarie Infrastructure and Real Asset Division (MIRA) in 2003 and held various
roles mainly in infrastructure asset investment and transaction advisory in Hong Kong,
Singapore, Seoul and Japan
Yong Hwan Kim Country Lead of Macquarie Group Korea
Representative Director, Macquarie Korea Asset Management Co., Ltd.
Former Representative Director, Macquarie Korea Opportunities Limited prior to the
merger with MKAM
Joined Macquarie in 2002, previously held senior positions in Macquarie Capital Korea
and Macquarie Securities Korea Limited. (Investment Banking Division)
Do Kyung Kim Head of Legal, Macquarie Korea Asset Management Co., Ltd.
Former lawyer at Kim Chang & Lee and Yulchon
Attorney at law and a member of the Korea BarPage 17 of 19
Appendix II. Summary of Financial Statements
Statements of Financial Position
As of 31 March 2021, As of 31 December 2020 and 31 March 2020
(Unit: KRW million)
31 March 2021 31 December 2020 31 March 2020
Assets
Invested assets 1,795,390 1,801,033 1,686,484
Cash & deposits 65,731 71,362 51,847
Loans receivable 1,265,749 1,265,761 1,192,020
Equity securities 463,910 463,910 442,617
Others 556,055 532,855 454,669
Interest receivables 548,408 525,281 446,242
Other receivables 2,349 2,348 2,674
Prepaid expense 3,217 3,267 3,879
Prepayment 2,081 1,959 1,874
Total assets 2,351,445 2,333,888 2,141,153
Liabilities
Operational liabilities 199,671 199,644 254,700
Bond 199,671 199,644 199,563
Long-term debt - - 55,137
Others 15,350 17,120 14,775
Payables - 3 -
Management fee payable 8,670 8,329 8,192
Other liabilities 6,680 8,788 6,583
Total liabilities 215,021 216,764 269,475
Shareholders’ equity
Share capital 2,057,517 2,057,517 1,815,615
Retained earnings (accumulated deficit) 78,907 59,607 56,063
Total shareholders’ equity 2,136,424 2,117,124 1,871,678
Total liabilities and shareholders’ equity 2,351,445 2,333,888 2,141,153Page 18 of 19
Statements of Income
For the Quarters Ended 31 Mar 2021, 31 Dec 2020 and 31 Mar 2020
(Unit: KRW million)
Quarter Ended Quarter Ended Quarter Ended
31 Mar. 2021 31 Dec. 2020 31 Mar. 2020
Revenue 164,187 59,304 140,866
1. Interest income 53,836 54,384 49,607
2. Dividend Income 110,350 4,875 91,184
3. Other income 1 45 75
Expenses 10,898 11,905 10,770
1. Management fee 8,670 8,329 8,192
2. Custodian fee 103 95 91
3. Administrator fee 64 59 57
4. Interest expense 1,565 2,896 1,840
5. Other expense 496 526 590
Net income 153,289 47,399 130,096Corporate Directory Manager of MKIF Macquarie Korea Asset Management Co., Ltd. 18th Floor, Tower A, Centropolis Building, 26, Ujeongguk-ro, Jongno-gu,Seoul, 03161, KOREA Telephone +82 2 3705 8565 Facsimile + 82 2 3705 8596 MKIF Custodian Korea Securities Finance Corp. 10, Gookjegeumyoongro-8-gil, Yeoungdeungpo-gu, Seoul, 07330, KOREA Telephone + 82 2 3770 8800 Facsimile + 82 2 3770 8244 MKIF Administrator Hana Investors Service Co., Ltd. 10th Floor, 66 Eulji-ro, Jung-gu, Seoul, 04538, KOREA Telephone + 82 2 6714-4600 Facsimile + 82 2 6714-4800 WS:MSIM_Seoul:1485867:v1
You can also read