The State of Entrepreneurship in Montana - Montana Chamber of ...
←
→
Page content transcription
If your browser does not render page correctly, please read the page content below

The State of
Entrepreneurship in Montana
August 2018

Prepared by:                                  Prepared for:
Bureau of Business and Economic Research      Montana Chamber Foundation
University of Montana                                                  FY2012-2015
Missoula, Montana 59812

       BUREAU OF BUSINESS AND
       ECONOMIC RESEARCH
       U N I V E R S I T Y O F M O N TA N A
Acknowledgements

This report was produced and authored by Bryce Ward formerly of the University of
Montana’s Bureau of Business and Economic Research. All statements and conclusions
included in this report belong to the author and do not represent the position of the
University of Montana.

We would like to thank the following partners for supporting this research:

For more information, contact:
Bureau of Business and Economic Research
Gallagher Business Building, Suite 231
Missoula, MT 59812
(406) 543-5113
www.bber.umt.edu

or

Bryce Ward
ABMJ Consulting
(406) 219-0694
bward@abmjconsulting.com
www.abmjconsulting.com
Table of Contents
I. Introduction ....................................................................................................................................... 1
II. The entrepreneur’s role in a regional economy ................................................................... 1
III. Montana’s entrepreneurial ecosystem .................................................................................. 2
   A. Indicators of success ................................................................................................................................. 3
   B. Indicators of weakness ............................................................................................................................. 5

III. Montana Chamber of Commerce State of Entrepreneurship Indicators .................... 9
   A. Capital investment ..................................................................................................................................... 9
   B. Patents ......................................................................................................................................................... 10
   C. Entrepreneurial support ........................................................................................................................ 11
   D. Start-up employment .............................................................................................................................. 12

IV. Conclusion ...................................................................................................................................... 16
I. Introduction
    Montana receives many plaudits for its entrepreneurial culture. For several years,
Montana has ranked at, or near, the top of the prestigious Kauffman Index of
Entrepreneurship. Montana has more entrepreneurs per capita than any other state; it
continues to create more entrepreneurs than most states, and Montana’s business survival
rate (the share of new businesses who survive their first five years) ranks in the top 10.
These facts are encouraging. They suggest that Montana’s entrepreneurial ecosystem is
strong.

   However, a deeper dive into entrepreneurship data reveals a more complicated story.
Montana entrepreneurs tend to start very small businesses that do not scaleup quickly.
They are more likely to start seasonal businesses and/or businesses that serve only local
markets. They are less likely to have a patent, trademark, or copyright.

    Furthermore, consistent with national trends, entrepreneurship in Montana is waning.
The share of Montanans who own a business as their main job has fallen by nearly 50
percent since 1998. Similarly, the share of Montanans who work for young businesses has
fallen from roughly 20 percent in the 1990s to 12 percent in recent years.

  In this report, we provide a brief overview of entrepreneurship and entrepreneurs in
Montana. Then, we provide data on a handful of key indicators that speak to the state of
Montana’s entrepreneurial ecosystem.

II. The entrepreneur’s role in a regional economy

   A simple model of regional economic success argues that regions with greater capacity
do better. A region’s capacity depends on its stocks of the four forms of capital – natural,
physical, human, and social. As such, economists expect places with more valuable natural
resources, better physical infrastructure, more talented people, and better social networks
and institutions to perform better.

   However, capacity is insufficient for explaining performance. There is a fifth key
element to local economic success – the entrepreneur. Entrepreneurs are necessary. Each
region has some capacity to produce goods and services. Entrepreneurs are the people who

                          The State of Entrepreneurship in Montana                          1
figure out how to use the available capacity to create products or services that consumers
want.
For many years, economists (and others) ignored entrepreneurs.1 They assumed that
the supply of potential entrepreneurs was similar everywhere. If a region had more
opportunities, more entrepreneurs would emerge. However, over the past several decades,
appreciation for the role that entrepreneurs play has grown. Regions with more skilled
entrepreneurs may be more successful.2 That is, in two similar areas, the area with the
more skilled entrepreneurs may have better economic outcomes.
There are several reasons why the role for entrepreneurs has grown more salient. First,
in the knowledge economy, the success of many firms depends on the quality of the
founders’ idea. Many entrepreneurs have gained notirity for themselves and their
businesses due to the quality of the idea. This has increased awareness of entrepreneurs.
Furthermore, given that many knowledge industry firms can locate anywhere, the ability to
attract or create skilled entrepreneurs can directly boost a regional economy. Regions do
better if they have more people who both have good ideas and can execute them.
Second, the growth of the historic record has shown that local economic change is
inevitable. In all places, key industries inevitably wax and wane. Local entrepreneurs help
redirect existing capacity toward higher value uses. Areas with more and better
entrepreneurs tend to adjust more quickly and to be more successful.3
Thus, it is important for regions to create lots of potential entrepreneurs, to support
them as they pursue their ideas, and to reduce the set of local constraints that may limit
their ability to succeed. That is, it is important to create a viable entrepreneurial ecosystem.
III. Montana’s entrepreneurial ecosystem
Montana creates lots of entrepreneurs. As such, it seems fair to assume that Montana
has a relatively robust entrepreneurial ecosystem; however, other data suggests some
weaknesses.
1 Chinitz, B. (1961). Contrasts in agglomeration: New york and pittsburgh. The American Economic
Review, 51(2), 279-289.
2 Glaeser, E. L., Rosenthal, S. S., & Strange, W. C. (2010). Urban economics and entrepreneurship. Journal of
Urban Economics, 67(1), 1-14.
3 Gleaser et al (2010).
The State of Entrepreneurship in Montana 2A. Indicators of success
1. Montana has more entrepreneurs.4
The share of Montana’s population that owns a business as their main job is the highest
in the country. As of 2015, 10.2 percent of Montanans owned a business as their main job.
Nationally, only 6 percent of Americans owned a business as their main job. The rate of
business ownership in Montana was more than double the rate in 11 states.
Figure 1 – Share of working age population who own a business as their main job
Source: 2017 Kauffman Index of Mainstreet Entrepreneurship
2. Montana creates more new entrepreneurs.5
Consistent with its high rate of business ownership, Montanans become entrepreneurs
at a higher rate. Approximately 0.43 percent of Montanans become entrepreneurs each
month. This means that approximately 3,400 Montanans start a business each month.
Montana ranked 4th on this metric in 2016, and Montana ranked first on this metric in
2013, 2014, and 2015.
4 2017 Kauffman Index of Main Street Entrepreneurship Rate of Business Owners
5 2017 Kauffman Index of Startup Activity Rate of New Entrepreneurs
The State of Entrepreneurship in Montana 3This metric fluctuates over time. The share of Montanans who start a business each
month has ranges between 0.4 percent and 0.6 percent, but there is not a clear trend in
these data over the past 20 years.
3. New Montana firms survive.6
The five-year survival rate for new Montana firms is good. In 2016, 51.8 percent of
Montana firms formed in 2011 were still operating, this ranked 9th among all states.
Montana has ranked in the top 10 for survival rate in six of the last ten years. However, the
five-year survival rate fluctuates over time. Only 42 percent of Montana firms formed in
2009 survived their first five years. This ranked Montana in the bottom 12 states.
These indicators are consistent with a healthy entrepreneurial ecosystem. The fact that
a disproportionate share of people in Montana pursue entrepreneurship, and a majority of
them succeed at creating a business that survives at least five years indicates that at least
some parts of Montana’s entrepreneurial climate work well.
However, it is unclear exactly what drives these results. Economists have identified four
broad reasons why the supply of entrepreneurs may vary across place7:
(1) The returns to entrepreneurship vary: In places where pursuing entrepreneurship
generates a higher income relative to the alternative, more entrepreneurs will
emerge.
(2) Differential availability of the inputs to entrepreneurship: In places with better
access to capital, better access to key workers, better access to other inputs, or
simply better resources to learn how to be an entrepreneur, more people should
pursue entrepreneurship.
(3) Differences in the supply of ideas: Some places are better at generating ideas; places
that generate more ideas should, all else equal, have more entrepreneurs.
(4) Differences in local culture, political systems, or endowments: Places with cultures
and policies that support entrepreneurs or with natural endowments that increase
the chances of success will also likely have more entrepreneurs.
62017 Kauffman Index of Main Street Entrepreneurship Survival Rate
7Adapted from Glaeser, E. L., Rosenthal, S. S., & Strange, W. C. (2010). Urban economics and
entrepreneurship. Journal of Urban Economics, 67(1), 1-14.
The State of Entrepreneurship in Montana 4Which of these factors drives entrepreneurship rates in Montana remains unclear. High
entrepreneurship rates could reflect higher returns to entrepreneurship here.
Alternatively, Montana’s high rates of entrepreneurship could reflect better access to the
inputs needed to start a business, a more supportive culture, or some other combination of
factors. While distinguishing among potential explanations is beyond the scope of this
report, we note that a recent report examined the entrepreneurial ecosystem in Missoula
and Bozeman in greater depth, particularly for high tech firms.8 This report found support
for many of these factors. In particular, it argued that these communities offered dense
networks and ample support from mentors, government, and business resources, that they
attract skilled entrepreneurs, and that they offer reasonable access to skilled workers.
However, this report did not seek to explain Montana’s higher rates of entrepreneurship
relative to other places.
B. Indicators of weakness
1. New Montana businesses tend to be small.9
The average new employer business -- i.e., a firm less than 1 year old that has
employees -- in Montana has 3.9 employees. This is the smallest new firm size among all
states. This is not new. New employer businesses in Montana have consistently been
among the smallest in the country for the past 25 years, ranking among the 5 smallest each
year since 1992.
Furthermore, even after five years, new Montana businesses are small. In 2014, five
years after opening, the average employer business employed 6.6 people. This was the
smallest average among all states.
8 Henderson et al (2017) A New Frontier: Entrepreneuship Ecosystems in Bozeman and Missoula, Montana.
9 2017 Kauffman Index of Growth Entrepreneurship underlying data for Rate of Startup Growth.
The State of Entrepreneurship in Montana 5Figure 2 – Average number of employees at new firms
Source: 2017 Kauffman Index of Growth Entrepreneurship
2. New Montana businesses are less likely to scale-up quickly.10
As of 2014, 0.8 percent of new Montana firms that started with fewer than 50
employees grew to have more than 50 employees during their first 10 years. While scale-
ups are generally rare – in the median state only 1.4 percent of start-ups scale to more than
50 employees within 10 years – the percent of Montana firms that scale-up was the lowest
in the country. Montana has consistently ranked in the bottom five states on this metric for
nearly 20 years.
3. Montana business owners have lower aspirations.11
According to the Annual Survey of Entrepreneurs – a Census Bureau survey that
provides information about employer businesses (i.e., businesses with employees), only 54
percent of respondent employer businesses in Montana say that they aspire to grow the
business' profits or sales. This is the second lowest percentage among all states. Nationally,
64 percent of firms want to grow. However, firms with low aspirations tend to be small.
Overall, 75 percent of Montana’s employees work for firms hoping to grow (this ranks
Montana 43rd).
102017 Kauffman Index of Growth Entrepreneurship Share of Scaleups.
112015 Annual Survey of Entrepreneurs, Characteristics of Businesses, Business Aspirations of Owners
(SE1500CSCB04)
The State of Entrepreneurship in Montana 64. Montana has a lower density of high growth firms.12
The number of private Montana firms with at least $2M in revenue who also have
grown by at least 20 percent a year for three straight years is relatively low. Montana’s high
growth density on the Kauffman index of high growth entreprenurialship reached 26 in
2017, the highest it’s been in the 10 years the Kauffman Foundation has produced this
measure. However, this still ranked Montana 43rd among all states and is less than half the
average or median state.
5. Montana has a relatively small traded sector.13
While Montana has a relatively large share of employer firms that sell primarily to
customers outside their region -- local customers represent less than 25 percent of sales at
11 percent of Montana firms (rank 18th); many of these firms are small. Montana ranks last
in the share of employment in firms that sell primarily to non-local customers. Only 11.5
percent of Montana employment is in firms where local sales represent less than 25
percent of the total. In contrast, in the median state, over 22 percent of employment is in
firms that sell primarily to non-local customers.
6. Montana has a disproportionate share of seasonal or part-time businesses.14
Twenty-three percent of Montana employer firms operated less than 40 hours per
week, operated less than 12 months per year, operated occasionally, or were seasonal. This
is four percentage points higher than the US level (19 percent). However, these part-
time/seasonal firms are small. They employ less than 8 percent of Montana’s workers.
7. Montana firms are less likely to have a patent, trademark, or copyright.15
Montana ranks toward the bottom in the share of employer firms with a patent,
trademark, or copyright. Only 1.3 percent of Montana firms have a patent (rank 47th), and
0.9 percent have a patent pending (rank 42nd). Four percent have a copyright (rank 41st),
and 6.6 percent have a trademark (rank 41st). In total, only 8.6 percent of Montana firms
have any of these which ranks Montana 47th among all states.
12 2017 Kauffman Index of Growth Entrepreneurship High Growth Company Density
13 2015 Annual Survey of Entrepreneurs Location of Business Customers/Clients (SE1500CSCB15)
14 2015 Annual Survey of Entrepreneurs, Characteristics of Businesses, Seasonal or Part-Time Business Status
(SE1500CSCB26)
15 2015 Annual Survey of Entrepreneurs, Characteristics of Businesses, Type(s) of Intellectual Property
(SE1500CSCB25)
The State of Entrepreneurship in Montana 7Figure 3 – Share of firms with IP (patents, trademarks, or copyrights)
Source: 2015 Annual Survey of Entrepreneurs
These data suggest some weakness. At a minimum, they suggest that Montana’s
entrepreneurial ecosystem does not have a large share of big, high growth firms with lots of
intellectual property. This could reflect the fact that Montana entrepreneurs have lower
ambitions. It could also indicate that it is harder to create these types of businesses in the
relatively small and isolated towns in Montana. In particular, to the extent that Montana
has more entrepreneurs who create businesses to serve local markets in small towns, it is
difficult for these entrepreneurs to create large businesses because their prospects for
growth are limited by the size of their local market. These facts could also be an artifact of
the data. The data do not allow us to parse the results by key factors (e.g., industry or part-
time/seasonal). This makes it difficult to create the apples-to-apples comparisons needed
to explore different explanations (like industry composition or location). As such, we do
not attempt to explain these findings in this report. We highlight them as something
Montanans should be aware of and seek to understand more.
The State of Entrepreneurship in Montana 8III. Montana Chamber of Commerce State of
Entrepreneurship Indicators
In an effort to better track Montana’s entrepreneurial ecosystem, the Chamber asked
the Bureau of Business and Economic Research (BBER) to compile data on an handful of
key indicators: capital investment, patents, entrepreneurial support, and job creation at
young firms. In part, these correspond to several of the sources of variation in
entrepreneurship discussed in section III. A., capital investment speaks to the availability of
capital to build a venture. The number of patents speaks to the level of idea creation.
Entrepreneurial support speaks to both culture and the availability of inputs to help
nascent entrepreneurs succeed. The fourth indicator (jobs and payroll) speaks to
outcomes. As shown below, access to venture capital, patents, and entrepreneurial support
have all improved in recent years, but they remain low relative to other places. These
trends suggest some recent improvements in key aspects of Montana’s entrepreneurial
ecosystem. However, Montana, like the rest of the country, has seen significant declines in
the number of entrepreneurs and the share of workers who work at startups.
A. Capital investment
Unfortunately, data on capital investment by all firms are not available at the state level.
However, there are some other data that provide some evidence on the level and role of
venture capital in Montana’s entrepreneurial ecosystem.
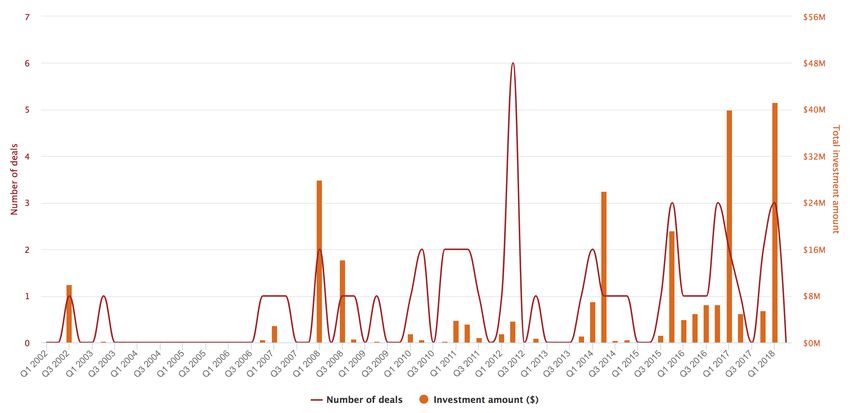
PricewaterhouseCoopers/CB Insights’ Moneytree Report tracks venture capital (VC)
investment by state.16 These data track both the number of deals and the total investment.
Figure 4 shows these data for the past 16 years. These data indicate that VC investment in
Montana has increased in recent years as measured by both the number of deals and the
total amount invested. However, VC investment in Montana remains low. On a per capita
basis, Montana ranks 33rd in the average number of deals per year between 2012 and
2016 and 43rd in the amount invested.
While this indicator is informative, it is incomplete. A relatively small share of Montana
firms rely on venture capital for financing. Less than 1 percent of Montana employer firms
report using venture capital to start or acquire their business. In constrast, 85 percent
16 https://www.pwc.com/us/en/industries/technology/moneytree.html
The State of Entrepreneurship in Montana 9report using personal funds, and 27 percent report that they received financing from banks
or financial institutions.17 Similarly, only 5 percent of Montana entrepreneurs report that
lack access to financial capital had a negative impact on their profitability. This was half the
national rate of 10 percent.18 (In contrast, 33 percent report that access to qualified labor
negatively affected profitability; this was 5 percentage points higher than the national
rate).
Figure 4 – Number of deals and amount invested in Montana by venture capitalists
over time
Source: PricewaterhouseCoopers/CB Insights’ Moneytree Report
B. Patents
As discussed in section III.B.7, Montana firms are relatively unlikely to have patents,
copyrights, or trademarks. Data on annual patent filings confirms this. Montanans are
granted relatively few patents each year. In 2015, Montanans were awarded 142 patents.
This represents a significant improvement over the recent past and is just shy of the high
17 2015 Annual Survey of Entrepreneurs, Characteristics of Business, Sources of Start-Up or Acquisition
Capital (SE1500CSCB07)
18 2015 Annual Survey of Entrepreneurs, Characteristics of Business, Negative Impacts on Profitability
(SE1500CSCB13)
The State of Entrepreneurship in Montana 10point (145) that Montana reached in 2001.19 However, this remains low relative to other
places. On a per capita basis, Montana ranked 40th among all states, and its received less
than half the number of patents per person as the median state.
Figure 5 – Number of patents awarded to Montanans over time
160
140
120
100
80
60
40
20
0
1963
1965
1967
1969
1971
1973
1975
1977
1979
1981
1983
1985
1987
1989
1991
1993
1995
1997
1999
2001
2003
2005
2007
2009
2011
2013
2015
Source: US Patent and Trademark Office, Patent Technology Monitoring Team, Extended Year Set – Patent
Counts by Country, State, and Year Utility Patents (December 2015)
C. Entrepreneurial support
In recent years, Montana has developed several formal programs that help support
entrepreneurs, e.g., the Launchpads at the University of Montana and Montana State
University and 406 labs. These programs help potential entrepreneurs through the pre-
entrepreneurial process. They help individuals develop their entrepreneurial skills, they
help connect potential entrepreneurs to resources, and they help foster a culture of
entrepreneurship.
19US Patent and Trademark Office, Patent Technology Monitoring Team, Extended Year Set – Patent Counts
by Country, State, and Year Utility Patents (December 2015)
https://www.uspto.gov/web/offices/ac/ido/oeip/taf/cst_utlh.htm
The State of Entrepreneurship in Montana 11While we know that these entities have aided hundreds of potential entrepreneurs, they
have not yet developed a consistent monitoring system that allows for consistent
quantification of the entrepreneurs they have helped. However, a recent report on the
entrepreneurial ecosystem in Bozeman and Missoula found that at least five interviewees
mentioned each of the following business resources20:
• Montana High Tech Business Alliance
• Hellgate Venture Network
• Blackstone Launchpad – Univeristy of Montana
• Business Startup Challenge – University of Montana
• MonTEC
• Blackstone Launchpad – Montana State University
• Missoula Economic Partnership
• University of Montana (other units and functions)
• Montana Photonics Industry Alliance
• Montana State University (other units and functions)
• TechRanch
• Montana Code School
• Montana Manufacturing Extension Center
• 1 Million Cups – Missoula
• Dorsey & Whitney
This report also highlighted that entrepreneurs received support from a number of
mentors at other businesses and utilized a number of governmental resources. This
suggests that Montana has a reasonably robust set of resources to help entrepreneurs.
D. Start-up employment
Approximately 1 out of every 8 jobs in Montana is at a firm that is less than 5 years
old.21 This is slightly higher than the US level of 1 out of 10. Young firms, though, comprise
a much higher proportion of net job creation (total job creation minus job destruction). In
2016, over 60 percent of net job creation occurred at young firms, and over half was at
startups (firms less than 1 year old). These levels are slightly higher than the US level.
20 Henderson et al (2017) A New Frontier: Entrepreneuship Ecosystems in Bozeman and Missoula, Montana.
21 Analysis of data obtained from US Census Bureau, Quarterly Workforce Indicators
The State of Entrepreneurship in Montana 12Figure 6 presents the share of workers who work at young firms by industry for Montana and the US. With the exception of manufacturing, the industry patterns in Montana and the US are similar. Young firms comprise much larger shares of employment in industries like accomodation and food service, agriculture forestry and fishing, real estate, construction, and arts entertainment and recreation. Figure 6 – Share of employment at young firms (
Similarly, the rate of business ownership in Montana has fallen substantially.22 In 1998,
14.2 percent of Montanans owned a business as their main job. This was almost double the
national rate of 7.7 percent. While the rate of business ownership has declined in all states,
Montana’s decline ranks 4th and is two-and-a-half times larger than the national decline.
Similarly, the scale-up rate for Montana firms has declined steadily since the mid-1990. The
rate in recent years is roughly half what it was 20 years ago.

Figure 7 – Share of employment at young firms over time
 0.250

 0.200

 0.150

                                                                                               US

 0.100                                                                                         MT

 0.050

 0.000
            1993
            1994
            1995

            1997

            1999
            2000
            2001
            2002
            2003
            2004
            2005

            2007

            2009
            2010
            2011
            2012
            2013
            2014
            2015
            1996

            1998

            2006

            2008

            2016

Source: Quarterly Workforce Indicators

    Figure 8 shows how the share of workers at young firms changed by industry in
Montana between 1996 and 2006. Consistent with the overall decline described previously,
the share declined for nearly every industry. However, the declines are not uniform.
Industries like administrative support and waste management services, agriculture
forestry and fishing, arts entertainment and recreation, and construction saw the largest
declines.

    Economists have not yet identified the source of the decline in entrepreneuship.
Several hypotheses have been suggested. These include: market concentration (larger
firms have come to dominate more industries making it more difficult for entrepreneurs to

22   2017 Kauffman Index of Entrepreneurship Main Street Entrepreneurship, Rate of Business Owners

                                The State of Entrepreneurship in Montana                             14
enter markets); difficulty finding resources/financing (perhaps, in part, due to growing student debt); slowing population growth (which implies slower expected growth); corporations doing more entrepreneurship in-house; and generational effects (baby boomers were more likely to pursue entrepreneurship than genX and perhaps millenials). Other factors likely contribute, and there may be idiosyncratic factors that help explain Montana’s decline. Figure 8 – Change in share of employment at young firms (
IV. Conclusion

    In sum, the state of entrepreneurship in Montana is a mixed bag. Montana continues to
generate more entrepreneurs than other states, and these entrepreneurs tend to create
businesses that are more likely to survive. However, Montana firms tend to be small, they
have lower aspirations, and they are less likely to grow rapidly. Recent growth in access to
venture capital, patenting, and in support for entrepreneurs suggest that Montana may be
on the verge of developing more high growth start-ups.

    Montana – like the rest of the US – is also suffering from a loss of dynamism. The share
of people starting businesses and the share of people working for start-ups have declined
substantially in Montana and elsewhere. It is important to develop a deeper understanding
of the sources of this decline.

                          The State of Entrepreneurship in Montana                        16
You can also read