CONSUMER CREDIT TRENDS - FOR DALLAS COUNTY - Federal Reserve Bank of Dallas - Federal Reserve ...
←
→
Page content transcription
If your browser does not render page correctly, please read the page content below

MARCH 2018
                                     FEDERAL RESERVE BANK OF DALLAS

  CONSUMER CREDIT
  TRENDS
  FOR DALLAS COUNTY

                                                    Federal Reserve
                                                    Bank of Dallas
#DallasCredit         CONSUMER CREDIT TRENDS FOR DALLAS COUNTY   1
FEDERAL RESERVE BANK OF DALLAS

                            TABLE OF CONTENTS

           03               CONSUMER CREDIT TRENDS FOR
                            DALLAS COUNTY

           04               CREDIT CONSUMERS AND CREDIT SCORES

          06                TYPES OF LOANS AND LOAN VOLUMES

          09                SERIOUS DELINQUENCY RATES

             11             STUDENT LOAN CONCERNS

            13              LOOKING AHEAD: CONSUMER
                            CREDIT PATTERNS

            14              NOTES

“Consumer Credit Trends for Dallas County” is a research report from the Community Development
Department at the Federal Reserve Bank of Dallas. It is part of a series that focuses on the credit
activity of residents in selected counties in Texas and includes information on loan volumes in major
credit categories and loan repayment levels. The views expressed in the report are the authors’ and
do not necessarily reflect official positions of the Federal Reserve System. For more information,
contact Emily Ryder Perlmeter at Emily.Perlmeter@dal.frb.org.

#DallasCredit                                              CONSUMER CREDIT TRENDS FOR DALLAS COUNTY     2
FEDERAL RESERVE BANK OF DALLAS

CONSUMER CREDIT TRENDS
FOR DALLAS COUNTY
Except for Student Loans, Delinquencies Largely Down Since Recession

 A
        ccess to affordable credit is a key component of an individual’s ability to cultivate a strong
        financial position and participate fully in the economy. Loans are necessary financial tools that
most Americans use to purchase homes, cars and other goods or pay for college. Restricting access
to debt can limit access to these asset-building opportunities.
  At the same time, easy loan access has its downsides. One concern is that large balances with high
interest rates can keep borrowers trapped in a debt cycle or otherwise prevent them from meeting
their payment obligations. In worst-case scenarios, these consequences can multiply when adequate
consumer protections are not in place, leading to large-scale and negative impacts on the economy. 1
  Useful indicators of the financial health of an economy include the number of credit consumers, total
loan volume and the percentage of loans that are delinquent or not repaid. While such credit trend data
are available on the state and national level, little analysis has been done on a county and subcounty
level. With this in mind, the Federal Reserve Bank of Dallas and the Center for Public Policy Priorities
partnered to examine and report on debt trends and the credit health of Dallas County, using data
from credit bureau Equifax.2 This report is the first in a series. Analysis of other Texas counties will be
forthcoming in 2018.
  In Dallas County, 85 percent of potential borrowers have a credit report, with credit card debt the
most utilized among the major loan types.3 Predictably, loan volumes have climbed in the postrecession
period, and balances have surpassed their prerecession heights for all the major loan types except credit
cards. Average balances are unsurprisingly highest for mortgage loans, though student loan balances
are swiftly rising. Regulations have tightened, and serious delinquencies have largely recovered in the
postrecession period. But student loans tell a different story.

#DallasCredit                                                  CONSUMER CREDIT TRENDS FOR DALLAS COUNTY       3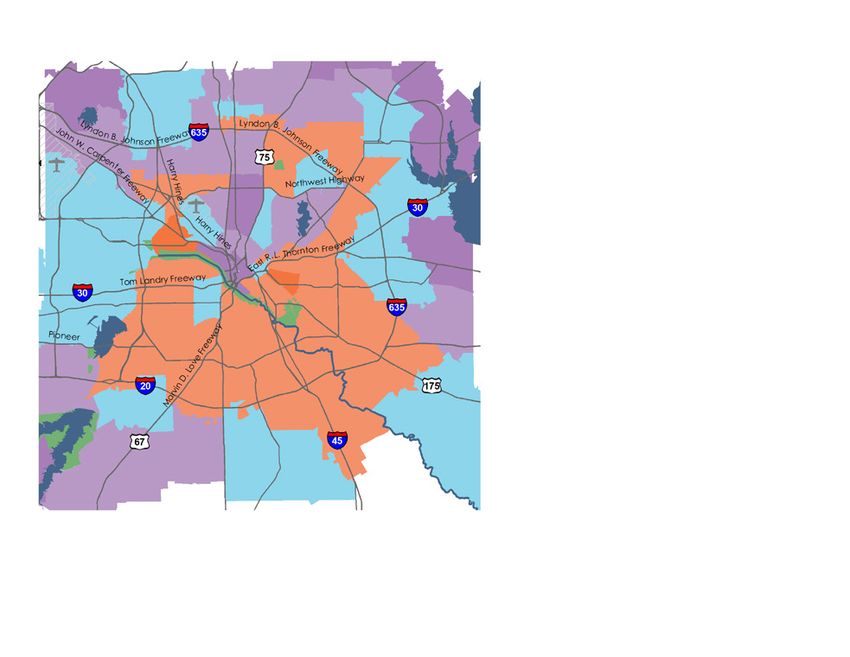
FEDERAL RESERVE BANK OF DALLAS

CREDIT CONSUMERS AND CREDIT SCORES
  This report analyzes who is borrowing, how much they’re borrowing and their level of delinquency
by credit score across major loan types.
  Credit scores are calculated based on information in a consumer’s credit report—including the
number of loans and whether they are paid on time. The scores are calculated by the three major
credit bureaus—Equifax, Experian and TransUnion—and are intended to help lenders predict future
delinquency rates. This report uses Equifax scores, which range from 300 to 850: The lower the score,
the greater the risk of serious delinquency.
  In Dallas County, the geographic dispersion of credit scores is related to that of income: ZIP codes
with lower median incomes tend to also have lower median credit scores (Chart 1). Much of this pop-
ulation is located in the southern sector of Dallas. These ZIP codes also have higher concentrations of
people of color. In Dallas and elsewhere, median incomes for black and Latino residents lag behind
those of white residents.
  The geographic connection is not surprising given the nation’s history of racial discrimination in the
credit market. Through the 1970s, black Americans hoping to access credit, mortgages and housing
faced significant barriers, many of which were codified in government policies. The Federal Housing
Administration refused to insure loans in communities that had what they considered “undesirable”
racial makeup.4 Without such insurance, banks would not grant mortgages in these neighborhoods,
which were lower income and less white. This practice is known as redlining. Generations of people of
color lacked the opportunity to build assets through homeownership, and others were steered toward
certain neighborhoods and higher-cost loans.
  While the Equal Credit Opportunity Act of 1974, the Community Reinvestment Act of 1977 and other
legislation were eventually passed to protect all consumers, the effects of the discrimination endure today.
  Credit score categories in Dallas County are predictably correlated with the average serious delinquency
rate, defined as the percentage of the loan balance that is at least 90 days past due or written off as
a loss or foreclosure (Table 1). Prime borrowers (scores of 680 and above) have a serious delinquency
rate close to zero. Deep subprime borrowers (scores below 550) have serious delinquency rates over 30
percent. A little over half of Dallasites have prime credit, and 30 percent—or 393,000 borrowers—have
subprime or deep subprime scores of below 620.

 TABLE 1. Credit Score Categories Intended to Help Predict Delinquency Rates

                                                                                        Average serious delinquency
     Category             Credit score range           Number of borrowers
                                                                                               rate, percent

        Prime                680 and above                      705,780                                0.06

    Near prime                  620 - 679                       215,660                                 1.51

     Subprime                    550 - 619                      194,460                                 9.34

  Deep subprime                 Below 550                       198,840                                30.25

SOURCES: Federal Reserve Bank of New York Consumer Credit Panel/Equifax; authors’ calculations.

#DallasCredit                                                               CONSUMER CREDIT TRENDS FOR DALLAS COUNTY        4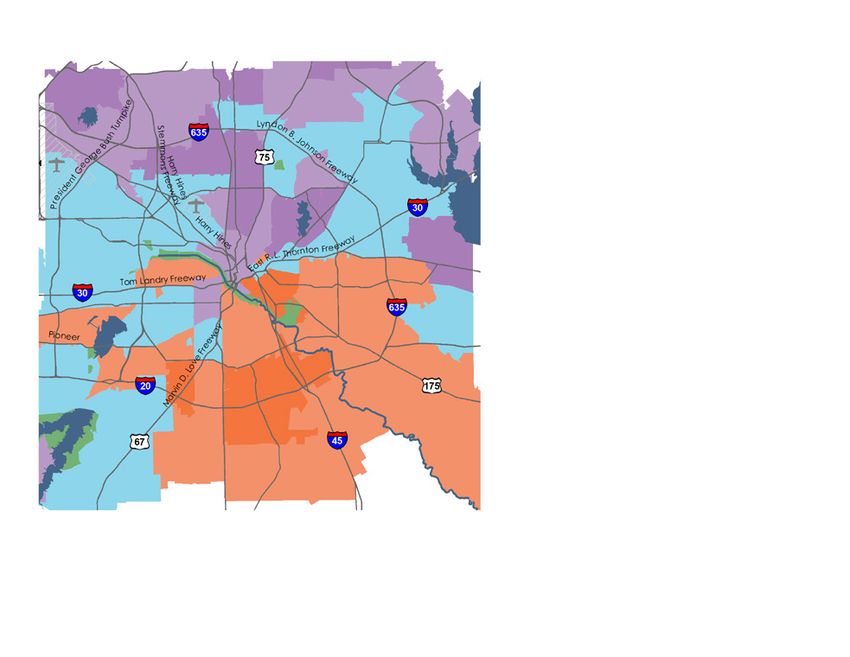
FEDERAL RESERVE BANK OF DALLAS

CHART 1. Credit Scores Related to Income, Share a Similar Geographic Pattern

The map colors depict areas of greater Dallas County according to credit score and income. The light
and dark orange regions reveal that lower credit scores are largely in the southern reaches of the city
where lower median household incomes are found.

                                                                                    Credit score
                                                                                    (median)

                                                                                              750 or more

                                                                                              700–749

                                                                                              650–699

                                                                                             600–649

                                                                                              Less than 600

                                                                                     Household income
                                                                                     (median, dollars)

                                                                                              80,000 or more

                                                                                              60,000–79,000

                                                                                              40,000–59,000

                                                                                              20,000–39,000

                                                                                              Less than 20,000

NOTES: Data are as of March 2017. The Equifax Risk Score was developed by credit scoring agency Equifax and predicts the likelihood
of a consumer becoming seriously delinquent (90-plus days past due). The score ranges from 300 to 850 (the lower the score, the greater
the delinquency risk).
SOURCES: Federal Reserve Bank of New York Consumer Credit Panel/Equifax; authors’ calculations.

#DallasCredit                                                                   CONSUMER CREDIT TRENDS FOR DALLAS COUNTY                  5
FEDERAL RESERVE BANK OF DALLAS

TYPES OF LOANS AND LOAN VOLUMES
  This report considers four major loan types for individual borrowers—mortgage, credit card, auto and
student.5 These are the most commonly held types of debt and, together, they represent 95 percent
of the loan volume in Dallas County (Table 2).

 TABLE 2. Loan Volumes Vary Widely by Loan Type and Risk Score

                                                 Mortgage             Student               Auto            Credit card
                         Percent of all        loan volume         loan volume          loan volume           volume
     Category
                          borrowers              (percent),          (percent),           (percent),         (percent),
                                               $48.2 billion       $10.9 billion        $10.9 billion       $5.7 billion

       Prime                   53.7                 81.6                 34.5                 47.9              64.4

    Near prime                 16.4                  9.2                 17.9                 18.6              19.0

     Subprime                  14.8                  5.2                 19.8                 17.1              10.4

 Deep subprime                 15.1                  4.1                 28.1                 16.7              7.7

SOURCES: Federal Reserve Bank of New York Consumer Credit Panel/Equifax; authors’ calculations.

  Lower credit scores have other implications. They signal higher risk to lenders, who often restrict
credit for these groups. As such, the percent of loan volume carried by deep subprime borrowers is
far smaller than the loan volume carried by their prime counterparts.
  This is particularly evident in the mortgage market, where deep subprime borrowers carry just
4 percent of debt. This was not always the case; an expansion of credit took place in the early 2000s.
In 2009, borrowers with credit scores under 550 represented 14 percent of all mortgage borrowers and
held 12 percent of the overall loan volume.6 After the Great Recession, lending standards tightened.
This was one factor in restricting access for many borrowers, especially those with poorer credit.

#DallasCredit                                                               CONSUMER CREDIT TRENDS FOR DALLAS COUNTY        6
FEDERAL RESERVE BANK OF DALLAS

                                        The Effect of Federal Policy on Credit Card Balances
                                        The average Dallas resident with a credit card carried over $7,000 from
                                        2001 through 2009. Average balances declined after the recession,
                                        which coincided with the passage of the Credit Card Accountability
                                        Responsibility and Disclosure (CARD) Act of 2009.

                                        The CARD act placed restrictions on the fees credit card companies
                                        can charge, limited hikes in interest rates and required all companies to
                                        assess a borrower’s ability to pay before granting credit. A subsequent
                                        reduction in late fees and overlimit fees was directly attributable to
                                        the act.

Studies by the Consumer Financial Protection Bureau have also shown correlations between the act and de-
creased overall consumer credit card costs as well as restricted credit access for young and subprime borrowers.
Since 2009, the average credit card balance in Dallas County has declined by $1,988.

–Emily Ryder Perlmeter

      Economic policies affected the credit card industry as well, with the 2009 passage of the Credit Card
    Accountability Responsibility and Disclosure (CARD) Act (see the sidebar, “The Effect of Federal Policy
    on Credit Card Balances”).
      Typically, implications for lower credit scores include smaller approved loan amounts and higher interest
    rates.7 The notable exception to this is student loans. The student loan market differs because of the
    involvement of the federal government, which originates and guarantees debt for students. Loans are
    not offered based on credit score or credit history; rather, Congress sets interest rates and borrowing
    limits. Without a credit check, students from all credit backgrounds are offered the same borrowing
    limit and price of debt. Private student loans are still available, but they are used far less often than
    federal student loans and make up about 10 percent of the total student loan volume.
      Because access to credit is so vital to participation in the economy, the number of credit consumers
    out of the total possible number of borrowers can be an important measure of a local economy’s credit
    inclusion. A lower consumer credit percentage may signal lower inclusion. With 85 percent of residents
    18 and older having a credit score, Dallas County falls short of the statewide average of 86 percent
    and the national average of 90 percent. Credit scores are available only for consumers who have at
    least one line of credit. Once a credit line is active, it can take up to six months for a credit bureau to
    calculate a score.
      Looking at the four major types of loans, nearly 52 percent of residents have at least one credit card
    account (Chart 2). Just under a third of people 18 years or older have an auto loan, whether from a
    financial institution or a car dealership/financing company. Twenty percent of residents have a mortgage
    and 17 percent have student debt.

   #DallasCredit                                                   CONSUMER CREDIT TRENDS FOR DALLAS COUNTY       7
FEDERAL RESERVE BANK OF DALLAS
CHART 2. Credit Card Debt Most Widely Used in Dallas County
Credit Card Loans Auto Loans
52% = 1,038,580
People
31% = 615,120
People
Mortgage Loans Student Loans
20% = 372,120
People 17% = 329,220
People
NOTE: Data are for 2016 and are based on the population 18 years and older
SOURCES: Census Bureau, 2016 population estimates; Federal Reserve Bank of New York Consumer Credit Panel/Equifax; authors’
calculations.
Not surprisingly, the dollar amount of mortgage debt dwarfs that of all other types of loans. The
average mortgage balance was $129,633 in 2017 for Dallas County residents who had a mortgage.
Student loans had the second-highest average balance at $33,256 but the fewest borrowers. Those
with auto debt carried $17,774 on average, and credit card accounts averaged $5,461.
Chart 3 shows the 18-year trend of average debt for each loan type, adjusted for inflation. While the
real value of average auto debt has remained somewhat stagnant since 2000, average mortgage debt
has soared 41 percent. At close to $130,000, mortgage balances in Dallas County have recovered from
the postrecession decline and are higher than their previous peak in 2009.
#DallasCredit CONSUMER CREDIT TRENDS FOR DALLAS COUNTY 8FEDERAL RESERVE BANK OF DALLAS
CHART 3. Mortgage Volumes Highest; Student Loan Balances Fastest Growing
2017 dollars*
140,000
Mortgage
120,000
100,000
80,000
60,000
40,000 Student
Auto
20,000
Credit card
0
2000 2001 2002 2003 2004 2005 2006 2007 2008 2009 2010 2011 2012 2013 2014 2015 2016 2017
*Average loan amounts for Dallas County residents for major loan types, adjusted for inflation.
NOTE: 2017 data are based on estimates through March.
SOURCES: Federal Reserve Bank of New York Consumer Credit Panel/Equifax; Consumer Price Index; Bureau of Labor Statistics;
authors’ calculations.
Student loans have seen the largest percent increase in the average balance. In 2003, the first year
Equifax student loan data were available, balances were within a few thousand dollars of auto loans.
Presently, the average student loan balance is nearly twice that of auto debt. In fact, average student
debt is up 60 percent since 2003. This growth rate is not surprising when considering skyrocketing
tuition costs, increases in graduate student loans and the lack of restrictions on this type of credit.8
SERIOUS DELINQUENCY RATES
Serious delinquencies are indications that loans are in danger of default. This status can have serious
ramifications for a consumer’s credit report and ability to borrow in the future. The timeline for defaulting
on a loan varies by loan type and servicer but most often occurs after three to six months of missed
payments. For some types of federal student loans, default kicks in at 270 days, or about nine months.
#DallasCredit CONSUMER CREDIT TRENDS FOR DALLAS COUNTY 9FEDERAL RESERVE BANK OF DALLAS
Most of the major loan types in Dallas County experienced similar patterns of rising serious delinquency
through 2010, followed by a tapering off after the Great Recession (Chart 4). Mortgages had the overall
lowest rate of serious delinquency, even at the height of the crisis. This may be due to the greater loan
amounts required for home mortgages and the greater borrowing restrictions that come with them.
CHART 4. Serious Delinquencies Trend Down for All but Student Loans
Percent
18 Great Recession
16
Student
14
12
Credit card
10
8
Auto
6
4
Mortgage
2
0
2003 2004 2005 2006 2007 2008 2009 2010 2011 2012 2013 2014 2015 2016 2017
NOTES: The chart is based on the percent of overall loan volume that is seriously delinquent. Serious delinquencies include loans
90 days past due and 120 days past due and those charged off to bad debt, repossession or foreclosure. Delinquencies reflect all
student loans, including those in deferment. 2017 data are based on estimates through March.
SOURCE: Federal Reserve Bank of New York Consumer Credit Panel/Equifax.
Historically, credit cards have had high rates of delinquency, peaking in 2010 at nearly 16 percent.
The rates have since declined to less than 8 percent. Auto loans, too, saw high rates of serious delin-
quency in 2010 and 2011, followed by a steady decline. In 2017, auto loans did experience an uptick of
0.2 percent for loans 90-plus days past due, but the change so far has been very small.
Student loans in Dallas County buck the overall trend. Not only have student loan balances contin-
uously increased, but delinquencies have as well. From 2009 to 2011, student loans saw only a minor
increase in delinquency. In the years since, serious delinquencies have continued to climb. At 13 percent,
the rates of seriously late student loan payments now outpace those of every other major loan type.
This fact, coupled with the increasing average loan balance, suggests that student loans necessitate
a deeper look.
#DallasCredit CONSUMER CREDIT TRENDS FOR DALLAS COUNTY 10FEDERAL RESERVE BANK OF DALLAS
STUDENT LOAN CONCERNS
Aggregate Loan Volumes, Average Balances Up
Average student loan balances dwarf median (midpoint) balances, $33,256 to $16,667. This indicates
that borrowers at the high end of the distribution have particularly large debt amounts. Average bal-
ances have climbed 60 percent since 2003, while median balances have risen 59 percent. This suggests
that similar balance growth has occurred for borrowers at both the low and high ends of the spectrum.
The aggregate volume of student loans for all Dallas County borrowers has soared 380 percent since
2003, accounting for inflation. This increase is due both to growth in the number of borrowers and an
increase in the average balance carried by each borrower.
While the total debt has risen, the amount of debt that is seriously delinquent has shot up. Chart 5
shows this widening gap between the volume that is not seriously delinquent and the volume that is.
As of March 2017, Dallas County had over $1.4 billion in outstanding student debt that is at least 90
days past due; this volume represents a 535 percent increase since 2003, adjusting for inflation.
CHART 5. Student Loan Volume Climbs; Rate Highest for Seriously Delinquent Balances
Billions of 2017 dollars
12
Seriously delinquent volume
Volume not seriously delinquent
10
8
6
4
2
0
2003 2004 2005 2006 2007 2008 2009 2010 2011 2012 2013 2014 2015 2016 2017
NOTES: Data are adjusted for inflation. Loan volume reflects all student loans, including those in deferment. 2017 data are based on
estimates through March.
SOURCE: Federal Reserve Bank of New York Consumer Credit Panel/Equifax.
#DallasCredit CONSUMER CREDIT TRENDS FOR DALLAS COUNTY 11FEDERAL RESERVE BANK OF DALLAS
Serious Student Loan Delinquencies Soar for Low Credit Scores
Credit scores can play a significant role in delinquency outcomes. Serious delinquencies are less than
half of a percent for prime or near-prime Dallas student loan borrowers, compared with 10.7 percent
for subprime borrowers (Chart 6). For those with deep subprime credit, serious delinquencies are a
staggering 38 percent.
These findings are expected; credit scores are calculated based on the risk of being 90 days or more
past due. However, as Chart 6 indicates, the gap between prime and subprime delinquencies has been
steadily widening since 2003. Serious delinquencies have increased 5 percentage points for subprime
borrowers and 12 percentage points for deep subprime borrowers, while prime or near-prime rates
have remained mostly stagnant. Given that the portion of borrowers with credit scores below 620 has
remained around 50 percent since 2003, this suggests that the rise in serious delinquency rates is not
due to an increasing population of borrowers with subprime credit. Rather, these data indicate that
student loan performance may be worsening overall for this group. Additionally, student loans are less
likely to be discharged, so many consumers remain saddled with the severely derogatory portion of
their debt over time.
CHART 6. Gap Widens Between Prime, Subprime Serious Student Loan Delinquencies
Percent seriously delinquent
45 Deep subprime
40
35
30
25
20
15 Subprime
10
5
Prime and near prime
0
2003 2004 2005 2006 2007 2008 2009 2010 2011 2012 2013 2014 2015 2016 2017
NOTES: Data include student loans in deferment. 2017 data are based on estimates through March.
SOURCE: Federal Reserve Bank of New York Consumer Credit Panel/Equifax.
#DallasCredit CONSUMER CREDIT TRENDS FOR DALLAS COUNTY 12FEDERAL RESERVE BANK OF DALLAS As noted, access to federal student loans is not based on credit score. This has implications for loan performance and may at least partially explain the high rates of serious delinquencies. Another important issue impacting delinquencies is college completion. Studies have shown that student loan delinquencies are not correlated with larger balances, but rather with the inability to graduate and earn a degree. The rate of delinquency for those who leave college with no degree is twice as high as it is for those who earn an associate degree and four times as high as it is for those earning a bachelor’s.9 The disproportionate number of subprime and deep subprime borrowers and their climbing delin- quency rates are concerning. But limiting loan availability could restrict access to college, particularly for those with lower incomes, who are more likely to have subprime credit. Given how strongly correlated higher education is with future earnings,10 college is critical to helping lower-income individuals build assets and move up the economic ladder. Increasing college completion could be strategy for improving outcomes. Knowing the power of government action and regulation to influence credit access and outcomes, it’s paramount that the nation strike a balance between lower delinquencies and improved college access. LOOKING AHEAD: CONSUMER CREDIT PATTERNS Future consumer credit profile reports will put the most recent data in context and give a more complete picture of credit inclusion and performance trends in Dallas County. Now that the nation is more than eight years past the Great Recession, average mortgage balances may grow, particularly in Dallas as average home sales prices continue to rise. The downward trend of serious delinquencies for most debt types is a positive sign for Dallas, though the small uptick in auto loan delinquencies should be monitored. For student loans, the problem of growing delinquencies among subprime and deep subprime borrowers begs deeper research and policy discussion. #DallasCredit CONSUMER CREDIT TRENDS FOR DALLAS COUNTY 13
FEDERAL RESERVE BANK OF DALLAS

      CONSUMER CREDIT
      TRENDS
      FOR DALLAS COUNTY

Notes
1
 See “Subprime Mortgage Crisis,” by John V. Duca,                   stream banking institution or a car dealership/financing
FederalReserveHistory.org, Nov. 22, 2013, www.federalre-            company. Student loans include government loans as well
servehistory.org/essays/subprime_mortgage_crisis.                   as loans offered through private companies.
2
 The Federal Reserve Bank of New York Consumer Credit               6
                                                                      The exception is PLUS loans, available to graduate
Panel/Equifax consists of detailed Equifax credit report            students and parents of undergraduate students; although
data in quarterly increments from 1999 to the present for           interest rates are the same for borrowers, approval
a unique longitudinal panel of individuals and households.          depends on not having an “adverse credit history” as
The panel is a nationally representative 5 percent random           defined here: https://studentaid.ed.gov/sa/sites/default/
sample of all individuals with a Social Security number and         files/plus-adverse-credit.pdf. See “Federal Versus Private
a credit report; it is also matched to individuals living at the    Loans,” StudentAid.gov, U.S. Department of Education,
same address as the primary sample members. The result-             https://studentaid.ed.gov/sa/types/loans/federal-vs-private.
ing database includes approximately 40 million individuals          7
                                                                     Trends in Student Aid 2016, College Board, 2016, https://
in each quarter. The data do not contain demographic
                                                                    trends.collegeboard.org/sites/default/files/2016-trends-
information such as gender, race, ethnicity or income.
                                                                    student-aid.pdf.
3
 We estimate the number of credit borrowers out of total            8
                                                                     Tuition and fees for four-year public universities have
potential borrowers by dividing the number of people with
                                                                    doubled since 2000, adjusting for inflation. See “Published
a credit report in the Equifax database by the number of
                                                                    Tuition and Fees Relative to 1986–87, by Sector,”
residents in Dallas county who are at least 18 years of age.
                                                                    CollegeBoard.Org, https://trends.collegeboard.org/
For more information about the credit economy and credit
                                                                    college-pricing/figures-tables/published-tuition-and-fees-
inclusion across the nation, visit www.newyorkfed.org/
                                                                    relative-1986-87-sector.
data-and-statistics/data-visualization/community-credit-pro-
files/index.html#inclusion.                                         9
                                                                     See “A Trillion Dollar Question: What Predicts Student
                                                                    Loan Delinquency Risk?” by Alvaro Mezza an Kamila
4
 See “Community Reinvestment Act of 1977,” by Michael
                                                                    Sommer, Federal Reserve Board of Governors, FEDS Notes,
Berry and Jessie Romero, FederalReserveHistory.org, www.
                                                                    Oct. 16, 2015, www.federalreserve.gov/econresdata/notes/
federalreservehistory.org/essays/community_reinvest-
                                                                    feds-notes/2015/trillion-dollar-question-what-predicts-stu-
ment_act.
                                                                    dent-loan-delinquency-risk-20151016.html.
5
 Mortgage data include only for first liens. Credit cards are
                                                                     See the chart “Unemployment Rates and Earnings by
                                                                    10
revolving accounts offered through a bank, credit union or
                                                                    Educational Attainment, 2016,” Bureau of Labor Statistics,
national credit card company. Auto loans are those used
                                                                    Oct. 24, 2017, www.bls.gov/emp/ep_chart_001.htm.
to finance the purchase of a car, whether through a main-

AUTHORS                                          CONTRIBUTORS
Emily Ryder Perlmeter                            Emily Rogers                     Federal Reserve Bank of Dallas
Federal Reserve Bank of Dallas                   Graphic Designer                 2200 N. Pearl St.
                                                                                  Dallas, TX 75201
Garrett Groves                                   Kathy Thacker
Center for Public Policy Priorities              Editor                           dallasfed.org
and scholar-in-residence at the
Federal Reserve Bank of Dallas

#DallasCredit                                                               CONSUMER CREDIT TRENDS FOR DALLAS COUNTY               14
You can also read