Creating Value for Unitholders - Investor Relations Presentation September 2018
←
→
Page content transcription
If your browser does not render page correctly, please read the page content below
Across Canada, Northview’s passion is providing our customers with a place to call home

      Creating Value for Unitholders
                                                                                          Investor Relations Presentation
                                                                                                         September 2018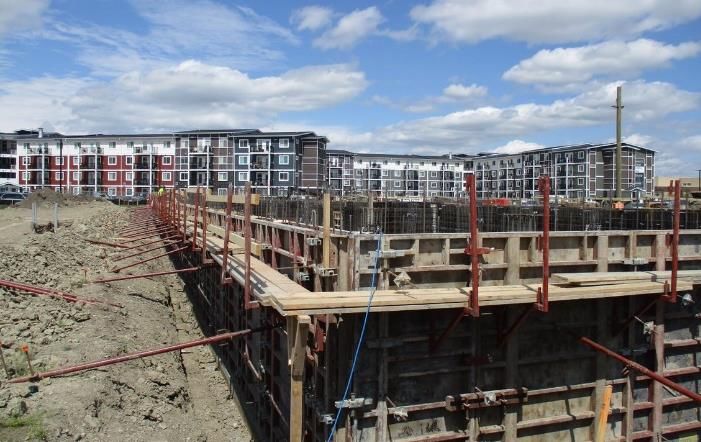
Forward-Looking Information
CAUTIONARY STATEMENT REGARDING FORWARD-LOOKING INFORMATION

This presentation may contain forward-looking information. All information included in this presentation other than statements of historical fact, is forward-
looking information. When used in this presentation, words such as “may”, “should”, “expect”, “will”, “anticipate”, “believe”, “intend”, “estimate”, “predict”,
“project”, “potentially”, “starting”, “beginning”, “begun”, “moving”, “continue”, or other similar expressions identify forward-looking information. The forward-
looking information included in this presentation relates to, among other things, current expectations of future results, performance, prospects and
opportunities.

Forward-looking information is provided for the purpose of presenting information about current expectations and plans relating to the future and readers are
cautioned that such statements may not be appropriate for other purposes. This information is not a guarantee of future performance and is based on
Northview’s estimates and assumptions. The forward-looking information is subject to a variety of risks and uncertainties, which could cause actual events,
results and performance to differ materially from the forward-looking information. A full description of these risk factors can be found in Northview’s annual
information form and other publicly filed information which may be located at www.sedar.com.

The forward-looking information is provided only as of the date of such information, and Northview, except as required by applicable law, assumes no
obligation to update or revise this information to reflect new information or the occurrence of future events or circumstances.

NON-GAAP AND ADDITIONAL GAAP MEASURES

Certain measures contained in this presentation do not have any standardized meaning as prescribed by International Financial Reporting Standards
(“IFRS”) and, therefore, are considered non-GAAP measures. These measures are provided to enhance the reader's overall understanding of financial
conditions. They are included to provide investors and management with an alternative method for assessing operating results in a manner that is focused
on the performance of operations and to provide a more consistent basis for comparison between periods. These measures include widely accepted
measures of performance for Canadian real estate investment trusts; however, the measures are not defined by IFRS. In addition, these measures are
subject to the interpretation of definitions by the preparers of financial statements and may not be applied consistently between real estate entities. Please
refer to Northview’s most recent Management's Discussion & Analysis and Financial Statements for the disclosed financial information and definitions of
non-GAAP measures and additional GAAP measures, including NOI, FFO, AFFO, debt to gross book value, and interest coverage contained in this
presentation.

                                                                               2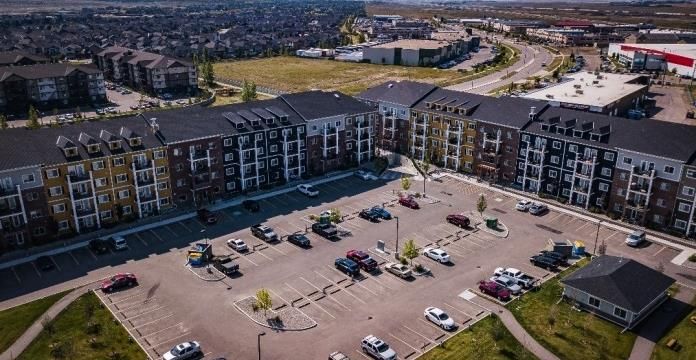
Why Invest in Northview?
One of Canada's largest publicly traded multi-family REITs
                                                                                                  IFRS NAVPU
                                                                                        $27.00
                                                                                                                                                     $25.95
                                                                                        $26.00
 Ongoing Portfolio Diversification Across Canada
                                                                                        $25.00
 •   Provides stability to returns and distributions
                                                                                        $24.00

                                                                                        $23.00
 Compelling Valuation and High Yield
 •   Opportunity for AFFO multiple expansion, strong balance sheet and                  $22.00
     coverage ratios
                                                                                        $21.00
                                                                                                  Q1'16            Q4'16              Q3'17             Q2'18

 Well-Defined Growth Strategy
 •   Driving up earnings and net asset value by focusing on development,                          Total Unitholder Return
     acquisition, and organic growth                                                              Since Jan. 1, 20161
                                                                                          CAP
 Proven Strategy and Track Record
                                                                                      InterRent
 •   Positioned for sustainable growth and yield
                                                                                      Northview                                                 79%
                                                                                         Killam

                                                                           S&P/TSX REIT Index

                                                                                     Boardwalk

                                                                           (1)   2016 YTD total unitholder return performance from January 1, 2016 to August 15, 2018.

                                                                  3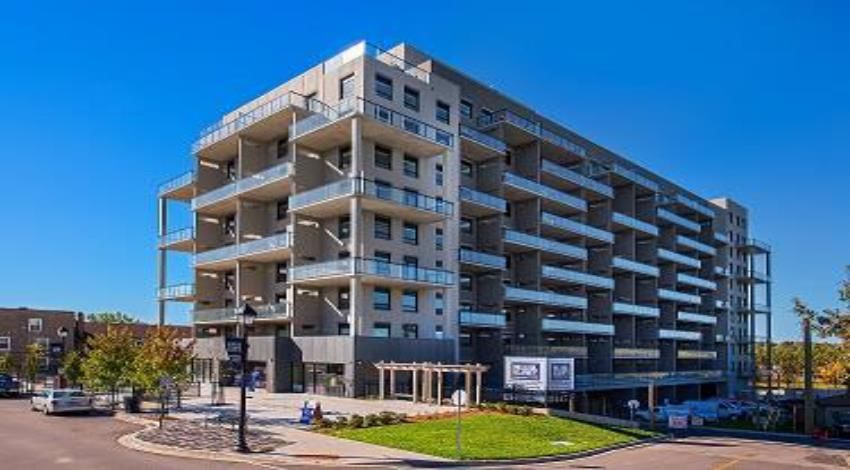
Northview Apartment REIT
 Who are we?
 •   One of Canada's largest publicly traded multi-family REITs

 •   A portfolio of approximately 26,000 quality residential suites and 1.2                                                                               NOI %
     million square feet of commercial space in more than 60 markets
     across eight provinces and two territories

 •   Well-diversified portfolio includes markets characterized by expanding
     populations and growing economies, which provides Northview the                                                            29%
     means to deliver stable and growing profitability and distributions to
     Unitholders of Northview over time                                                                         24%
                                                                                                                                                                      13%
 •   In 2015, the REIT nearly doubled in size to $3 billion in total assets
     and Northern Property REIT changed its name to Northview Apartment
     REIT upon the acquisition of True North Apartment REIT and                                                                              29%            5%
     properties held by Starlight Investments Ltd. and the Public Sector
     Pension Investment Board

     AMR $                                                        OCCUPANCY %                                                   UNITS %
     2,500                                                       100.0%                                                         40%
     2,000                                                        96.0%                                                         30%
     1,500                                                        92.0%
                                                                                                                                20%
     1,000                                                        88.0%
      500                                                         84.0%                                                         10%

        -                                                         80.0%                                                         0%
             Ontario Western Atlantic Northern Quebec                      Ontario Western Atlantic Northern Quebec                   Ontario Western Atlantic Northern Quebec

Note: NOI percentage and multi-family occupancy based on three months ended June 30, 2018. AMR and Units as at June 30, 2018.
.

                                                                                           4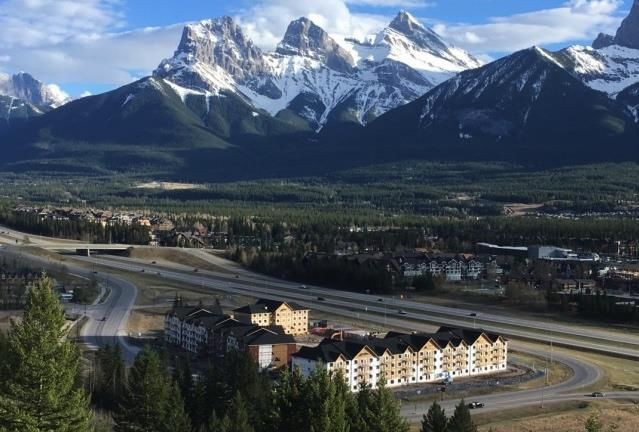
Compelling Valuation

           •      Opportunity to narrow AFFO multiple to peers
           •      Attractive 6.3% yield while executing on organic and external growth strategies

                                            AFFO Multiple1                                                          Distribution Yield2
                    27.8x                                                                                                                      6.3%
                                  26.2x          26.1x

                                                               19.9x
                                                                                                                                      3.9%

                                                                             14.5x                                          2.8%
                                                                                                                  2.4%
                                                                                                      2.0%

                    CAP         InterRent     Boardwalk       Killam         NVU                    Boardwalk   InterRent   CAP       Killam   NVU

(1)   Source: CIBC as at August 15, 2018. Estimated consensus AFFO multiple for one year forward.
(2)   As at August 15, 2018. Annualized distribution yield.

                                                                                            5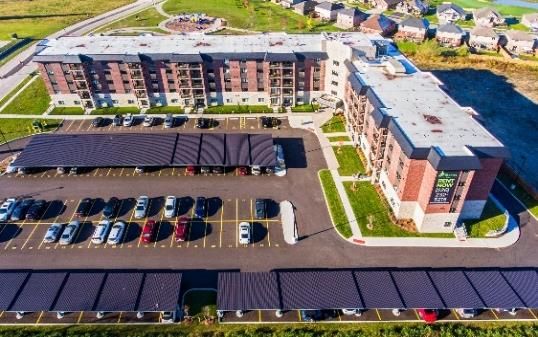
Well-Defined Growth Strategy
Poised for Sustained Growth and Yield – Track Record of Outperformance

 Driving Growth Via Development

 •   Develop quality properties in new and existing key growth markets
 •   Proven ability generating NAV of $25 million or $0.45 per Trust Unit with over
     $270 million invested in 1,500 units in the past five years
                                                                                                                Canmore, AB

 Proven Active Acquisition Strategy

 •   Enhance portfolio quality and diversification through NAV accretive acquisitions
 •   Executed acquisition growth of $239 million in 2017 and $195 million in 2018 in
     strategic markets including ON and BC

 Value Creation Through Organic Growth                                                     325 Lakeview Drive, Woodstock, ON

 •   Maximize earnings through same door NOI growth with value creation initiatives
     (“VCIs”) contributing $8.7 million in annualized NOI creating $158 million in value
 •   Operating expense management and $2.9 million from expense reduction from
     internalized property management
 •   Same door NOI growth of 4.3% contributed to $141 million increase in asset
     values in 2017 and 4.6% and $17 million in 2018

                                                                                                68 Hillside Drive, Toronto, ON

                                                                      6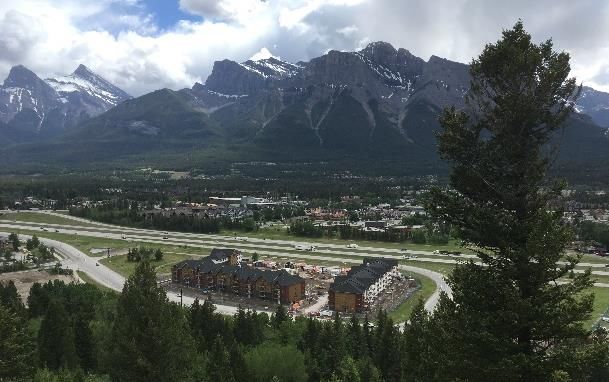
GROWTH VIA DEVELOPMENT

Driving Growth Via Development Strategy
  •   Generate NAV increases by completing developments at 100 to
      200 bps better than market capitalization rates
  •   Expand successful in-house development program to Ontario
      with the first development expected to commence in 2018
  •   Focus in areas with high asking prices for existing properties
      and long-term potential for high occupancy and rent increases
  •   Unique in-house development expertise provides flexibility in
      planning, scope changes, and controlling key processes
                                                                          Cambridge Bay, NU (36 Units)
                                                                                Completed in Q2 2017

                                            Airdrie, AB (140 Units)            Calgary, AB (261 Units)
                                            Completed in Q1 2016                Completed in Q4 2016

                                                                      7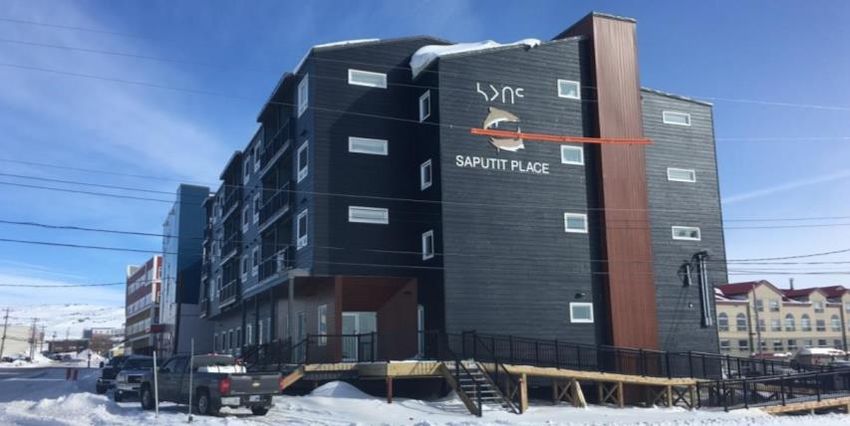
GROWTH VIA DEVELOPMENT
Development Pipeline with Proven Track Record
Over $270 million invested in developments over the past 5 years Region Units
Western Canada 1,260
Completing $57 million with 300 units of developments in 2018 Northern Canada 222
Atlantic Canada 31
New development starts of $50 - $100 million in 2018
Total Number of Units Completed 1,513
Developments Underway
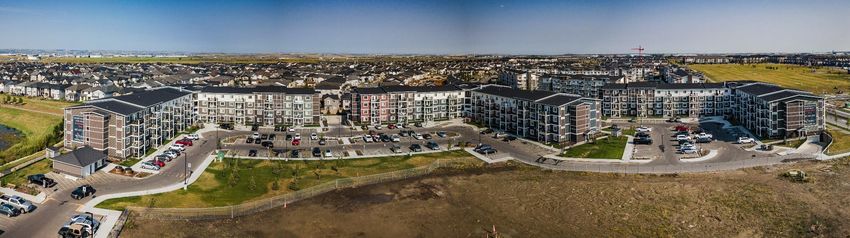
Canmore, AB Calgary, AB Phase 2
140 Units 158 Units
$25 million $30 million
Completing in September 2018 Commencing Q3 2018
Kitchener, ON Nanaimo, BC
(Photo of Site Location) (Photo of Site Location)
Commencing 2018 Commencing 2018/19
8
GROWTH VIA DEVELOPMENT

NAV Creation through Developments
                                  •      NAV increase of $25 million or $0.45 per Trust Unit in the past five years
                                  •      Contributing annual NOI of $20 million
Recently Completed Developments

                                      Regina, SK                                                      Iqaluit, NU
                                      132 units completed in Q1 2018                                  30 units and 11,400 s.f. completed in Q1 2018
                                      Total cost: $22.3 million                                       Total cost: $9.4 million
                                      Cost per door: $169,000                                         Cost per door: $220,000
                                      Stabilized Cap Rate: 7.5%                                       Stabilized Cap Rate: 9.5%
                                      Market Cap Rate: 5.5%                                           Market Cap Rate: 9.0%
                                      NAV Increase: $5.8 million                                      NAV Increase: $1.3 million

                                                                                                9
GROWTH VIA ACQUISITION

Active External Growth Acquisition Strategy
  •   Create NAV through organic growth in acquired portfolio in key
      growth markets
  •   Seek acquisition targets with ability to expand for VCIs, NOI and
      asset value growth, and improve quality of portfolio
  •   Ability to compete for acquisitions virtually in all markets across
      Canada including primary and secondary markets to further
      enhance diversification
  •   Leverage relationship with Starlight to access acquisition pipeline
      and off-market opportunities
                                                                                              49 Queen Street East, Cambridge, ON
                                                                                                                          Exterior

                                  Lobby                                     Recreation Room                                 Suite

                                                              10
GROWTH VIA ACQUISITION
Strong Acquisition Track Record
Continue to access substantial acquisition pipeline and off-market opportunities through Starlight relationship
2015
$1.4 Billion
13,558 Units
Transformative 2015 Transaction nearly doubled
2017 Northview in size to $3 billion in total assets, a strategic
response mitigating impact of regional economic
$239 Million downturns, led to fair value growth of $215 million in new
1,577 Units markets
2018
Largest Canadian multi-family acquisition
transaction in 2017 for $197 million in key growth
markets including ON and BC with organic growth $195 Million
opportunities to expand the proven high-end 760 Units
renovation program and enhancing portfolio quality
and diversification
A $152 million portfolio acquisition through
Starlight and majority of the properties are
recently constructed luxury rental apartments
11ORGANIC GROWTH
Creating Value Through Organic Growth
SD NOI and Occupancy
Same Door NOI Growth
10.0% 94.0%
• Expansion of same door NOI growth through initiatives
Multi-Family SD NOI Growth (%)
to maximize monthly rents, occupancy improvements, 5.0%
and expense management across the portfolio
92.0%
Occupancy (%)
• Potential for improvement in Western Canada resource 0.0%
based markets
-5.0%
Operating Expense Management 90.0%
-10.0%
• Negotiating new contracts, process improvements, and
leveraging economies of scale
-15.0% 88.0%
• Property management fully internalized on March 1,
2018, with annualized NOI growth of $2.9 million from
savings and creating opportunities for operating SD NOI Growth Occupancy Rate
efficiencies
• Expiry of transitional services agreement with Starlight
AMR
1,068
effective October 30, 2018
1,049 1,050
Value Creation Initiatives 1,041
1,033
• Ongoing contribution to organic growth 1,029
1,016
• Recent acquisitions generates new opportunities
Q4'16 Q1'17 Q2'17 Q3'17 Q4'17 Q1'18 Q2'18
12ORGANIC GROWTH
Realizing Organic Growth Through VCIs
Annualized NOI Increase
Cumulative
Target by 2020 Q2 2018 Progress
(in thousands of dollars, except per unit amounts) Progress1
High-end renovation program $5,800 $519 $3,110
Below market rent 5,200 558 4,549
Sub-metering program 2,500 14 469
Above guideline increases 800 5 551
Total $14,300 $1,096 $8,679
Initial assumed capitalization rate2 5.5% 5.5% 5.5%
Estimated value creation $260,000 $20,000 $158,000
Recent capitalization rate compression in Ontario to 4.5% increases target estimated value creation by $58 million
to $318 million from $260 million, and cumulative progress by $35 million to $193 million from $158 million
(1) Cumulative progress since November 2015.
(2) Assumed capitalization rate of 5.5% is based on the 2015 Transaction.
13ORGANIC GROWTH
VCIs: High-End Renovation Program
Proven Successful Track Record Before After
• Achieved return of 26% with
average rent increase of $283 per
suite in 2018
• Completed 500 suites in 2017 at an
average cost of $17,000 per suite
Expanding Program
• Initially 20 properties and 2,440
identified suites in 2015
• Expanded to 50 properties and
approximately 6,600 identified
suites including 1,100 from recent
acquisitions
14Strengthening Balance Sheet Positioned for Growth
Debt to Gross Book Value
• Reduction in leverage of 5.1% to 55.1% from fair 60.2%
value growth, non-core asset sales, and equity
offering
• Balanced approach to manage leverage includes
consideration of debt to gross book value, net debt to
EBITDA, and coverage ratios 55.1%
• Further leverage reduction will be achieved through
improvements in asset values with long term target
of 50% to 55% Q2'16 Q3'16 Q4'16 Q1'17 Q2'17 Q3'17 Q4'17 Q1'18 Q2'18
13.4x
Coverage Ratios1 Interest Debt Service Net Debt to EBITDA2
3.3x 12.2x
3.2x
3.0x
2.8x
2.6x 10.5x 10.6x
9.9x
1.7x 1.8x
1.5x 1.6x
1.4x
CAP Killam NVU InterRent Boardwalk
CAP Killam NVU InterRent Boardwalk
(1) NVU.UN, CAR.UN, BEI.UN, KMP, and IIP.UN based on trailing twelve months as of June 30, 2018.
(2) Source: BMO REIT Beat (dated August 10, 2018). Estimated Net Debt to EBITDA 2018 includes convertible debentures.
15Balanced Mortgage Maturity Profile
Current 5 year and 10 year CMHC interest rate of approximately 3.10% and 3.27%, respectively,
in-line with average mortgage interest rate of 3.22% as at June 30, 2018
900,000
4.48%
800,000
700,000 3.50%
3.29%
600,000
(thousands of dollars)
2.98%
2.76% 2.75%
500,000
400,000
300,000
200,000
100,000
0
2018 2019 2020 2021 2022 Thereafter
Principal on Maturity Principal Repayments 10 Year CMHC Rate Weighted Average Interest Rate
16Q2 2018 Financial Snapshot
Momentum Across Key Performance Indicators
Q2 2018 Q2 2017 Change
(in thousands of dollars, except per unit amounts)
NOI 52,754 48,253 9.3%
NOI margin 59.3% 58.8% 0.5%
Same door NOI change 3.3% 3.9% (0.6%)
Occupancy 93.3% 92.3% 1.0%
Average monthly rents 1,068 1,033 3.4%
FFO per unit $0.55 $0.54 1.9%
Growth from NOI and higher occupancy and monthly rents, more than offsets the impact of non-core asset
sales in 2017
Note: For three months ended June 30, unless otherwise stated.
17Experienced Management Team
Todd Cook Leslie Veiner
President & Chief Executive Officer Chief Operating Officer
• President & CEO since 2014 • COO since 2015
• CFO from 2006 to 2011 and President and COO in • Previously President & CEO of True North
2013 Apartment REIT from 2012 to 2015
• Previously CFO of TGS North American REIT from • Previously CFO of TransGlobe Apartment REIT
2003 until the acquisition by The Great-West Life from 2010 to 2012, employed by Chartwell
Assurance Company in 2006 Retirement Residences as SVP Real Estate from
2005 to 2008 and CFO from 2003 to 2005
Travis Beatty Bo Rasmussen
Chief Financial Officer Vice President, Property Development
• CFO since 2016 • VP, Property Development since 2011
• Previously CFO of West Valley Energy from 2012 to • Joined Northern Property REIT in 2007 as
2014 Manager of Construction and Development
• Various senior finance roles, including CFO, of OPTI • Previously VP Development for NewNorth
Canada from 2002 to 2011 Projects Ltd., predecessor to Urbco Inc. and
Northern Property REIT, from 2004 to 2007
Richard Anda Lizaine Wheeler
Vice President, Business Development Vice President, Residential Operations
• VP, Business Development since 2011 • VP, Residential Operations since 2012
• VP, Operations from 2004 to 2011 • Previously SVP Operations at Mainstreet Equity Corp
• Previously with Canada Mortgage and Housing from 2010 to 2012, and VP of Western Canada at
Corporation Boardwalk REIT from 1998 to 2010
18Trustees Committed to Strong Governance
Scott Thon Dennis Hoffman
Chair of Board of Trustees, Chair of Audit & Risk Management Committee,
President & CEO, AltaLink L.P. Corporate Director
Todd Cook Christine McGinley
President & CEO, Northview Apartment REIT Chair of Investment Committee,
Corporate Director
Daniel Drimmer Terrance McKibbon
President & CEO, Starlight Group Property Holdings Inc. COO, Bird Construction
Kevin Grayston
Chair of Governance, Compensation & Nomination
Committee,
Corporate Director
19Contact Information
Todd Cook
President & Chief Executive Officer
tcook@northviewreit.com
Travis Beatty
Chief Financial Officer
tbeatty@northviewreit.com
Leslie Veiner
Chief Operating Officer
lveiner@northviewreit.com
www.NorthviewREIT.com
General Investor Relations Inquiries
ir@northviewreit.com
(403) 531-0720
20Appendix – Regional Overviews
NOI Diversified Across Canada
21Regional Overview – Ontario
Enhance portfolio through successful execution on value creation
initiatives, potential development opportunities, and capital
redeployment into strong markets. Opportunities for internal and Kanata, ON
external growth from growing populations. Northview is present in Brockville, ON
18 Ontario markets with concentrations in Kitchener/Waterloo,
Ottawa, ON
London, Peterborough, and the Greater Toronto Area. Broad
provincial economic strength has led to favorable market Lindsay, ON
conditions. When combined with the VCIs, Northview is realizing Peterborough, ON
Toronto, ON
strong average rent increases and high occupancy.
Guelph, ON
Bowmanville, ON
Kitchener-Waterloo, ON
Oshawa, ON
London, ON Ajax, ON
St. Catharines-Niagara, ON
Sarnia, ON
Hamilton, ON
Southwestern ON: 5,064 Brantford, ON
Eastern ON: 1,773 Cambridge, ON
Toronto and Area: 2,008
8,845 22,000 $1.4 $55
Billion Million
Multi-Family Commercial
Investment NOI Trailing
Units Square Feet
Properties Twelve Months
Note: Regions with a portfolio of greater than 500 units are illustrated with a larger dot.
22Regional Overview – Ontario
$16 Ontario SD NOI and NOI 18%
$14 16%
NOI Multi-Family ($millions)
14%
SD NOI Multi-Family (%)
$12
12%
$10
10%
$8
8%
$6
6%
$4 4%
$2 2%
$0 0%
Q1 2017 Q2 2017 Q3 2017 Q4 2017 Q1 2018 Q2 2018
SD NOI (%) NOI ($)
100% Ontario Occupancy and AMR 1,060
98% 1,040
AMR ($dollars per month)
1,020
Occupancy (%)
96%
1,000
94%
980
92% 960
90% 940
Q1 2017 Q2 2017 Q3 2017 Q4 2017 Q1 2018 Q2 2018
Pictured Left: 294 Chandler Drive, Kitchener, ON
AMR ($) Occupancy (%)
Pictured Middle: River Park Towers, 740-758 Kipps Lane, London, ON
Pictured Right: Spring Garden Apartments, 155 Market Street, Hamilton, ON
23Regional Overview – Western Canada
Recent signs of stabilization leads to same door NOI growth and
potential future growth as markets recover. Well positioned to be Fort Nelson, BC Dawson Creek, BC
the first choice for new residents as the market recovers. Western Grande Prairie, AB
Canada, which includes the provinces of Alberta, British
Fort St. John, BC Bonnyville, AB
Columbia, and Saskatchewan, is driven by resource based
markets in the northern part of the region, in addition to balanced Chetwynd, BC Fort McMurray, AB
economies in primary markets in the southern part of the region.
Northview is a large landlord in many of the markets, such as Fort
McMurray, Grande Prairie, Lloydminster, Fort St. John, Dawson Prince George, BC
Creek and Nanaimo, and benefits directly from growth in those Nanaimo, BC
locations. Lloydminster, AB
Abbotsford, BC
Regina, SK
Airdrie, AB
BC: 2,853
Calgary, AB
AB: 4,282
Lethbridge, AB
SK: 563
7,698 145,000 $1.0 $49
Billion Million
Multi-Family Commercial
Investment NOI Trailing
Units Square Feet
Properties Twelve Months
Note: Regions with a portfolio of greater than 200 units in BC or 500 units in AB and SK or
recent developments are listed. Regions with a portfolio of greater than 500 units are
illustrated with a larger dot.
24Regional Overview – Western Canada
$14 Western Canada SD NOI and NOI 12%
$12 10%
NOI Multi-Family ($millions)
8%
SD NOI Multi-Family (%)
$10
6%
$8 4%
$6 2%
0%
$4
-2%
$2 -4%
$0 -6%
Q1 2017 Q2 2017 Q3 2017 Q4 2017 Q1 2018 Q2 2018
SD NOI (%) NOI ($)
90% Western Canada Occupancy and AMR 1,020
88%
AMR ($dollars per month)
1,000
Occupancy (%)
86%
980
84%
960
82%
80% 940
Q1 2017 Q2 2017 Q3 2017 Q4 2017 Q1 2018 Q2 2018
Pictured Left: Sheraton Apartments, 220 Timberline Drive, Fort McMurray, AB
AMR ($) Occupancy (%)
Pictured Middle: Seacrest Apartments, 1 Chapel Street, Nanaimo, BC
Pictured Right: McCarthy Ridge, 5920 Little Pine Loop, Regina, SK
25Regional Overview – Atlantic Canada
Growing population and strong market for growth opportunities.
Atlantic Canada, which includes the provinces of New Brunswick,
Nova Scotia, and Newfoundland and Labrador, is driven by the Labrador City, NL Gander, NL
resource based market in St. John’s, NL, in addition to the larger
urban markets of Halifax and Moncton, which serve as important
St. John’s, NL
hubs for economic activity, education, and government. The
Atlantic region is characterized by stable increasing average rents
and high occupancy due to the economic growth and stability.
Moncton, NB
Dieppe, NB
Shediac, NB
NB: 1,431 Dartmouth, NS
NS: 1,469
NL: 1,728 Halifax, NS
4,628 239,000 $458 $26
Million Million
Multi-Family Commercial
Investment NOI Trailing
Units Square Feet
Properties Twelve Months
Note: Regions with a portfolio of greater than 500 units are illustrated with a larger dot.
26Regional Overview – Atlantic Canada
$6 Atlantic Canada SD NOI and NOI 12%
10%
$5
NOI Multi-Family ($millions)
8%
SD NOI Multi-Family (%)
$4 6%
4%
$3 2%
0%
$2 -2%
$1 -4%
-6%
$0 -8%
Q1 2017 Q2 2017 Q3 2017 Q4 2017 Q1 2018 Q2 2018
SD NOI (%) NOI ($)
100% Atlantic Canada Occupancy and AMR 800
98% 780
AMR ($dollars per month)
Occupancy (%)
96% 760
94% 740
92% 720
90% 700
Q1 2017 Q2 2017 Q3 2017 Q4 2017 Q1 2018 Q2 2018
Pictured Left: 245 Innovation Drive, Halifax, NS
AMR ($) Occupancy (%)
Pictured Middle: 200 Broad Street., Halifax, NS
Pictured Right: 747 Coverdale Road, Moncton, NB
27Regional Overview – Northern Canada
Largest source of income and best performing region with stable
long-term leases to government agencies, high occupancy and
Inuvik, NT
monthly rents. The Northern region includes the central markets of
Yellowknife, NT, and Iqaluit, NU, in addition to Inuvik, NT, and
many small communities across Nunavut. The primary economic Cambridge Bay, NU
drivers are mining, tourism, government research and
administration. Over 50% of revenue is from government leases.
The region experiences high occupancy, due to consistent growth
and a lack of supply, and because of the high cost of operations Iqaluit, NU
and underlying economy, contributes to Canada’s highest rental
rates.
Yellowknife, NT
NT: 1,309
NU: 1,141
2,450 799,000 $625 $58
Million Million
Multi-Family Commercial
Investment NOI Trailing
Units Square Feet
Properties Twelve Months
Note: Regions with a portfolio of greater than 100 units in NT and NU or recent
developments are listed. Regions with a portfolio of greater than 500 units are illustrated with
a larger dot. Approximately 150 units located in smaller communities across Nunavut are not
shown.
28Regional Overview – Northern Canada
$12 Northern Canada SD NOI and NOI 7%
6%
$10
NOI Multi-Family ($millions)
5%
SD NOI Multi-Family (%)
$8 4%
3%
$6
2%
$4 1%
0%
$2
-1%
$0 -2%
Q1 2017 Q2 2017 Q3 2017 Q4 2017 Q1 2018 Q2 2018
SD NOI (%) NOI ($)
100% Northern Canada Occupancy and AMR 2,120
98% 2,100
AMR ($dollars per month)
2,080
Occupancy (%)
96%
2,060
94%
2,040
92% 2,020
90% 2,000
Q1 2017 Q2 2017 Q3 2017 Q4 2017 Q1 2018 Q2 2018
Pictured Left: Saputit Place, 935 – 937 Mivvik Street, Iqaluit, NU
AMR ($) Occupancy (%)
Pictured Middle: Bison Hill Apartments, 5465 52nd Street, Yellowknife, NT
Pictured Right: Parkview Manor, 2 Bootlake Road, Inuvik, NT
29Regional Overview – Québec
Organic growth opportunity from occupancy improvement.
Northview’s Quebec region is focused in the Montreal suburbs of
Pointe Claire and St. Laurent. Montreal is the largest rental market
in Canada and, consistent with Northview, demonstrates high
occupancy and stable average rents.
Sept-Iles, QC
Montreal, QC
QC: 2,485
2,485 4,000 $207 $11
Million Million
Multi-Family Commercial
Investment NOI Trailing
Units Square Feet
Properties Twelve Months
Note: Regions with a portfolio of greater than 500 units are illustrated with a larger dot.
30Regional Overview – Québec
$3.5 Quebec SD NOI and NOI 14%
$3.0 12%
NOI Multi-Family ($millions)
10%
SD NOI Multi-Family (%)
$2.5
8%
$2.0 6%
$1.5 4%
2%
$1.0
0%
$0.5 -2%
$0.0 -4%
Q1 2017 Q2 2017 Q3 2017 Q4 2017 Q1 2018 Q2 2018
SD NOI (%) NOI ($)
100% Quebec Occupancy and AMR 780
98% 760
AMR ($dollars per month)
Occupancy (%)
96% 740
94% 720
92% 700
90% 680
Q1 2017 Q2 2017 Q3 2017 Q4 2017 Q1 2018 Q2 2018
Pictured Left: Norgate & Renaissance, 1285 Decarie Street, Montreal, QC
AMR ($) Occupancy (%)
Pictured Middle: 105 Milton Street, Montreal, QC
Pictured Right: Cote Vertu I, 395 Cote Vertu , Montreal, QC
31Over 80% Portfolio in Large and Medium Population
Centres
Portfolio Breakdown by Market Type
2018 2015
Small Population
Centres
17% Small Population Large Urban
Centres Population Centres
36% 38%
Medium Population Large Urban
Centres Population Centres
25% 58%
Medium Population
Centres
26%
Note:
(1) Large Population Centres were considered as markets with a population of 100,000+ and includes all territorial capital cities.
(2) Medium Population Centres were considered as markets with a population of 30,000 to 99,999.
(3) Small Population Centres were considered as markets with a population of 29,999 or less.
(4) Units reported as at June 30, 2018 and as at September 30, 2015, prior to the 2015 Transaction.
32Northview Key Statistics
TSX: NVU.UN – Key Statistics
Market Capitalization ($billions) $1.6
Enterprise Value ($billions) $3.7
Annual Distributions Per Unit $1.63
Distribution Yield 6.3%
FFO Payout Ratio1 76%
Consensus AFFO Multiple2 14.5x
Multi-Family Units3 26,106
Commercial Square Feet (millions)3 1.2
Execusuites Units3 344
Occupancy3 93.3%
(1) Diluted FFO payout ratio excluding Non-recurring Items based on the most recently completed trailing 12 months.
(2) Source: CIBC as at August 15, 2018. Estimated consensus AFFO multiple for one year forward.
(3) As of June 30, 2018.
33NorthviewREIT.com Across Canada, Northview’s passion is providing our customers with a place to call home
You can also read