THINK OUTLETS. THINK TANGER - ManagementPresentation February14,2012
←
→
Page content transcription
If your browser does not render page correctly, please read the page content below
Management Presentation    February 14, 2012

THINK OUTLETS. THINK TANGER.
Disclaimer                                                                                2

This presentation includes time-sensitive information that may be accurate only as of
today’s date, February 14, 2012. Estimates of future net income per share and funds
from operations per share are, and certain other matters discussed in this presentation
regarding the state of the industry, our growth expectations and prospects, our
development, remerchandising and financial strategies, the renewal and re-tenanting
of space, tenant demand for outlet space in the US and Canada, access to capital,
ability to acquire assets opportunistically, pro-forma effects of a proposed term loan,
synergies expected to be achieved in acquiring centers in close proximity to existing
Tanger centers, interest rates, funds from operations and coverage of the current
dividend may be, forward-looking statements within the meaning of the federal
securities laws. These forward-looking statements are subject to risks and
uncertainties. Actual results could differ materially from those projected due to
various factors including, but not limited to, the risks associated with general
economic and local real estate conditions in the US and Canada, the company’s
ability to meet its obligations on existing indebtedness or refinance existing
indebtedness on favorable terms, the availability and cost of capital, the company’s
ability to lease its properties, the company’s inability to collect rent due to the
bankruptcy or insolvency of tenants or otherwise, working with joint venture partners,
and competition. For a more detailed discussion of the factors that affect our
operating results, interested parties should review the Tanger Factory Outlet Centers,
Inc. Annual Report on Forms 10-K for the fiscal years ended December 31, 2010 and
December 31, 2011, when available.

THINK OUTLETS. THINK TANGER.
Why                                   ?   3

•   Well-positioned for growth
•   Financial stewardship
•   Recession resilient
•   Proven record of value creation

    THINK OUTLETS. THINK TANGER.
Four-legged Growth Stool                       4

                               Opportunistic
  Existing                     Acquisitions
  Portfolio

                           Canadian Growth
      US Development        Opportunities
       Opportunities

THINK OUTLETS. THINK TANGER.
Organic Growth                                                                       5

       Same Center NOI                            Straight-line Blended
           Growth                                    Rental Increases

                      3.1%                 2006                    14.2%
2006

2007                              5.3%     2007                            22.6%

2008                       4.1%            2008                              25.9%

             1.4%                          2009                   14.3%
2009

                    2.6%                   2010                   13.8%
2010

2011                              5.3%     2011                            23.4%

         Tenant occupancy cost ratio has increased 90 basis points
           to 8.4% for 2011 from 7.4% for 2006 (see page 29 in appendix)

THINK OUTLETS. THINK TANGER.
A Long Runway for US Development 6
The outlet industry is small – about 50 million square feet,
which is smaller than the retail space in the city of Chicago
Recently Completed:
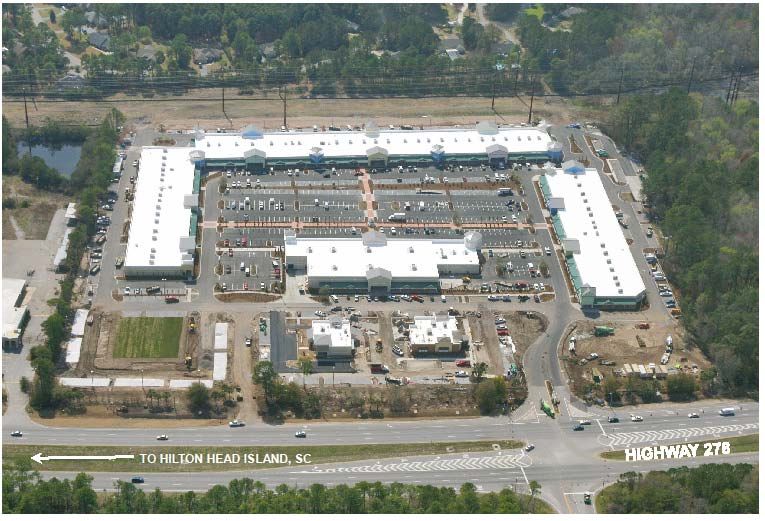
Attractive Supply • Hilton Head I, SC – opened March 31, 2011
Dynamic – • Mebane, NC – opened November 5, 2010
Tenant demand for Under Construction:
outlet space continues • Houston, Texas market near Galveston
and new supply is • Glendale, Arizona construction scheduled to
limited, with only a few begin late February 2012
disciplined public REIT
developers that have Pre-development:
access to capital and • Washington, DC market at National Harbor
the expertise to deliver • East of Phoenix in Scottsdale, Arizona
new outlet projects
Shadow Pipeline:
• Site selection continues in other identified
markets that are not served or underserved by
the outlet industry
THINK OUTLETS. THINK TANGER.
Canada – Taking the Brand International                                    7

The Next Frontier: US style outlet shopping is unrepresented in Canada.
Relative to the US (24.5 retail sf/person), Canada is under-retailed (16
retail sf/person). Both Canadian consumers and retailers on both sides
of the border are driving the demand for outlet expansion into Canada.

Recent Acquisition:
• Cookstown – 30 miles north of Toronto in Innisfil, Ontario

Pre-development:
• Halton Hills – 30 miles west of Toronto & 53 miles from Cookstown
• Kanata – a suburban Ottawa market

Shadow Pipeline:
• Site selection continues in other identified markets with the
  objective of providing tenants a platform of 10 – 12 outlet
  centers over the next 5 – 7 years

THINK OUTLETS. THINK TANGER.
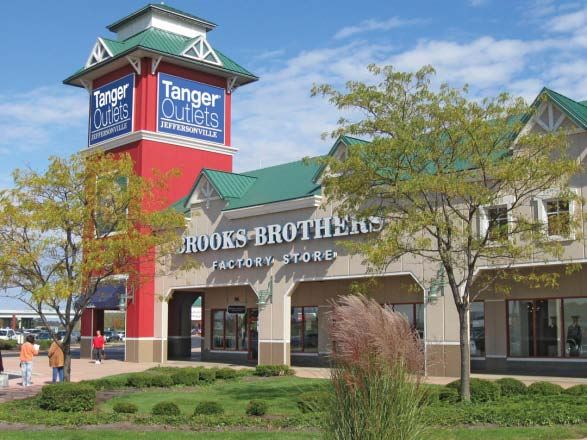
Growth Via Opportunistic Acquisitions                                        8

 The outlet industry is largely consolidated. Tanger estimates that Tanger
 & Simon collectively own more than 80% of all quality outlet assets, and
 benefit from the scale of their portfolios.

Acquisition opportunities are limited, but Tanger has sufficient
  access to capital to acquire quality assets opportunistically.

Recent acquisitions expanded footprint by approximately15%:
• Tanger Outlets Hershey (formerly The Outlets at Hershey)
• Tanger Outlets Atlantic City (formerly The Walk)
• Tanger Outlets Ocean City (formerly Ocean City Factory Outlets)
• Tanger Outlets Jeffersonville (formerly Prime Outlets Jeffersonville)
• Tanger Outlets Cookstown (formerly Cookstown Outlet Mall)

 THINK OUTLETS. THINK TANGER.
Financial Stewardship                                        9
                                                Funding
  Investment Grade                          Preference for
   Rated & Focused      Solid Coverage &      Unsecured
  on Moving Up the       Leverage Ratios      Financing –
     Ratings Scale                         Limited Secured
                                               Financing

      Maintain
                            Maintain       Use Off Balance
     Significant
                          Manageable         Sheet Joint
  Unused Capacity
                        Schedule of Debt    Ventures Only
   Under Lines of
                           Maturities      When Necessary
       Credit

                        Generate Capital     Disciplined
                            Internally      Development
  Limit Floating Rate
                          (Cash Flow in    Approach – Will
       Exposure
                            Excess of       Non Build on
                         Dividends Paid)        Spec

 THINK OUTLETS. THINK TANGER.
Quality Coverage & Leverage Ratios                                               10

Key Bond Covenants
As of 12/31/2011                                  Actual              Limit

Total debt to adjusted total assets                  47%             < 60%

Secured debt to adjusted total assets                 5%             < 40%

Unencumbered assets to unsecured debt               209%           > 135%

Interest coverage                                   4.4 x           > 1.5 x

                    S&P – BBB            Moody’s – Baa2
                    Most recent ratings agency action:
Standard & Poor’s revision of outlook to positive from stable on June 24, 2011

THINK OUTLETS. THINK TANGER.
Conservatively Structured Balance Sheet 11
Limited Use of Secured Line of Credit
Financing 1 Capacity 2
8%
21%
79%
92%
GLA encumbered Outstanding ($107.1 million)
GLA unencumbered Unused Capacity ($412.9 million)
2. Pro-forma to reflect closing &
1. Consolidated properties
funding of a $250 million 7 year term
loan with proceeds used to pay
down lines
As of December 31, 2011
THINK OUTLETS. THINK TANGER.Manageable Debt Maturities 12
$300.0
$250.0
$250.0
$107.1
$23.2
$31.3
$20.6
$10.0
$19.0
$10.6
'17-'19
'22-'23
'12
'13
'14
'25
Jan '16
June '16
June '20
Aug '15
Nov '15
Nov '16
Feb '19
Nov '21
Dec '24
Dec '26
Lines of Credit Lines of Credit Commitment
Mortgage Debt Term Loan (3)
Bond Debt Other Unsecured Debt
1. In millions as of December 31, 2011 & assuming all extension options exercised
2. Excludes pro-rata share of joint venture debt maturities
3. On a pro-forma basis to reflect expected late February 2012 closing and funding of syndicated $250 million 7 year
term loan, priced at L + 180 based on current credit ratings, with proceeds used to partially repay lines of credit
THINK OUTLETS. THINK TANGER.Limited Floating Reinvesting in the
Rate Exposure Company
13
Outstanding Debt 2011 FFO
$357.1 million
$63.7
35% $76.0
65%
$668.4 million
Excess Cash Flow
Fixed Rate Variable Rate
As of December 31, 2011 Common Dividends
In millions
THINK OUTLETS. THINK TANGER.Disciplined Development Approach 14
Internal Guidelines for Buying Land: Predevelopment Costs are Limited to:
• Positive due diligence results • Costs to control the land (option
contract costs)
• 50% or greater preleasing with
acceptable tenant mix & visibility • Pre-leasing costs
of reaching 75% preleasing
• Due diligence costs
• Receipt of all non-appealable
permits required to obtain building
permit
• Acceptable return on cost analysis
Tenured Management Team:
Executives average 14 years of service to Tanger, and even more to the industry
THINK OUTLETS. THINK TANGER.Recession Resiliency 15
“In good times people love a bargain, and
in tough times, people need a bargain.”
~ Steven B. Tanger, CEO & President
THINK OUTLETS. THINK TANGER.Strong Occupancy Over the Long Term 16
Have Ended Each Year Since IPO With Occupancy of 95% or Greater
98%
99%
99%
99%
98%
98%
98%
98%
98%
99%
97%
97%
97%
97%
97%
96%
96%
96%
96%
1993
1994
1995
1996
1997
1998
1999
2000
2001
2002
2003
2004
2005
2006
2007
2008
2009
2010
2011
Represents year end occupancy
THINK OUTLETS. THINK TANGER.Long Term Tenant Sales Growth 17
For over 30+ years of economic cycles and the related peaks and valleys,
tenant sales have trended positively
3%
CAGR
$366
$354
$339
$281
$226
1995 2000 2009 2010 2011
THINK OUTLETS. THINK TANGER.Stable Annual Lease Expirations 18
Percentage of Annual Percentage of Total
Base Rent GLA
2012 10% 2012 11%
2013 18% 2013 18%
2014 13% 2014 13%
2015 12% 2015 12%
2016 14% 2016 14%
2017 9% 2017 8%
2018 6% 5%
2018
2019 3% 2019 3%
2020 4% 2020 6%
2021 8% 8%
2021
2022+ 3% 2022+ 2%
2012 expirations shown net of renewals executed through December 31, 2011
THINK OUTLETS. THINK TANGER.Geographic Diversification 19 Well positioned portfolio of 39 outlet centers in 25 states coast to coast & in Canada, totaling approximately 11.8 million square feet THINK OUTLETS. THINK TANGER.
Strong Tenant Mix                                                                                          20

                    Diversified tenant base, the majority of which are
                        publicly-held, high credit quality retailers

                                                                                                       62.1%

   8.0%      6.5%
                       3.5%       3.4%      3.1%      3.0%       2.8%      2.7%      2.6%       2.3%

    Properties are easily reconfigured to minimize tenant turnover downtime
Chart is in terms of GLA as of December 31, 2011 & includes all retail concepts of each tenant group

 THINK OUTLETS. THINK TANGER.
Proven Record of Value Creation 21
Total Return to Shareholders
200
150
100
50
0
2006 2007 2008 2009 2010 2011
Tanger NAREIT All Equity REIT Index SNL REIT Retail Shopping Ctr Index
THINK OUTLETS. THINK TANGER.History of Dividend Growth 22
Tanger has increased its dividend each year and
has paid a cash dividend every quarter since its IPO
$0.8000
$0.7752
$0.7652
$0.7600
$0.7200
$0.6800
$0.6452
$0.6252
$0.6152
$0.6128
$0.6100
$0.6076
$0.6052
$0.6000
$0.5500
$0.5200
$0.5000
$0.4600
$0.2388
1993
1994
1995
1996
1997
1998
1999
2000
2001
2002
2003
2004
2005
2006
2007
2008
2009
2010
2011
Dividend increased in 2011 to $0.80 per share annually from $0.775
Split-adjusted
THINK OUTLETS. THINK TANGER.Total Enterprise Value Growth 23
14%
CAGR
$3.9
$3.1
$2.5
$2.2 $2.2 $2.3
$1.8
2005 2006 2007 2008 2009 2010 2011
In billions
THINK OUTLETS. THINK TANGER.FFO Growth 24
Million $$ $$ Per Share
$157.7 $1.60
$141.3 $1.47
$1.33
$123.2
92,523,000 shares
96,021,000 shares
98,557,000 shares
12 % increase
15% increase
13%
Increase
2010 Adj. (1) 2011 Adj. (2) 2012E Adj. (3)
2010 Adj. (1) 2011 Adj. (2) 2012E Adj. (3)
1. Excludes $6.7 million charge for write-off of unamortized loan costs and settlement of interest rate swaps associated with the prepayment of a $235 million
term loan, $2.5 million reduction in net income related to the redemption of preferred shares and $0.9 million in other charges related to impairment,
demolition, and gain on sale of outparcels that we believe are not indicative of our ongoing operations (collectively $0.11 per share)
2. Excludes $2.7 million in charges related to acquisition costs and $0.2 million of abandoned development costs that we believe are not indicative of our
ongoing operations (collectively $0.03 per share)
3. Per share amount represents midpoint of guidance; Dollar amount represents per share amount multiplied by the weighted average budgeted common
shares outstanding for 2012
THINK OUTLETS. THINK TANGER.In Summary: Investment Highlights 25
• Well-positioned for growth
• Financial stewardship
• Recession resilient
• Proven record of value creation
THINK OUTLETS. THINK TANGER.26
Appendix – Financial
THINK OUTLETS. THINK TANGER.Reconciliation of Guidance: 27
Net income to FFO
Low High
Range Range
Estimated diluted net income per common share $0.60 $0.66
Non-controlling interest, gain/loss on the sale of real
estate, depreciation and amortization
uniquely significant to real estate including
non-controlling interest share, and our share
of joint ventures 0.97 0.97
Estimated diluted FFO per share $1.57 $1.63
THINK OUTLETS. THINK TANGER.2011 Financing Transactions 28
• On November 10, completed the recast of our unsecured lines of
credit, using proceeds to repay $150.0 million bridge loan in full
• increased capacity from $400 million to $520 million (with
accordion for expansion to $770 million)
• extended maturity from November 2013 to November
2015 plus a one year extension option
• improved pricing from LIBOR + 190 plus 40 bps annual
facility fee to L +125 bps plus 25 bps facility fee
• On July 6, completed a public offering of 4.6 million shares at a
price of $25.662 per share, using proceeds of $117.4 million, net of
offering expenses, to repay borrowings under unsecured lines of
credit
• On June 27, closed on a $150 million unsecured 90-day bridge loan
with Wells Fargo, priced at L + 160 basis points, which included
three 90-day extension options, using proceeds to fund the
acquisition of the 410,000 sf outlet center in Jeffersonville, OH
THINK OUTLETS. THINK TANGER.Tenant Occupancy Cost 29
8.2% 8.5% 8.3% 8.4%
7.7%
7.4%
2006 2007 2008 2009 2010 2011
THINK OUTLETS. THINK TANGER.30
Appendix –
New Developments,
Projects Under Development,
& Pre-development
THINK OUTLETS. THINK TANGER.Hilton Head I, SC 31 • 177,000 sf GLA plus 4 outparcel pads • $43 million investment • Shopper-friendly redevelopment is the 1st LEED® certified green shopping center in Beaufort County, SC • Grand opening March 31, 2011 • Occupancy of 98% as of December 31, 2011 • Tenants include Adidas, BCBG, Brooks Brothers, J. Crew, Joe’s Jeans, Kenneth Cole, New Balance, Saks Off Fifth, Talbots, Theory, Under Armour, & more THINK OUTLETS. THINK TANGER.
Mebane, NC                                                        32

•   319,000 sf development
•   $64.9 million investment
•   Grand opening November 5, 2010
•   Opened fully leased
•   Tenants include Saks Off Fifth, Coach, Polo, J.Crew, Gap, Banana
    Republic, Nike, Tommy Hilfiger & more

    THINK OUTLETS. THINK TANGER.
33 Houston JV with Simon • 50/50 joint venture to develop a of a Tanger Outlet Center • 30 miles South of Houston and 20 miles North of Galveston in Texas City, TX • Located on Interstate 45 –daily traffic count of 100,000 • 55 acre site will accommodate a 350,000 sf phase I development, with ample room for future expansion to 470,000 sf • Ground breaking ceremony held August 30, 2011 • Targeted grand opening in time for Holiday 2012 THINK OUTLETS. THINK TANGER.
Canadian Platform – RioCan Co-Ownership                                                               34

                                                                 •   50/50 co-ownership agreement to
                                                                     establish an outlet platform in
                                                                     Canada
                                                                 •   Properties will be branded as
                                                                     Tanger Outlet Centers
Halton Hills Site

                                                                 •   Potential openings of 10 – 12 outlet
                                                                     centers over the next 5 – 7 years
                                                                 •   Tanger will be responsible for
                                                                     leasing
                                                                 •   Riocan will be responsible for
                                                                     development & management

Pre-development/Expansion Sites:
•                   Halton Hills – potential development site identified approximately 30 miles west of
                    Toronto, located on Highway 401 at the James Snow Parkway interchange
•                   Kanata – potential development site identified in a suburban market of Ottawa
•                   Cookstown – recently acquired property with 159,000 sf in Innisfil approximately 30
                    miles north of Toronto may be expanded to double its current size

      THINK OUTLETS. THINK TANGER.
35
Overbuilding?
• Strong performance relative to other retail property types has resulted in outlet
project development announcements by new entrants to the outlet space
• Excluding Tanger and Simon, few projects that are announced ever open for
business
• 10 years ago (May 2001 VRN) : 12 announced, 1 completed
• 5 years ago (May 2006 VRN): 9 announced, 1 completed
• Last year (May 2010 VRN): 31 announced, 1 completed
• August 2011 VRN data supports thesis of disciplined development in the outlet
industry
• Single digit grand openings per year since 1997
• All outlet centers opened since 2001 are still open and operating as outlet
centers
• Tenants want a developer that can deliver, and Tanger has a proven, 30-year
track record of delivering quality outlet centers
THINK OUTLETS. THINK TANGER.36
Appendix –
Acquisitions
THINK OUTLETS. THINK TANGER.2011 Acquisitions 37
Expanded geographic reach into 3 additional states and increased
portfolio size by 1.5 million square feet with the transactions listed below
• On June 28, closed on the acquisition of Prime Outlets at Jeffersonville in Jeffersonville, OH for $134.0
million in cash
• On July 15, announced closing on Tanger’s admission as a member into 3 existing entities, which
resulted in our acquisition of substantially all of the economic interests in Ocean City Factory Outlets
and phases I & II of Atlantic City Outlets The Walk (Atlantic City phase III closed in November 2011)
• Combined purchase price for all phases of Atlantic City & Ocean City is expected to be
approximately $200.3 million, consisting of $116.8 million in cash (of which $3.0 million is
currently contingent consideration) and the assumption of $83.5 million of debt
• On September 30, closed on the acquisition of substantially all of the economic interests in The Outlets
at Hershey for $56.0 million, including approximately $24.6 million in cash and the assumption of
approximately $31.4 million of indebtedness
• On December 9, with RioCan under a 50/50 co-ownership agreement, closed on the acquisition of
Cookstown Outlet Mall for $47.4 million (for 100% in USD) plus an additional $13.8 million for excess land
payable upon the seller meeting certain conditions, for an aggregate purchase price of $61.2 million,
including the assumption of $29.6 million of debt
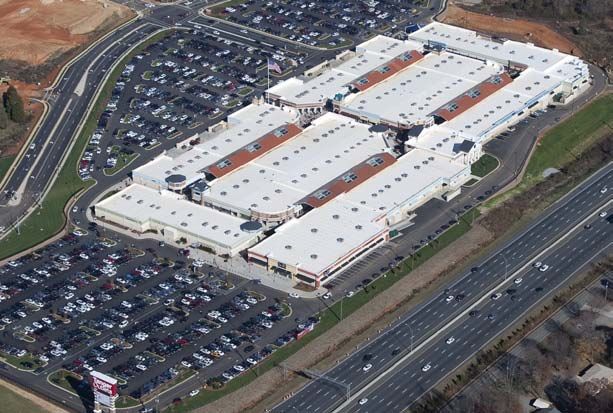
THINK OUTLETS. THINK TANGER.Jeffersonville, OH
38
• Formerly Prime Outlets – Jeffersonville
• 410,000 sf
• June 28, 2011 acquisition date
• 99% occupancy upon acquisition
• Over 90 brands including: Ann Taylor, Banana Republic, Brooks
Brothers, Coach, J. Crew, Gap, Kate Spade, Nike, Polo, Pottery
Barn, Under Armour, and more
• Located in the tri-city area of Cincinnati, Columbus, & Dayton
• 4.4 million population within a 60 mile radius
THINK OUTLETS. THINK TANGER. 3839 Atlantic City, NJ • Formerly known as The Walk • 3 phases totaling 490,000 sf • July 15, 2011 acquisition date for phases I & II, November 1 acquisition date for phase III • Occupancy upon acquisition: • Phases I & II – 99% • Phase III – 100% • Over 100 brands including: Adidas, Banana Republic, Brooks Brothers, Calvin Klein, Coach, Donna Karan, Gap Generation, H&M, J. Crew, Kenneth Cole, Nike, Polo, St. John, and more • Streetscape center is spread out across 3 city blocks and located across from The Boardwalk • Atlantic City welcomes 34 million tourists annually THINK OUTLETS. THINK TANGER. 39
Ocean City, MD
                                                                      40

• 199,000 sf
• July 15, 2011 acquisition date
• 93% occupancy upon acquisition
• Located along Route 50 in Ocean City, a popular vacation
  destination for the DC & Baltimore areas
• Approximately 40 brands including: Aeropostale, Calvin Klein,
  Carter’s, The Children’s Place, Gap, Izod, Jos. A. Bank, Justice,
  Oshkosh B’Gosh, Reebok, Rue21, Tommy Hilfiger, and more
• Synergies expected as a result of close proximity to Tanger Outlets
  Rehoboth, located approximately 30 miles away in Rehoboth,
  MD

THINK OUTLETS. THINK TANGER.                                               40
Hershey, PA 41 • Formerly The Outlets at Hershey • 247,000 sf • September 30, 2011 acquisition date • 100% occupancy upon acquisition • Located adjacent to Hershey Chocolate World & Amusement Park on Route 39 near interstate 81 • Nearly 60 brands including: Aeropostale, Brooks Brothers, Calvin Klein, Coach, Gap, J. Crew, Nautica, Nine West, Oshkosh B’Gosh, Polo Ralph Lauren, Under Armour and more • Synergies expected as a result of close proximity to Tanger Outlets Lancaster located approximately 30 miles away in Lancaster, PA THINK OUTLETS. THINK TANGER. 41
Cookstown – Innisfil, Ontario                                        42

• Formerly Cookstown Outlet Mall
• Currently 159,000 sf expandable to
  320,000 sf
• December 8, 2011 acquisition date,                     o be co-
  co-owned 50/50 with RioCan
• 100% occupancy upon acquisition
• Tenants include Coach, Tommy Hilfiger, Toys R Us, Rockport and
  more
• Located 30 miles north of the Greater Toronto Area, directly off
  Highway 400 and approximately 53 miles from Halton Hills site
• Providing traction to the Canadian Tanger Outlet Center
  platform/co-ownership agreement with RioCan

THINK OUTLETS. THINK TANGER.
43

THINK OUTLETS. THINK TANGER.
Tanger Factory Outlet Centers, Inc., (NYSE:SKT) is a publicly traded REIT
headquartered in Greensboro, North Carolina that operates and owns or
has ownership interests in, a portfolio of 39 outlet centers in 25 states coast
to coast and in Canada, totaling approximately 11.8 million square feet,
leased to over 2,500 stores that are operated by more than 450 different
brand name companies. More than 175 million shoppers visit Tanger Outlet
Centers annually. For more information on Tanger Outlet Centers, call
1-800-4-TANGER or visit the company’s web site at www.tangeroutlet.com

                              CORPORATE HEADQUARTERS
                            3200 Northline Avenue, Suite 360
                                 Greensboro, NC 27408
                          336.292.3010 www.tangeroutlet.com

                     A New York Stock Exchange Listed Company: SKT

THINK OUTLETS. THINK TANGER.
You can also read