NYSE: GLT August 3, 2021 - 2021 Second Quarter Earnings Conference Call Dante C. Parrini, Chairman & CEO - Glatfelter
←
→
Page content transcription
If your browser does not render page correctly, please read the page content below
2021 Second Quarter Earnings Conference Call
Dante C. Parrini, Chairman & CEO
Samuel L. Hillard, SVP & CFO

August 3, 2021
NYSE: GLT

Forward Looking Statements and Use of
    Non-GAAP Financial Measures

    Any statements included in this presentation which pertain to future financial and business matters are “forward-
    looking statements” within the meaning of the safe harbor provisions of the United States Private Securities
    Litigation Reform Act of 1995. The Company uses words such as “anticipates”, “believes”, “expects”, “future”,
    “intends” and similar expressions to identify forward-looking statements. Any such statements are based on
    management’s current expectations and are subject to numerous risks, uncertainties and other unpredictable or
    uncontrollable factors that could cause future results to differ materially from those expressed in the forward-looking
    statements including, but not limited to: the impacts of the COVID-19 pandemic, changes in industry, business,
    market, political and economic conditions globally, demand for or pricing of its products, changes in tax legislation,
    governmental laws, regulations and policies, initiatives of regulatory authorities, technological changes and
    innovations, market growth rates, and currency exchange rates. In light of these risks, uncertainties and other
    factors, the forward-looking matters discussed in this presentation may not occur and readers are cautioned not to
    place undue reliance on these forward-looking statements. The forward-looking statements speak only as of the
    date of this presentation and Glatfelter undertakes no obligation, and does not intend, to update these forward-
    looking statements to reflect events or circumstances occurring after the date of this presentation. More information
    about these factors is contained in Glatfelter’s filings with the U.S. Securities and Exchange Commission, which are
    available at www.glatfelter.com.

    During the course of this presentation, certain non-U.S. GAAP financial measures will be presented. A
    reconciliation of these measures to U.S. GAAP financial measures is included in the appendix of this presentation.

2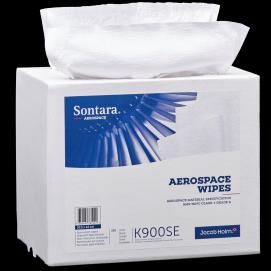
Highlights – Q2 2021
    • Adjusted EBITDA of $28 million in-line with expectations
        − Adjusted EPS of $0.18, ahead of expectations driven primarily by a lower tax rate
        − Airlaid segment finished the quarter strong with improving demand conditions

    • Airlaid Materials outperformed expectations for the quarter driven by
      rebound in tabletop category and performance of Mount Holly

    • Composite Fibers’ profitability below expectations driven by unfavorable
      sales mix and higher energy prices
    • All production locations remained operational
    • Net Leverage 3.1x at June 2021 following Mount Holly acquisition

    • Recent announcement to acquire Jacob Holm will add scale and provide a
      best-in-class suite of nonwovens technologies, applications, and
      products to serve customers’ growing global demand

3
Adjusted EPS – Q2 2021 vs. Q2 2020

                                                                                                                        $0.08           $-       $ (0 . 1 6 )

      $0.22     $ (0 . 0 1 )
                               $ (0 . 0 6 )
                                                                                                             $0.22
                                                   $0.03                $-          $-            $0.18
                                                                                                                                                                                                             $-          $ (0 . 0 1 )
                                                                                                                                                                                         $0.03                                           $0.18

                                                                                                                                                                    $0.02

     Q 2 2020      CF           AM             C o rp o ra t e         Net          Ta x e s ,   Q 2 2021   Q 2 2020   S e llin g   V o lu m e    RM &          O p e ra t io n s        C o rp .          Ta x e s ,       FX          Q 2 2021
                                              U n a llo c a t e d   In t e re s t   S h a re s                          P ric e       / M ix     E n e rg y                         U n a llo c a t e d   S h a re s &
                                                                                    & O ther                                                      C o s ts                                                 O ther

On a GAAP basis, net income from continuing operations for Q2 2021 was $1.5 million or $0.03 per share
    compared to net loss from continuing operations of $2.3 million or $(0.05) per share in Q2 2020.

 4
Composite Fibers Q2 2021 Highlights
                                                                                   • Revenue up 7.1% versus Q2 2020 on constant
                                                                                     currency
     Dollars in Thousands             Q2 2020      Q1 2021           Q2 2021
                                                                                      −   Selling prices higher by $2 million
     Tons shipped (MT)                   29,032          34,140         34,471        −   Volume up 26% (excluding metallized)
                                                                                              o   Wallcover up 95%
     Net sales                         $122,137     $141,249          $141,598
                                                                                              o   Technical Specialties up 27%
     Operating income                   $11,487      $16,065           $11,063                o   Composite Laminates up 15%
                                                                                              o   Food & Beverage down 11%
     EBITDA                             $17,919      $23,047           $18,061                o   Metallized products down 28% (restructured in Q2 2020)

     EBITDA margin                       14.7%           16.3%          12.8%      • Raw material and energy prices unfavorable $6.0
                                                                                     million mainly due to higher wood pulp and
                             $1.2    $(6.0)                                          energy prices but partially offset by selling price
                 $2.0
                                                  $3.0
                                                                                     increases
    $11.5                                                     $0.6      $11.1
                                                                                   • Operations favorable $3.0 million driven by strong
                                                                                     production in Dresden and Gernsbach to meet
                                                                                     customer demand
                                                                                   • Outlook (Q3 2021 versus Q2 2021)
                                                                                      −   Expect shipments to be 2% to 3% higher, favorably impacting
Q2 2020       Selling       Volume    RM &    Operations      FX       Q2 2021
Operating      Price         & Mix   Energy    & Other                 Operating          operating profit by approximately $0.4 million
 Income                                                                 Income        −   Higher selling prices expected to fully offset higher raw material,
                                                                                          energy and logistics inflation
                                                                                      −   Operations expected to be in-line with the second quarter

5
Airlaid Materials Q2 2021 Highlights
                                                                                    • Revenue up 5.0% versus Q2 2020 on constant
       Dollars in Thousands          Q2 2020      Q1 2021          Q2 2021            currency, including six weeks of Mount Holly
                                                                                      acquisition in Q2 2021
       Tons shipped (MT)                33,277           28,864         34,315         −   Volume up 3% but unfavorable mix
       Net sales                       $94,046      $84,425           $103,313                 o   Tabletop up 177%
                                                                                               o   Wipes up 9%
       Operating income                $12,292           $7,197         $8,431
                                                                                               o   Home Care products down 5%
       EBITDA                          $17,765      $13,046            $15,197
                                                                                               o   Hygiene products down 13%
       EBITDA margin                    18.9%            15.5%          14.7%
                                                                                    • Higher selling prices reflect the contractual
                                                                                      pass-through of higher raw material prices
                                                                                       −   Price inflation in nearly all raw materials
             $3.5         $(0.9)
                                    $(4.3)                                          • Operations unfavorable $1.9 million mainly
  $12.3                                                                               driven by lower production to manage elevated
                                                $(1.9)                                inventory
                                                             $(0.3)       $8.4
                                                                                    • Outlook (Q3 2021 versus Q2 2021)
                                                                                       −   Expect shipments to be 15% to 20% higher
                                                                                       −   Higher selling prices expected to fully offset higher raw
                                                                                           material, energy and logistics inflation
                                                                                       −   Higher production to meet customer demand and prepare for
 Q2 2020     Selling     Volume     RM &     Operations       FX         Q2 2021           a Q4 machine upgrade is expected to favorably impact
Operating     Price       & Mix    Energy     & Other                   Operating          operating profit by $1 to $2 million
 Income                                                                  Income

   6
Corporate Costs and Other Financial items
Details of Other and Unallocated
The following sets forth details of ‘Other and Unallocated’ amounts presented in the Company’s Segment
Financial Information included in total operating income in the earnings release.
• Corporate costs $1.9 million lower
(in millions) Q2 2020 Q2 2021 YTD 2020 YTD 2021 than Q2 2020 and $3.0 million
Restructuring charge – Metallized operations
lower June YTD 2021
(5.1) - ($11.1) -
Cost optimization actions (1.3) - (3.1) - • Strategic initiatives costs of $8.4
Timberland sales and related costs 0.6 1.6 0.6 2.4 million YTD related to acquisition
COVID-19 incremental costs (1.2) - (1.2) - activities including Mount Holly
Strategic initiatives - (7.8) - (8.4)
and recently announced Jacob
Asset impairment charge
Holm transaction
(0.9) - (0.9) -
Corporate headquarters relocation - (0.2) - (0.4) • Outlook (FY 2021)
Special items excluded from adjusted earnings (7.9) (6.5) (15.6) (6.4)
− Corporate costs estimated to be
Corporate costs* (6.8) (4.9) (13.9) (10.9) approximately $23 million in 2021
Total corporate costs & other financial items (14.7) (11.4) (29.5) (17.3)
− Interest expense & other financial costs
estimated to be ~$11 million (reflects
Mount Holly acquisition)
− Expect full year tax rate to be
approximately 38% to 40%
Notes: * Corporate costs are primarily comprised of employee costs, legal fees, and professional services fees. The sum of individual amounts set forth above may not agree to the column totals due to rounding.
7Cash Flow
(in millions) Q2 2020 Q2 2021 H1'20 H1'21
• YTD cash flow from continuing operations $2.3 Adjusted EBITDA $29.0 $28.5 $61.2 $59.2
million higher versus last year Change in working capital (*) (16.6) (10.2) (39.1) (37.9)
• Adjusted Free Cash Flow lower by ~$6 million Taxes paid (1.2) (3.6) (4.7) (7.1)
Interest paid (1.7) (1.5) (3.2) (2.9)
− Cash flow used for working capital is unfavorable
after adjusting for special items Other (4.7) (5.7) (15.2) (9.9)
Cash Flow from continuing Operations $4.7 $7.4 ($0.9) $1.4
• 2021 Outlook: Less: Capital expenditures (5.0) (5.8) (12.0) (11.2)
− Expect capital expenditures to be approximately $30 Free Cash Flow ($0.3) $1.6 ($12.9) ($9.8)
to $35 million Less: Adjustments to Free Cash Flow 12.4 2.6 14.5 5.0
Adjusted Free Cash Flow $12.1 $4.1 $1.6 ($4.8)
• Includes capital spending at Mount Holly for
initial development to stand up an integrated
IT system as well as on-going capital for the
remainder of 2021
Notes:
− Expect depreciation and amortization expense to be (*) - Working capital is defined as accounts receivable plus inventories less
approximately $60 million (includes Mount Holly) accounts payable.
The sum of individual amounts set forth above may not agree to the column
totals due to rounding.
(1) – Slide 27 in appendix includes the details for the Adjustments to Free Cash Flow and recasts prior quarters to align with full year presentation
8Balance Sheet and Liquidity
(in millions) 31-Dec-19 31-Dec-20 30-Jun-21
• Higher leverage of 3.1x as of June Cash $126.2 $99.6 $84.2
30, 2021 versus 1.8x as of
December 31, 2020 driven by Debt
Mount Holly acquisition in Q2 2021 Current portion of long term debt 22.9 25.1 24.3
for $175 million Short term debt - - 11.9
Term Loans 1.3% - 2.4% due 2022 - 2025 255.1 253.5 233.4
• December 2019 cash includes ~ Revolving credit agreement 84.3 36.8 213.5
$53.4 million related to pension Unamortized deferred financing costs (2.4) (1.9) (1.6)
settlement Total Debt 359.9 313.5 481.4
• Continue to maintain adequate Net Debt $233.7 $213.9 $397.2
liquidity of ~$200 million Shareholders’ Equity $556.0 $577.9 $571.2
TTM Adj. EBITDA (*) 106.7 119.6 128.0
Net Leverage 2.2x 1.8x 3.1x
Available Liquidity $200.4 $274.8 $197.1
Notes:
(*) TTM Adjusted EBITDA as of June 30, 2021 includes $10.4 million of Mount Holly EBITDA for 10.5 months not under Glatfelter
The above calculation is not intended to be used for purposes of calculating debt covenant compliance.
The sum of individual amounts set forth above may not agree to the column totals due to rounding.
9Jacob Holm Nonwovens Acquisition
Will add Scale, New Technologies and Product Categories
• Signed definitive agreement to purchase Jacob Holm nonwovens business for $308M and expected to
close later this year
− Headquartered in Basel, Switzerland with four manufacturing facilities in the US (2), France and Spain
• A global leader in sustainable materials for personal care, hygiene, industrial and medical applications
• Expands Glatfelter’s footprint and income generation in the U.S. and Asia Pacific regions
• 6/30/2021 LTM Revenues and EBITDA of approximately $400 million and $45 million, respectively
− June LTM results include a benefit from COVID-related demand estimated to be $10 million to $15 million of EBITDA
• Acquisition to be financed with issuance of new $550 million senior unsecured bond with transaction
costs and fees expected to be ~$25 million
• Synergistic acquisition adding new technologies and product categories, while enabling product line
optimization, operational improvements, strategic sourcing savings and cost reductions
− Expected annual synergies of ~ $20 million within 24 months
• Net Leverage expected to increase from 3.1x at June 30, 2021 to ~ 4.0x after acquisition of Jacob Holm
based on combined EBITDA, inclusive of $20 million of transaction synergies (1)
(1) - Normalized for Covid related tailwinds experienced in 2020 and LTM June 2021
10Jacob Holm: Company Overview
• A global leader in spunlace nonwovens for the personal Expansive product portfolio focused
on attractive, diversified segments
care, hygiene, industrial and medical end markets
• Operates four manufacturing facilities with eight
production lines
• Organized into three business units: Sontara Professional, Medical Beauty
Health & Skin Care, and Personal Care
• Headquartered in Basel, Switzerland
2020 Sales by Segment 2020 Sales by Region Automotive Hygiene
APAC
12%
Sontara
Personal Professional
34% Americas
Care
56% Household Electronics
41%
EMEA
32%
Health &
Skin Care
25%
Hospitality / food Printing
11Jacob Holm: Business Line Overview
Sontara Professional Health & Skin Care Personal Care
% of Revenue
34% 25% 41%
(FY2020A)
• Health Care: Gowns & drapes, • Consumer wipes: baby wipes,
• Critical Cleaning: Aerospace & life
wound care, face mask household wipes, and dispersible
science, clean room and printing
Key Products components wipes
• High Performance Materials:
• Beauty Care: Facial masks, face • Hygiene: Baby care, feminine
Acoustics and aramid fabrics
wipes, and body wipes care, adult care
Cleanroom and Aerospace Wipes
Product
Examples
Customer
Examples
11%
26% Americas Americas Americas
Revenue by EMEA 36% 35% EMEA 38%
Geography 63% Asia Asia 62% EMEA
(FY2020A) 29%
12Glatfelter’s Ongoing Strategic Transformation
2022 & Beyond
2018 - 2021
Pre-2018
• Expanded internationally acquiring • Sale of Specialty Papers • Acquired 2 Georgia-Pacific • Execute on integration
Schoeller & Hoesch GmbH creating business creates more airlaid facilities to capture and of recently announced
Composite Fibers business service long term demand for health acquisitions with a focus
growth focused and stable
and hygiene products on synergy capture and
• Acquired Lydney, UK facility to Engineered Materials platform
deleveraging
expand tea and coffee business • Issued first “Sustainability”
• Terminated and settled report in 2020 formalizing our ESG
• Acquisition of Concert Industries qualified pension plan and priorities • Accelerate innovation
creates Airlaid Materials business reverted $33 million cash back to further expand
to company • Relocated Corporate engineered materials
• Dresden acquisition adds Nonwoven product portfolio
Wallcover product line Headquarters to Charlotte, North
• Fox River liability settled Carolina to enhance access to
• Completed capacity expansions in and paid $20.5 million as part resources and more diverse talent • Continue to pursue
Composite Fibers to serve Tea, of final settlement attractive growth
Coffee, and consumer growth markets • Recently announced acquisition investment
• New airlaid facility in Fort of Jacob Holm to add scale and opportunities as
• Oberschmitten acquisition expands Smith, AR expanded capacity best-in-class suite of nonwovens balance sheet permits
Electrical product line technologies, applications, and
by 20% products
13Appendix 14
Product Portfolio - Enhancing Everyday Life®
                                    ESSENTIAL – as you brew your favorite beverage and prepare nutritious meals for your family:
         FOOD &
         BEVERAGE
      Tea Bag; Single-serve
      Coffee; Food Pad                                                      Coffee solutions suitable for all    Safe, absorbent packaging for
                                         High-performance tea bag
                                         filters for superior infusion        common brewing devices                  meat, poultry & fish

                                     ESSENTIAL - for maintaining a healthy and active lifestyle even as we practice social distancing:
         PERSONAL
         CARE
      Feminine Hygiene; Adult
      Incontinence; Baby Wipes          Absorbent cores trusted by             Comfortable and discreet              Soft and strong cleaning
                                         hygiene industry leaders              adult consumer products              solutions for our little ones

                                     ESSENTIAL - for maintaining a clean and safe environment for your family:
         CONSUMER
         SOLUTIONS
      Floor & Home Care;
      Tabletop; Dispersible
                                 Disinfect hard surfaces,     Dust, absorb spills and scrub   Replace linens with disposable Protect laundry loads with
      Wipes                      keyboards, cell phones         hard to clean surfaces           napkins and table cloth       color-catching sheets

                 Over 85% of Glatfelter Revenue is tied to Essential Consumer Staples

15
Effective Tax Rate
• Q2 2021 tax rate on adjusted earnings is 33.2%
− Lower tax rate primarily due to changes in jurisdictional mix of pretax earnings
− Partially offset by UK tax rate increase
• Guiding to 2021 tax rate of ~ 38% - 40% on adjusted earnings
− 2021 Rate Drivers:
o Tax rate changes: Q1 local German rate change and Q2 UK rate change negatively
impacting full year rate by ~ 3%
o Currently generating losses in U.S. with no tax benefit due to U.S. valuation allowance
o U.S. tax on foreign earnings (Global Intangible Low Taxed Income – GILTI)
o Due to utilization of U.S. tax loss carry forwards, the 50% GILTI deduction and use of
foreign tax credits is not available
16Jacob Holm Financing and Tax Summary
• Glatfelter intends to finance the acquisition of Jacob Holm with the proceeds of a new $550
million senior unsecured bond issuance
− HSBC has underwritten 100% of a Senior Unsecured Bridge Facility backing the proposed bond issuance
− Glatfelter intends to apply excess proceeds from the bond offering to repay outstandings under the Revolving
Credit Facility (used to finance Mount Holly acquisition)
• Pro forma for the acquisition, Glatfelter’s net leverage is expected to increase to 4.0x, inclusive
of $20 million of synergies and $25 million of transaction costs
− GLT net leverage as of June 30, 2021 of 3.1x
• In connection with the transaction, Glatfelter is seeking to amend its existing credit facilities to,
among other items,
− Provide additional cushion under the financial maintenance covenant
− Extend the maturity of the Revolving Credit Facility to five years to ensure adequate long-term liquidity
• Effective tax rate guidance will remain unchanged for 2021
− Tax rate will initially increase by ~ 3% until U.S. tax losses are fully utilized within next two years
− Beginning in 2024 a tax rate benefit of ~3% is expected
− U.S. will remain in overall loss position with a full valuation allowance
• Decrease to global cash tax rate
− Cash tax rate will decrease by ~2% beginning in 2024
17Financial Overview
(in millions) Q2 2020 Q2 2021
Net Sales $216.2 $244.9
Adjusted operating income $17.0 $14.6
Adjusted EBITDA $29.0 $28.5
Free Cash Flow ($0.3) $1.6
Adjusted Free Cash Flow $12.1 $4.1
(in millions) Dec 31 2020 Jun 30 2021
Net Debt $213.9 $397.2
Cash $99.6 $84.2
18Earnings Trends
Net Sales Adjusted EBITDA Adjusted EPS
$939
$928 $916 $0.84
$866
$0.75 $0.74
$119.6
$117.6
$800
$106.7 $0.44
$86.6
$0.21
$80.0
2017 2018 2019 2020 TTM 2017 2018 2019 2020 TTM
6/30/2021
6/30/2021
Note: Results are from continuing operations with an assumed tax rate of 40% for 2017 (without the Specialty Papers business) ; Net sales and Adjusted EBITDA in millions
19Composite Fibers Operating Income
$’s in millions
$16.1
$15.3 $15.1 $15.0
$13.2 $13.0
$12.4
$11.9 $11.5
$11.3 $11.1 $11.1
$10.5
$8.2
$- $-
Q1 Q2 Q3 Q4 Q1 Q2 Q3 Q4 Q1 Q2 Q3 Q4 Q1 Q2 Q3 Q4
2018 2019 2020 2021
20Airlaid Materials Operating Income
$’s in millions
$12.9
$12.0 $12.3
$11.6
$10.4
$10.0
$9.7
$9.1 $9.1
$8.4
$7.6
$7.2 $7.2
$5.5
$- $-
Q1 Q2 Q3 Q4 Q1 Q2 Q3 Q4 Q1 Q2 Q3 Q4 Q1 Q2 Q3 Q4
2018 2019 2020 2021
21Reconciliation of Non-GAAP measures
Adjusted EBITDA and Adjusted Operating Income from continuing operations
In millions Q2 2020 Q2 2021 H1 2020 H1 2021
Net Income (loss) $ (2.4) $ 1.4 $ 5.0 $ 9.8
Adjust: Discontinued ops 0.1 0.1 0.1 0.1
Add: Taxes 2.6 4.0 5.2 11.2
(1)
Add: Depreciation and Amortization 14.2 14.7 29.6 28.5
Add: Net Interest Expense 1.7 1.8 3.2 3.3
EBITDA $ 16.1 $ 22.0 $ 43.1 $ 52.8
Adjustments / Exclusions:
Pension settlement expenses, net 6.3 - 6.4 -
Gains on Timberland Sales and Transaction Related Costs (0.6) (1.6) (0.6) (2.4)
Restructuring charge - Metallized operations (net of asset write-off) 3.7 - 7.2 -
COVID-19 incremental costs 1.2 - 1.2 -
Cost optimization actions 1.3 - 3.0 -
Asset impairment charge 0.9 - 0.9 -
Costs related to strategic initiatives - 7.8 - 8.4
Corporate headquarters relocation (net of asset write off) - 0.2 - 0.4
Adjusted EBITDA from continuing operations $ 29.0 $ 28.5 $ 61.2 $ 59.2
Depreciation and Amortization(2) (12.8) (14.7) (25.7) (28.5)
Other (Income)/Expense 0.8 0.8 1.5 1.1
Adjusted Operating Income from continuing operations $ 17.0 $ 14.6 $ 37.0 $ 31.8
(1) – 2020 includes accelerated depreciation incurred in connection with restructuring of Composite Fibers’ Metallized operations of $2.5 million, not included in adjusted operating income (2)
Note: The sum of individual amounts set forth above may not agree to the column totals due to rounding.
22Reconciliation of Non-GAAP measures
Adjusted EBITDA from continuing operations
TTM
In millions 2017 2018 2019 2020
6/30/2021
Net Income (loss) $ 7.9 $ (177.6) $ (21.5) $ 21.3 $ 26.1
Adjust: Discontinued ops (13.5) 177.2 (3.7) (0.5) (0.6)
Add: Taxes from continuing operations 25.1 7.7 (9.2) 11.6 17.6
Add: Depreciation and Amortization 42.1 47.5 50.8 56.6 55.5
Add: Net Interest Expense 13.1 15.0 9.3 6.6 6.7
EBITDA from continuing operations $ 74.6 $ 69.8 $ 25.7 $ 95.6 $ 105.3
Adjustments / Exclusions:
Pension settlement expenses, net - - 75.3 6.2 (0.2)
Gains on Timberland Sales and Transaction Related Costs (0.2) (3.2) (1.6) (1.4) (3.2)
Asset impairment charge - - - 0.9 -
Airlaid Capacity Expansion 10.9 7.1 1.0 - -
Restructuring charge - Metallized operations (net of asset write off) - - - 7.2 0.1
Cost optimization actions 1.3 0.4 8.6 6.0 2.9
COVID-19 incremental costs - - - 2.7 1.5
Corporate headquarters relocation (net of asset write off) - - - 0.9 1.2
Costs related to strategic initiatives (1) - 5.9 0.2 1.6 10.0
Fox River environmental matter - - (2.5) - -
Adjusted EBITDA from continuing operations $ 86.6 $ 80.0 $ 106.7 $ 119.6 $ 117.6
(1) The amount for 2018 includes approximately $2.9 million of foreign currency gains associated with the financing for the Steinfurt acquisition.
Note: The sum of individual amounts set forth above may not agree to the column totals due to rounding.
23Reconciliation of Non-GAAP measures
Adjusted EBITDA used for leverage calculation
TTM
In millions 2019 2020
6/30/2021
Net Income (loss) $ (21.5) $ 21.3 $ 26.1
Adjust: Discontinued ops (3.7) (0.5) (0.6)
Add: Taxes from continuing operations (9.2) 11.6 17.6
Add: Depreciation and Amortization 50.8 56.6 55.5
Add: Net Interest Expense 9.3 6.6 6.7
EBITDA $ 25.7 $ 95.6 $ 105.3
EBITDA from Mount Holly Operations - - 10.4
Adjustments / Exclusions:
Gains on Timberland Sales and Transaction Related Costs (1.6) (1.4) (3.2)
Asset impairment charge - 0.9 -
Pension settlement expenses, net 75.3 6.2 (0.2)
Airlaid Capacity Expansion 1.0 - -
Restructuring charge - Metallized operations (net of asset write off) - 7.2 0.1
Cost optimization actions 8.6 6.0 2.9
COVID-19 incremental costs - 2.7 1.5
Corporate headquarters relocation (net of asset write off) - 0.9 1.2
Costs related to strategic initiatives 0.2 1.6 10.0
Fox River environmental matter (2.5) - -
Adjusted EBITDA $ 106.7 $ 119.6 $ 128.0 (*)
(*) For leverage calculation the June 30,2021 column includes a full year of Mt. Holly financials for TTM EBITDA calculation
24Reconciliation of Non-GAAP measures
Adjusted EPS from continuing operations
TTM
In millions 2017 2018 2019 2020
6/30/2021
Net Income (loss) $ 7.9 $ (177.6) $ (21.5) $ 21.3 $ 26.1
Adjust: Discontinued ops, net of tax (13.5) 177.2 (3.7) (0.5) (0.6)
Income (loss) from continuing operations (5.6) (0.4) (25.2) 20.8 25.5
Adjustments / Exclusions:
Pension settlement expenses, net - - 75.3 6.2 (0.2)
Gains on Timberland Sales and Transaction Related Costs (0.2) (3.2) (1.6) (1.4) (3.2)
Asset impairment charge - - - 0.9 -
Airlaid Capacity Expansion 10.9 7.1 1.0 - -
COVID-19 incremental costs - - - 2.7 1.5
Debt refinancing fees - - 1.0 - -
Cost optimization actions 2.6 0.4 8.6 6.0 2.9
Restructuring charge - Metallized operations - - - 11.1 -
(1)
Costs related to strategic initiatives - 5.9 0.2 1.6 10.0
Fox River environmental matter - - (2.5) - -
Corporate headquarters relocation - - - 1.1 1.5
Income Tax impact on adjustments 18.8 (0.5) (23.7) (11.5) (4.8)
Total adjustments 32.0 9.6 58.4 16.6 7.6
Adjusted income from continuing operations 26.4 9.2 33.2 37.4 33.2
Normalizing tax rate to 40% provision (2017) 6.8 - - - -
Adjusted earnings for continuing operations $ 19.6 $ 9.2 $ 33.2 $ 37.4 $ 33.2
Adjusted EPS for continuing operations $ 0.44 $ 0.21 $ 0.75 $ 0.84 $ 0.74
Weighted average shares 44,439 43,768 44,132 44,614 44,640
(1) The amount for 2018 includes approximately $2.9 million of foreign currency gains associated with the financing for the Steinfurt acquisition.
Note: The sum of individual amounts set forth above may not agree to the column totals due to rounding.
25Reconciliation of Non-GAAP measures
Adjusted EPS from continuing operations
In millions Q2 2020 Q2 2021
Net Income (loss) $ (2.4) $ 1.4
Adjust: Discontinued ops, net of tax 0.1 0.1
Net Income (loss) from continuing operations (2.3) 1.5
Adjustments / Exclusions:
Pension settlement expenses, net 6.3 -
Gains on Timberland Sales and Transaction Related Costs (0.6) (1.6)
Asset impairment charge 0.9 -
COVID-19 incremental costs 1.2 -
Corporate headquarters relocation - 0.2
Cost optimization actions 1.3 -
Restructuring charge - Metallized operations 5.1 -
Costs related to strategic initiatives - 7.8
(*) (2.0) -
Income Tax impact on adjustments
Total adjustments 12.2 6.5
Adjusted income from continuing operations $ 9.9 $ 8.0
Adjusted EPS for continuing operations $ 0.22 $ 0.18
Weighted average shares - QTD 44,343 44,872
(*) Income tax adjustments for Q2 2021 includes $0.1 million expense for CARES Act of 2020
Note: The sum of individual amounts set forth above may not agree to the column totals due to rounding.
26Reconciliation of Non-GAAP measures
Adjusted Free Cash Flow from Continuing Operations
In millions Q2'20 Q2'21 H1'20 H1'21
Adjusted EBITDA (1) $29.0 $28.5 $61.2 $59.2
Change in working capital (16.6) (10.2) (39.1) (37.9)
Taxes paid (1.2) (3.6) (4.7) (7.1)
Interest paid (1.7) (1.5) (3.2) (2.9)
Other (4.7) (5.7) (15.2) (9.9)
Cash Flow from continuing Operations $4.7 $7.4 ($0.9) $1.4
Less: Capital expenditures (5.0) (5.8) (12.0) (11.2)
Free Cash Flow ($0.3) $1.6 ($12.9) ($9.8)
Fox River Payments 2.1 0.5 2.2 0.8
Pension Settlement 6.3 - 6.3 -
Strategic Initiatives - 0.8 - 1.6
Cost Optimization 0.4 0.5 2.3 1.6
Metallized Restructuring 4.3 0.1 4.3 1.3
HQ Relocation 0.1 0.5 0.1 0.8
COVID19 related costs 1.2 - 1.2 -
Taxes (Refunds) on adjusting items (1.9) 0.1 (1.8) (1.0)
Less: Adjustments to Free Cash Flow 12.4 2.6 14.5 5.0
Adjusted Free Cash Flow $12.1 $4.1 $1.6 ($4.8)
(1) – Reconciliations for adjusted EBITDA to net income not included in this presentation, are included in prior quarter earnings presentations
Note: The sum of individual amounts set forth above may not agree to the column totals due to rounding
27Reconciliation of Non-GAAP measures
Adjusted EBITDA from continuing operations
In thousands Q2 2020 Q1 2021 Q2 2021
Composite Fibers Operating Profit $11,487 $16,065 $11,063
Addback: Depreciation & Amortization 6,431 6,981 7,000
Composite Fibers EBITDA $17,919 $23,047 $18,062
Airlaid Materials Operating Profit $12,292 $7,197 $8,431
Addback: Depreciation & Amortization 5,473 5,848 6,767
Airlaid Materials EBITDA $17,765 $13,046 $15,197
Note: The sum of individual amounts set forth above may not agree to the column totals due to rounding.
28Reconciliation of Non-GAAP measures
Net Debt and Leverage
Net debt & Leverage December 31 December 31 June 30
In millions 2019 2020 2021
Current Portion of Long-Term Debt $22.9 $25.1 $24.3
Short-Term Debt - - 11.7
Long-Term Debt 336.9 288.5 445.4
Total Debt 359.9 313.5 481.4
Less: Cash (126.2) (99.6) (84.2)
Net Debt $233.7 $213.9 $397.2
Net Debt $233.7 $213.9 $397.2
Divided by: TTM Adjusted EBITDA 106.7 119.6 128.0
Net Leverage (*) 2.2x 1.8x 3.1x
Notes:
(*) For leverage calculation the June 30,2021 column includes a full year of Mt. Holly financials for TTM EBITDA calculation
The above calculation is not intended to be used for purposes of calculating debt covenant compliance.
The sum of individual amounts set forth above may not agree to the column totals due to rounding.
29You can also read


