Investor Presentation - August 2021 - As of August 4, 2021
←
→
Page content transcription
If your browser does not render page correctly, please read the page content below
Investor Presentation
August 2021

Ternium
As      I August 2021
    of August      4, 2021   1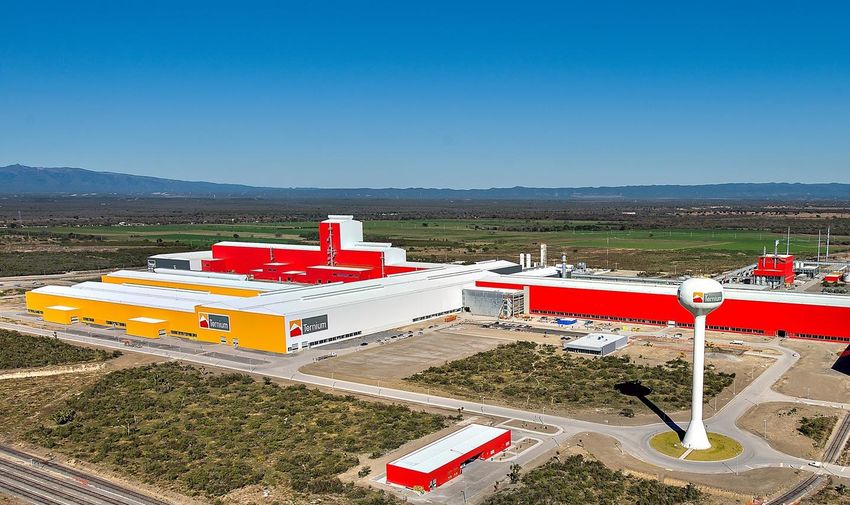
Forward-Looking Statements

This presentation contains certain forward-looking statements and information relating to Ternium S.A. and its
subsidiaries (collectively, “Ternium”) that are based on the current beliefs of its management as well as assumptions
made by and information currently available to Ternium. Such statements reflect the current views of Ternium with
respect to future events and are subject to certain risks, uncertainties and assumptions. Many factors could cause the
actual results, performance or achievements of Ternium to be materially different from any future results, performance or
achievements that may be expressed or implied by such forward-looking statements, including, among others, changes in
general economic, political conditions in the countries in which Ternium does business or other countries which have an
impact on Ternium’s business activities and investments, changes in interest rates, changes in inflation rates, changes in
exchange rates, the degree of growth and the number of consumers in the markets in which Ternium operates and sells
its products, changes in steel demand and prices, changes in raw material and energy prices or difficulties in acquiring
raw materials or energy supply cut-offs, changes in business strategy and various other factors. Should one or more of
these risks or uncertainties materialize, or should underlying assumptions prove incorrect, actual results may vary
materially from those described herein as anticipated, believed, estimated, expected or targeted. Ternium does not
intend, and does not assume any obligation, to update these forward-looking statements.

Ternium I August 2021
                                                                                                                             2
Profile

Ternium I August 2021
                        3
Ternium’s Profile
A leading steel company in Latin America
20,000
Net sales of $8.7 billion in 2020 Countries Employees
Steel shipments in 2020 of 11.4 million tons
Industrial facilities in Mexico, Argentina, Brazil, 24
Integrated
Distribution
Colombia, USA and Central America Integrated
Facilities
Centers
Facilities
Steel Shipments 2020 22 12
Service Downstream
Centers Facilities
Other; 5% (Slabs 4%)
Mexico; 52% Colombia; 4%
Vertically integrated, from iron ore mines to
USA; 14% (Slabs 9%) service centers
Other Markets 31%
Focus on high value-added products
Brazil; 8% (Slabs 8%)
Participation in Usiminas1 control group
Southern Region; 17%
1Usiminas: a leading company in the Brazilian flat steel market
Ternium I August 2021
4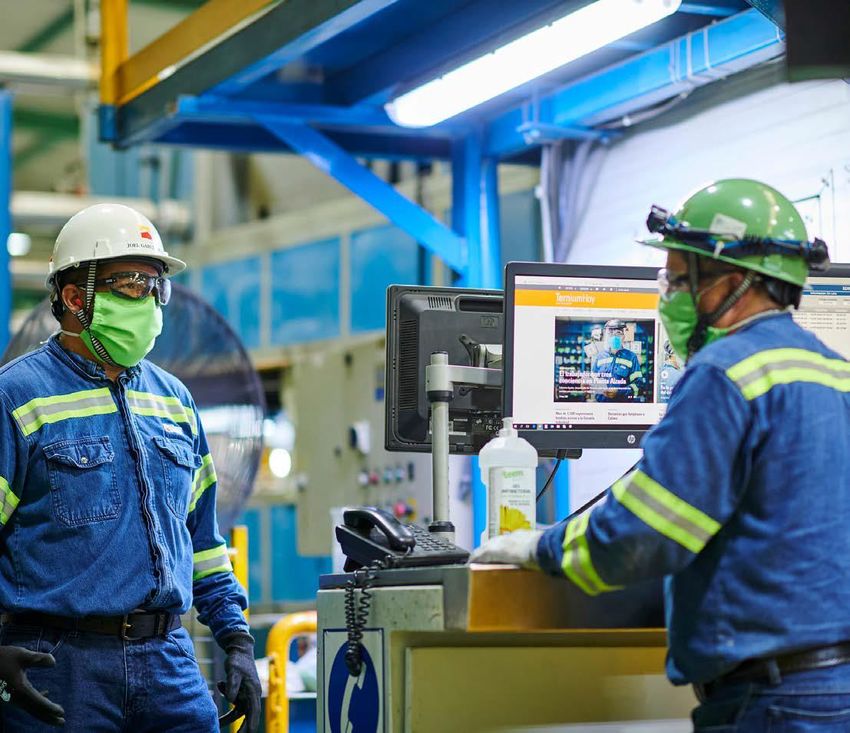
Sustainable Profitability
A comprehensive approach to value creation
Quest for excellence in industrial management Economic Value Generated and Distributed1 (2020)
and technology
Focus on differentiation through sophisticated Suppliers
$6.4 B
products and services
Community
Employees
investments
Proactive approach to environment, health and $11.1 M
$739 M
safety
Economic
Recruitment, training, and retention of talent value
generated
Research &
Strengthening of steel value chain development
$8.9 B Capex
$8.3 M $560 M
Deep ties with our communities
Commitment to integrity
Capital
Taxes
providers
$436 M
$47 M
1 According to GRI Standards
Ternium I August 2021
5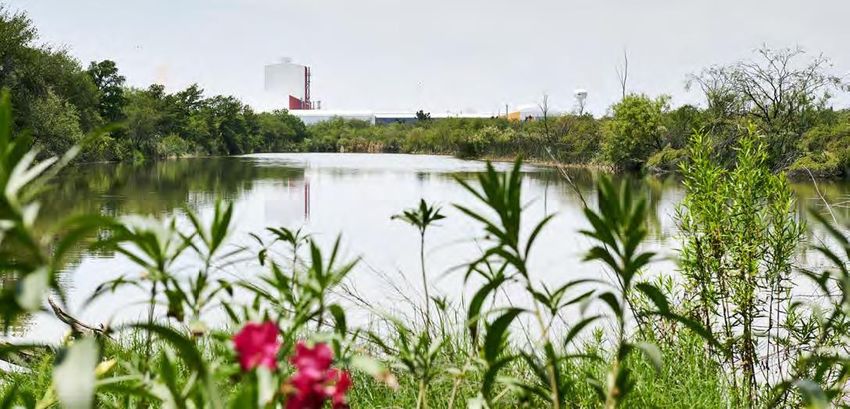
Sustainable Profitability
Delivering Ternium’s business strategy
Focus on high-margin value-added products Dividend Payments ($ per ADS)
2.10
Pursue strategic growth opportunities
Implement Ternium’s best practices 1.10 1.20
1.00
Maximize the benefits arising from Ternium’s
distribution network -
Enhance Ternium’s position as a competitive steel 2017 2018 2019 2020 2021
producer
Net Debt ($ billion)
Quest for excellence in industrial management and 2.7
technology
1.7
1.5
0.9
0.4
0.6x 1.4x 0.6x 1.0x 0.2x1
Dec-16 Dec-17 Dec-18 Dec-19 Dec-20
1 Net Debt/EBITDA Ratio (last 12 months EBITDA)
Ternium I August 2021
6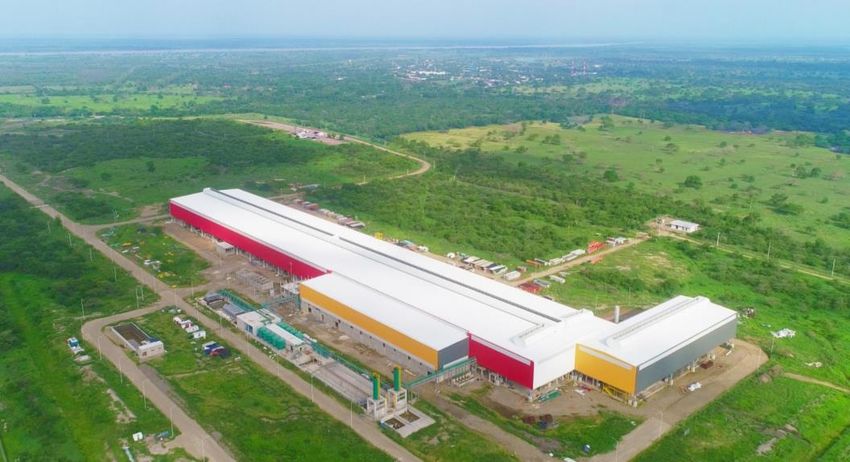
Sustainable Profitability
Improving our health and safety performance
Occupational health and safety (OH&S) policy Lost time injury frequency rate
(# of events / million hours worked)
Standardized and certified OH&S management
system
Safety-focused capital expenditure plan 1.0
0.8 0.8
0.7 0.7
Integral program for critical steel production
processes and iron ore tailings dams 2016 2017 2018 2019 2020
Management tours at the facilities, training,
workshops and conferences to raise awareness
Extensive communication to engage and commit
Ternium's and contractor's employees
Initiatives to promote healthy and safe operations in
the steel industry value chain
Ternium I August 2021
7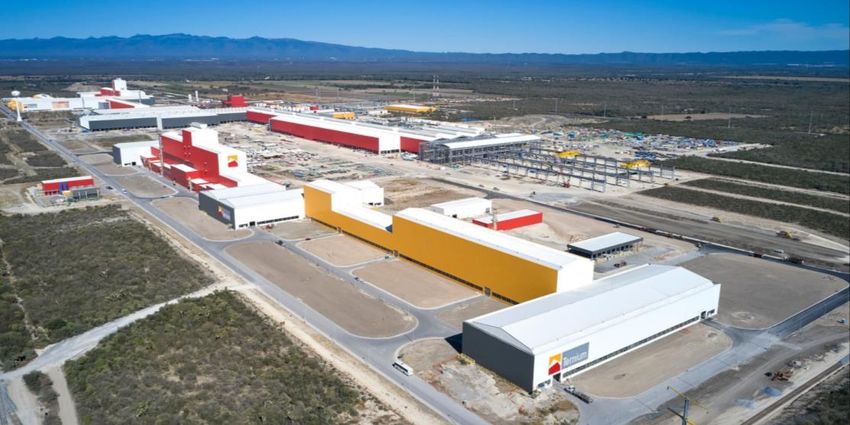
Sustainable Profitability
Health and safety measures against Covid-19
Working protocols that comply with, or exceed, local authorities’
directives
strict social distancing and mandatory face masks
temperature checks at admission posts
strengthened disinfection routines including buses, working
posts and cafeterias
Remote working where possible
Employees with higher risk of developing complications stay at home
Prompt testing of all individuals showing symptoms along with their
close contacts and contagion tracking
Extensive communication program to promote health and wellness
protocols at both work and home
Ternium I August 2021
8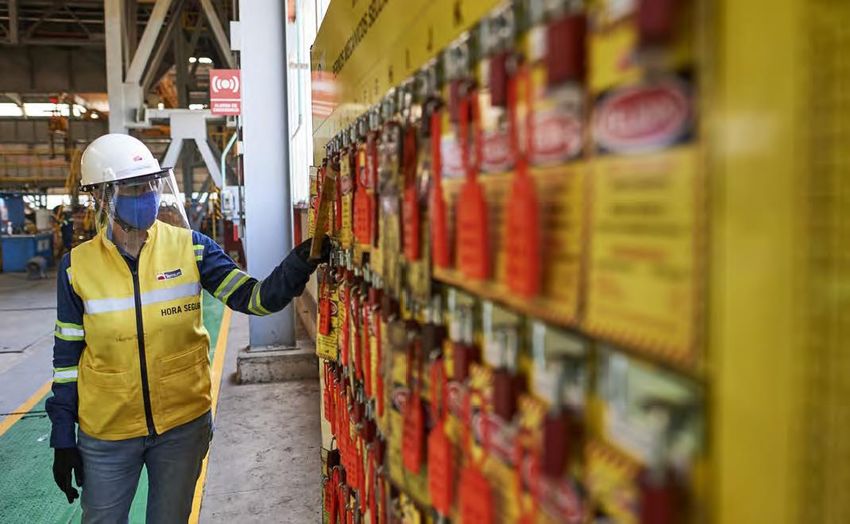
Sustainable Profitability
Roadmap to decarbonization
Emission Intensity (Scopes 1 & 2)
Target of 20% reduction of CO2 emissions intensity (tons of CO2 emitted per ton of crude steel produced)
1.68 1.69 1.73 1.68
(scope 1 and 2) by 2030 (base 2018) by:
1.40
intensifying the use of renewable energy
increasing scrap in the metallic mix
augmenting carbon capture capacity
partially replacing met coal with charcoal 2016 2017 2018 2019 2020
prioritizing lower specific-emission technologies Scope 1 Scope 2
Analysis of additional strategies to decarbonize its
operations over the longer term, based upon:
current and developing technologies
availability of renewable energy and steel scrap
Board of Directors quarterly oversight of Ternium’s
Climate Change strategy
Ternium I August 2021
9
Sustainable Profitability
Minimizing Ternium’s environmental footprint
New environmental investment plan:
encompassing Ternium’s steelmaking facilities
in Mexico, Brazil and Argentina
seven-year duration and $460 million capex
Responsible use of natural resources
Focus on excellence in environmental performance
Reintroduction of endangered species, such as the yaguareté, in Esteros del Iberá
Certified environmental management system
Management performance accountability
Sustainable building solutions at new facilities
Biodiversity protection
New environmental monitoring center at Ternium’s Rio de Janeiro unit in Brazil
Ternium I August 2021
10Sustainable Profitability
Strengthening Ternium's value chain
Promoting a collaborative network to foster
excellence in performance:
Universities
Business schools
Government agencies
Industrial associations
Helping 1,800 SMEs, customers and suppliers, grow:
Training programs “ProPymes has helped create an industrial network
that encourages the professionalization and quest
Industrial projects and business consultancy for excellence of SMEs.”
Institutional initiatives
Commercial support and financial assistance
Ternium I August 2021
11Sustainable Profitability
Helping our communities thrive
Fostering education:
Ternium’s technical school in Pesquería
Refurbishing of community schools
Special education program for children
Financial support to high-school, undergraduate
and graduate students
Supporting initiatives that strengthen our communities: Roberto Rocca Technical School in Pesquería, Mexico
Funding of health care infrastructure and equipment
Sponsorship of diverse cultural exhibitions and
events
Sponsorship of city races and other sport activities
Special funding program of $6.4 million to help our
communities face the COVID-19 pandemic
New robotic and automation laboratories at a technical school in San Nicolás,
Ternium I August 2021 Argentina 12Sustainable Profitability
Special funding program to help our communities
Construction and operation of a field hospital in Monterrey, Mexico
100 beds
10 fully-equipped units for intensive care (IC)
Equipment donation to 14 hospitals and health-care units in 4 countries
(ventilators, units for IC, beds, IC equipment and protection gear)
Creation of a professional network to share COVID-19 treatments
Linking doctors from our communities with Humanitas’1 colleagues
Humanitas expertise available at a public virtual campus
Adaptation to online learning at some of Ternium’s education programs
Roberto Rocca Technical School
AfterSchool program
Food support for vulnerable families
1 Humanitas: an Italian network of hospitals controlled by the Techint Group
Ternium I August 2021
13Sustainable Profitability
Commitment to integrity through strong corporate governance
Audit committee (all independent directors)
Internal Audit Department reporting to the
Chairman and the Audit Committee
Business Conduct Compliance Officer reporting
to the CEO
Compliance department that oversees SOX
certifications, related party transactions and
conflict minerals
Employee accountability and training to ensure a
transparent behavior
Confidential channels to report non-compliant
behavior
Ternium I August 2021
14Latin American Steel Markets
Ternium I August 2021
15Latin America Steel Markets
Ternium has a leading position in the Mexican steel market
The Mexican market is the largest in Latin America
Growth in Mexico’s steel consumption over the last decades was driven mainly by a dynamic
manufacturing industry
Mexico, Brazil, Argentina and Colombia accounted for approximately 80% of Latin America’s steel
consumption in 2020
Apparent steel use (million tons)
Brasil Argentina
Mexico Colombia
21.7
21.2 3.6
2.7 2.9
9.7
6.6 1.1
1990 2000 2010 2020 1990 2000 2010 2020
Source: Alacero April 2021
Ternium I August 2021
16Mexico
Attractive steel market with a significant demand for high-end steel products
Developed industrial sector (approximately 49% of
shipments in Mexico)
Access to the North American steel market through Steel shipments by industry (2020)
USMCA
Ternium’s focus on value added products and services: Automotive; 23%
Service center network Other industries 9%
Nationwide coverage through distribution centers
and regional distributors White goods; 8%
Customer digital connectivity
New capabilities to provide sophisticated steel HVAC / lighting; 9%
products for industrial customers Commercial; 51%
Ternium I August 2021
17Mexico
Start-up of the new hot-rolling mill in Pesquería in May 2021
Significant technological upgrade to expand TX’s Apparent flat steel use – Mexico 2020
product range and improved customer service Industrial Commercial Local Imports
The new mill will further increase Ternium’s
63%
56%
capabilities to substitute imports, which in 2020
44%
accounted for 56% of Mexico’s flat steel use 37%
Targeting the automotive industry, as well as the 0
white goods, machinery, energy and construction
sectors
Annual production capacity of 4.4 million tons (option
to increase capacity to 4.8 million tons) 36%
Source: Canacero / Ternium estimates
Ternium I August 2021
18Mexico
Developing our industrial center in Pesquería
Greenfield facility inaugurated in 2013 with cold-rolling and galvanizing lines
Additional hot-dipped galvanizing and painting lines commissioned in 2019 with the most advanced painting
technology in Mexico
Start-up of the new hot-rolling mill in May 2021
High-end value-added products for the automotive, white goods and heating-ventilation-air conditioning
(HVAC) industries
Annual production capacity:
Hot-Rolling: 4.4 million tons
Cold-rolling: 1.6 million tons
Hot-dipped galvanizing: 830,000 tons 36%
Painting: 120,000 tons
Ternium I August 2021
19Argentina
Third largest steel market in Latin America with a developed industrial sector
Significant industrial sector representing 46% of steel
shipments in Argentina
Steel shipments by industry (2020)
Focus on value added products and services:
Service center network
Commercial 54%
Short notice delivery and just-in-time agreements Automotive 7%
Customer digital connectivity Agribusiness 9%
Joint product research and development projects White goods 6%
with our value chain (mainly white goods, Canning 8%
transportation and renewable energy) Oil & gas 1%
Other industrial 15%
Ternium I August 2021
20Colombia
New rebar mill in Colombia inaugurated in November 2020
Colombian steel market is the fourth largest in Latin America
Imports account for a significant share of long steel consumption
Ternium expanded its participation in the construction sector in the north/northwest of Colombia
Approximately 50% of steel rebar consumption
No local production
Expensive logistics from the mills in central Colombia
New greenfield rebar facility
Annual capacity of 520,000 tons
Total investment of $90 million
Started up in November 2020
Ternium I August 2021
21Ternium’s Performance
Ternium I August 2021
22Ternium’s Performance
EBITDA and Net Income
EBITDA ($ million) 1,420 EBITDA Margin (% of net sales)
36%
1,057 33%
25%
645
17%
13%
353
224
2Q20 3Q20 4Q20 1Q21 2Q21 2Q20 3Q20 4Q20 1Q21 2Q21
EBITDA per Ton1 ($) Net Income and Earnings per ADS
Net Income ($ million)
463 Earnings per ADS 5.21
1,180
1,130
341 1,080
1,030
980
930
880
830 3.06 3.07
210 780
730
680
630
124 580
530 1,158
91 480
430
380
330 0.74 671 707
280
230 0.22
180
130
80 173
30
-20
44
2Q20 3Q20 4Q20 1Q21 2Q21
1 Consolidated EBITDA divided by steel shipments. 2Q20 3Q20 4Q20 1Q21 2Q21
Ternium I August 2021
23Ternium’s Performance
Steel Shipments
Mexico (thousand tons) Other Markets (thousand tons)
1,643 1,699 2% 1,735 Slabs
1,445
1,175
931 853 771 778 -10%
697
664 519 499 466 385
2Q20 3Q20 4Q20 1Q21 2Q21 2Q20 3Q20 4Q20 1Q21 2Q21
Southern Region (thousand tons) Steel Shipments 2Q21
Mexico 57% Other 1%
Colombia 5%
653 623 2% 636
547 USA 6% (2% slabs)
344
Other Markets
22%
Brazil 10% (slabs)
2Q20 3Q20 4Q20 1Q21 2Q21
Southern
Region 21%
Ternium I August 2021
24Ternium’s Performance
Total Shipments and Revenue per Ton
Total Shipments (thousand tons) Revenue per Ton ($/ton)
Mexico 1,309 +23%
Southern Region 1,276 +17%
3,067 3,099 -1% 3,068 Consolidated 1,093 1,253 +22%
2,845 1,066
2,449
1026
852
725
690
2Q20 3Q20 4Q20 1Q21 2Q21 2Q20 3Q20 4Q20 1Q21 2Q21
Net Sales ($ million)
3,920
21% Net sales in the 2Q21 up 21% sequentially on higher steel
3,249 prices and relatively stable shipments.
2,580
Realized steel prices expected to continue increasing in all
2,139
1,746 regions in the 3Q21.
Strong demand for steel products in Ternium’s main steel
markets.
Ternium’s new hot-rolling mill to enable to increase market
2Q20 3Q20 4Q20 1Q21 2Q21 offering by approximately 600,000 tons in 2H 2021.
Ternium I August 2021
25Ternium’s Performance
Cash Flow and Balance Sheet
Cash from Operations ($ million) Changes in Working Capital ($ million)
628 306
141
504
460
355 328
(275)
(666) (652)
2Q20 3Q20 4Q20 1Q21 2Q21 2Q20 3Q20 4Q20 1Q21 2Q21
Free Cash Flow ($ million) Net Debt ($ billion)
467 0.9
393 389
0.6
234 0.4
198
0.2 0.2
0.8x 0.5x 0.2x 0.1x 0.1x1
2Q20 3Q20 4Q20 1Q21 2Q21 jun-20 sep-20 dic-20 mar-21 jun-21
1 Net Debt/EBITDA Ratio (last 12 months EBITDA)
Ternium I August 2021
26Conclusion
Ternium I August 2021
27Conclusion
A leading steel company in Latin America with a
comprehensive management approach
Successful implementation of business strategy geared
toward sustainable profitable growth
Solid financial position
Resilience in times of crisis
New hot-rolling mill in Mexico provides opportunity to
strengthen business in the region
Continued focus on generating long-term stakeholder value
Ternium I August 2021
28Ternium I August 2021
29Appendix
Corporate Structure
Production Capacity
Shipments and Net Sales
Income Statement
Cash Flow Statement
Balance Sheet
Selected Webcast Presentation Slides Second Quarter and First Half of 2021
Ternium’s Debt Profile
More about Ternium’s developing industrial system in Brasil
Ternium I August 2021
30Corporate Structure
Techint Group: 62%
Tenaris: 11%
Ternium (treasury shares): 2%
Subsidiaries Joint operations Non-consolidated companies
Public: 24%
71% 100% 50%
Ternium México
29% Las Encinas Peña Colorada
62% 38% Other
Ternium Argentina3 50%
4% Nippon Steel Corp: 19% ArcelorMittal
17% TenarisConfab: 3%
Usiminas
CEU: 3% Economic participation
100%
Ternium Brasil4 Other: 55%
Direct Indirect
2
Total
51% 49% Ternium Mexico 71% 18% 89%
Tenigal Nippon Steel Corp 3
Ternium Argentina 62% 62%
100% Ternium Brasil4 100% 100%
Ternium Colombia 1
Usiminas 17% 2% 19%
100% Ternium del Atlántico Tenigal 51% 51%
Ternium Colombia 100% 100%
100% Ternium USA TX Int. Guatemala 100% 100%
TX USA 100% 100%
100%
Ternium Int. Guatemala Las Encinas 71% 18% 89%
Peña Colorada 36% 9% 44%
48% 30% Tecpetrol 1 Participation based on total shares distributed
Techgen
2
22% Net of non-controlling interest in TX Argentina
50% 3 Formerly known as Siderar
Exiros 50% Tenaris 4 Formerly known as CSA
Ternium I August 2021
31Production Capacity
Production Capacity as of year-end 2020 (million metric tons per year)
(1)
Mexico Argentina Other Total
Slabs 2.5 3.2 5.0 (2) 10.7
Billets 1.6 0.2 1.8
Crude steel 4.1 3.2 5.2 12.4
Hot rolled coils 6.5 2.9 9.4
Rebars & wire rods 1.2 0.7 1.9
Cold rolled coils 3.7 1.8 5.5
Tinplated products 0.2 0.2
Galvanized products 2.4 0.6 0.4 3.4
Pre-painted products 0.8 0.1 0.2 1.1
Service center 3.9 2.3 1.3 7.5
(1)Brazil, Southern US, Colombia and Central America
(2)Corresponds to Ternium Brasil
Ternium I August 2021
32Shipments and Net Sales
Net Sales (USD million) Shipments (thousand tons) Revenue / ton (USD / ton)
3
2Q2021 2Q2020 Dif. 2Q2021 2Q2020 Dif. 2Q2021 2Q2020 Dif.
Q
Mexico 2,271.9 851.5 167% 1,735 1,175 48% 1,309 725 81%
Southern Region 811.5 292.8 177% 636 344 85% 1,276 852 50%
Other Markets 761.3 546.4 39% 697 931 -25% 1,093 587 86%
Total steel products 3,844.7 1,690.7 127% 3,068 2,449 25% 1,253 690 82%
Other products1 65.0 42.5 53%
Total steel segment 3,909.7 1,733.2 126%
Total mining segment 112.5 98.7 14% 906 991 -9% 124 100 25%
Total steel and mining segments 4,022.2 1,831.9 120%
Intersegment eliminations (102.4) (86.1)
Total net sales 3,919.8 1,745.8 125%
Net Sales (USD million) Shipments (thousand tons) Revenue / ton (USD / ton)
3
1H2021 1H2020 Dif. 1H2021 1H2020 Dif. 1H2021 1H2020 Dif.
Q
Mexico 4,082.7 2,120.4 93% 3,434 2,824 22% 1,189 751 58%
Southern Region 1,492.3 633.6 136% 1,259 723 74% 1,186 876 35%
Other Markets 1,449.0 1,146.6 26% 1,475 1,900 -22% 983 604 63%
Total steel products 7,024.0 3,900.6 80% 6,167 5,447 13% 1,139 716 59%
Other products1 124.7 86.7 44%
Total steel segment 7,148.7 3,987.3 79%
Total mining segment 235.8 193.5 22% 1,940 1,985 -2% 122 98 25%
Total steel and mining segments 7,384.6 4,180.8 77%
Intersegment eliminations (215.5) (163.7)
Total net sales 7,169.1 4,017.1 78%
1
The item “Other products” primarily includes Ternium Brasil’s and Ternium México’s electricity sales.
Ternium I August 2021
33Income Statement
$ million 2Q2021 2Q2020 1H2021 1H2020
(Unaudited) (Unaudited)
Net sales 3,919.8 1,745.8 7,169.1 4,017.1
Cost of sales (2,415.7) (1,508.8) (4,553.9) (3,429.3)
Gross profit 1,504.1 237.0 2,615.1 587.8
Selling, general and administrative expenses (244.5) (171.5) (454.9) (383.0)
Other operating income (expenses), net 11.9 0.1 17.0 (3.5)
Operating income 1,271.4 65.6 2,177.2 201.3
Finance expense (6.8) (13.6) (14.0) (29.9)
Finance income 18.5 7.0 34.8 15.0
Other financial income (expenses) income, net 11.2 (8.1) 18.1 106.4
Equity in earnings (losses) of non-consolidated companies 171.1 (19.7) 217.6 (13.6)
Profit before income tax expense 1,465.4 31.3 2,433.6 279.2
Income tax (expense) income (307.1) 12.3 (568.7) (255.0)
Profit for the period 1,158.3 43.6 1,864.9 24.2
Attributable to:
Owners of the parent 1,022.1 44.0 1,625.0 32.5
Non-controlling interest 136.2 (0.5) 239.9 (8.2)
Profit for the period 1,158.3 43.6 1,864.9 24.2
Ternium I August 2021
34Cash Flow Statement
$ million 2Q 2021 2Q2020 1H2021 1H2020
(Unaudited) (Unaudited)
Profit for the period 1,158.3 43.6 1,864.9 24.2
Adjustments for:
Depreciation and amortization 148.8 158.3 300.4 324.7
Equity in (earnings) losses of non-consolidated companies (171.1) 19.7 (217.6) 13.6
Changes in provisions 1.6 0.3 6.0 (0.3)
Net foreign exchange results and others 59.0 17.7 120.9 (86.8)
Interest accruals less payments 0.4 2.4 2.1 3.7
Income tax accruals less payments 83.2 (44.2) 197.5 179.8
Changes in working capital (651.8) 305.8 (1,318.0) 487.6
Net cash provided by operating activities 628.4 503.7 956.2 946.4
Capital expenditures (161.4) (110.8) (291.1) (368.4)
Proceeds from the sale of property, plant and equipment 0.5 0.1 1.0 0.2
Acquisition of non-controlling interest - (6.8) (0.8) (11.3)
Dividends received from non-consolidated companies 0.5 - 0.5 -
Decrease (increase) in Other Investments 24.0 (591.9) 173.3 (494.8)
Net cash used in investing activities (136.5) (709.5) (117.0) (874.4)
Dividends paid in cash to company's shareholders (412.2) - (412.2) -
Finance Lease Payments (11.5) (9.8) (22.4) (20.4)
Proceeds from borrowings 113.9 28.9 132.0 219.5
Repayments of borrowings (242.5) (258.1) (279.1) (318.8)
Net cash used in financing activities (552.3) (239.1) (581.8) (119.7)
(Decrease) increase in cash and cash equivalents (60.3) (444.9) 257.4 (47.6)
Ternium I August 2021
35Balance Sheet
June 30, December 31, June 30, December 31,
$ million $ million
2021 2020 2021 2020
(Unaudited) Capital and reserves attributable to the owners of the parent 8,549.5 7,286.1
Property, plant and equipment, net 6,494.3 6,504.7 Non-controlling interest 1,398.2 1,157.0
Intangible assets, net 895.9 908.6 Total Equity 9,947.8 8,443.2
Investments in non-consolidated companies 715.9 471.3
Deferred tax assets 140.5 158.7 Provisions 90.7 80.6
Receivables, net 192.3 243.3 Deferred tax liabilities 237.9 346.5
Other investments 3.0 2.9 Other liabilities 518.6 551.9
Total non-current assets 8,441.9 8,289.5 Trade payables 1.2 1.1
Derivative financial instruments 0.3 0.5
Receivables, net 316.2 288.6
Lease liabilities 235.9 251.6
Derivative financial instruments 3.3 1.6
Borrowings 972.6 1,327.3
Inventories, net 2,945.2 2,001.8
Total non-current liabilities 2,057.3 2,559.5
Trade receivables, net 1,754.2 918.4
Current income tax liabilities 415.5 110.5
Other investments 616.0 813.5
Other liabilities 381.1 249.8
Cash and cash equivalents 768.7 537.9
Trade payables 1,404.1 1,049.3
Total current assets 6,403.6 4,561.8
Derivative financial instruments 1.3 5.8
Non-current assets classified as held for sale 5.0 5.0 Lease liabilities 43.6 42.5
Borrowings 599.9 395.6
Total assets 14,850.6 12,856.2
Total current liabilities 2,845.5 1,853.6
Total liabilities 4,902.8 4,413.1
Total equity and liabilities 14,850.6 12,856.2
Ternium I August 2021
36Second Quarter of 2021 Results- Webcast Presentation
EBITDA and Net Results
698
Higher revenue per ton in the 2Q21, reflecting a (285) (37)
strong steel pricing environment.
(million $)
(13)
Increase in cost per ton, mainly reflecting higher 1,420
raw material, purchased slab and maintenance 1,057
expenses.
EBITDA
EBITDA Shipments Price/Mix Cost Other EBITDA
EBITDA
1Q21
1Q21 2Q21
2Q21
125
366 7
Higher operating income. (46)
Higher equity in earnings of Usiminas.
(million $)
Higher current tax on better results.
1,158
707
Net Income Operating Net Financial Equity in Income Net Income
Net1Q21
Income… Operating…Net
Income Financial… Earnings of
Results Income
Tax Tax Net 2Q21
Income…
non-consolidated
Ternium I August 2021 Companies
37First Half of 2021 Results- Webcast Presentation
EBITDA and Net Results
2,608
Higher revenue per ton in the 1H21, reflecting a (715) (57)
strong steel pricing environment.
(million $)
Increase in cost per ton, with higher raw material, 2,478
purchased slab and energy prices, and higher 116
maintenance expenses.
526
EBITDA1H Shipments
EBITDA Price/Mix Cost Other EBITDA
EBITDA 1H
1H20
2020 1H21
2021
231
Higher operating income. 1,976
Higher equity in earnings of Usiminas. (53)
(314)
(million $)
Higher current tax on better results.
1,865
24
Net Income Operating Net Financial Equity in Income Net Income
Net1H20 Income
Income…Operating Income Results
Net Financial Results Earnings of TaxTax
Income Net 1H21
Income…
non-consolidated
Ternium I August 2021 Companies
38Historical Performance
EBITDA and Net Income
Consolidated Shipments (million tons) Ebitda ($ million) and Ebitda Margin (% of net sales)
24%
13.0 12.5 21%
11.6 -9% 11.4 20% 2,698
9.8 17%
15%
1,931
1,549 1,526 1,525
2016 2017 2018 2019 2020 2016 2017 2018 2019 2020
EBITDA per Ton1 ($) Net Income and Earnings per ADS
Net Income ($ million)
208 Earnings per ADS
1,662
159 167
122 134
1,023
868
707 630
3.03 4.51 7.67 2.87 3.97
2016 2017 2018 2019 2020 2016 2017 2018 2019 2020
4Q20
1 Consolidated EBITDA divided by steel shipments.
Ternium I August 2021
39Historical Performance
Cash Flow and Balance Sheet
Free Cash Flow ($ million) Capital Expenditures ($ million)
1,219 1,201
1,052
664
595 560
520
435 409
(26) 2016 2017 2018 2019 2020
2016 2017 2018 2019 2020
Changes in Working Capital ($ million) Net Debt ($ billion)
573
2.7
353
1.7
1.5
(162) (229) 0.9
0.4
0.6x 1.4x 0.6x 1.0x
0.2x1
(865) Dec-16 Dec-17 Dec-18 Dec-19 Dec-20
2016 2017 2018 2019 2020
1 Net Debt/EBITDA Ratio (last 12 months EBITDA)
Ternium I August 2021
40Ternium Brasil Acquisition
A strong foundation for Ternium’s industrial plan in the Americas
Acquired in September 2017
5 mtpy high-end slab facility in Brazil
Further integrate Ternium Brasil to take it to its full
potential
Increase competitiveness in the high-end Mexican steel
market vis-à-vis imports
Improve customer service supported by higher
operational flexibility
Customized steel products
Coordinated product development
Enhanced logistics
Ternium I August 2021
41Debt Profile
Comfortable maturity schedule
$1.6 billion gross debt as of Jun 2021 Debt maturity profile Jun’21 ($/million)
Main outstanding syndicated loans: Tx Mexico Synd. Loan Tx Investments Synd. Loan
Tx Brasil Synd. Loan Other outstanding long-term debt
Ternium Brasil: $500 million Revolving credit facilities
Ternium Mexico: $375 million 683
Ternium Investments S.à.r.l.: $375 million 525
Other outstanding long-term debt:
279
Peña Colorada: $53 million 138
Tenigal: $50 million 9
Revolving credit facilities (uncommitted) of $281 2021 2022 2023 2024 2025
million outstanding, mainly in Mexico and
Colombia
Ternium I August 2021
42www.ternium.com
Ternium I August 2021
43You can also read