MLPA Investor Conference June 2016 - Master Limited ...
←
→
Page content transcription
If your browser does not render page correctly, please read the page content below
MLPA Investor Conference
June 2016
Forward Looking Statements
This presentation includes “forward looking statements” within the meaning of federal securities laws. All statements, other
than statements of historical fact, included in this presentation are forward looking statements, including statements
regarding the Partnership’s future results of operations or ability to generate income or cash flow, make acquisitions, or
make distributions to unitholders. Words such as “anticipate,” “project,” “expect,” “plan,” “goal,” “forecast,” “intend,” “could,”
“believe,” “may” and similar expressions and statements are intended to identify forward-looking statements. Although
management believes that the expectations on which such forward-looking statements are based are reasonable, neither
the Partnership nor its general partner can give assurances that such expectations will prove to be correct. Forward
looking statements rely on assumptions concerning future events and are subject to a number of uncertainties, factors and
risks, many of which are outside of management’s ability to control or predict. If one or more of these risks or uncertainties
materialize, or if underlying assumptions prove incorrect, the Partnership’s actual results may vary materially from those
anticipated, estimated, projected or expected.

Additional information concerning these and other factors that could impact the Partnership can be found in Part I, Item 1A,
“Risk Factors” of the Partnership’s Annual Report on Form 10-K for the year ended March 31, 2016 and in the other reports
it files from time to time with the Securities and Exchange Commission.

Readers are cautioned not to place undue reliance on any forward-looking statements contained in this presentation, which
reflect management’s opinions only as of the date hereof. Except as required by law, the Partnership undertakes no
obligation to revise or publicly update any forward-looking statement.

                                                                                                                                     2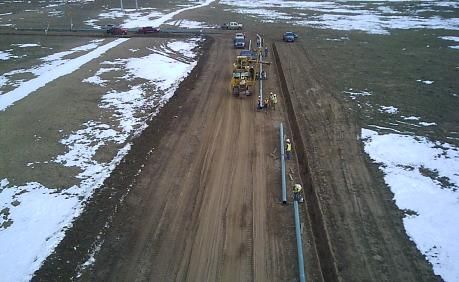
NGL Energy Partners LP
      Overview

                         3
Business Overview

                                                                              NGL
                                                                       Energy Partners LP

                                                                                                                  Refined Products/
                           Crude Logistics         Water Solutions            Liquids            Retail Propane
                                                                                                                     Renewables

                                                                        Blending and Wholesale
                          Crude Oil Volumes and    Water Volumes and
     Primary Drivers:            Storage            Crude Oil Price
                                                                            Butane/Propane       Heating Demand   Motor Fuels Demand
                                                                         Demand and Storage

     Benefits From:      Higher and Lower Prices     Higher Prices           Lower Prices          Lower Prices      Lower Prices

 §     NGL business model has evolved into a vertically integrated business mix that serves as a natural hedge,
       mitigating the impact of commodity price volatility across all segments

 §     Size and quality of cash flows have transitioned NGL into a more traditional midstream platform

 §     Diversified business segments with medium and long term contracts allow for steady fee-based cash flow
       generation in any price environment

 §     Predominantly fee-based segments to make up a larger proportion of future total cash flow

                                                                                                                                       4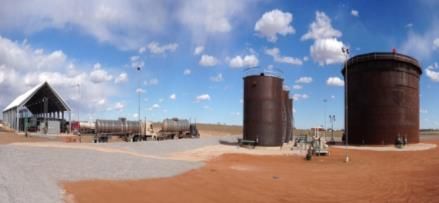
Diversified Across Multiple Businesses
   and Producing Basins

                                                                                           Bakken
                                                                                            Shale

                                                                                                                               Marcellus
                                                                                                                                Shale

                                                                Green River
                                                                   Basin

                                  Pinedale Anticline                                         DJ
                                                                                            Basin

                                             Jonah Field

                                                           Niobrara Shale

                                                             Wattenberg Field

                                                                     Mississippi Lime

                                                                            Granite Wash

                                                                                                                                           NGL Owned/Leased Assets
NGL Utilized Assets                                                                     Permian
                                                                                         Basin
                                                                                                                                                NGL Assets
     NGL Rack Marketing Terminal
     TransMontaigne Terminal                                                                                                                    Water Services
     NGL Renewable Marketing                                                                                                                     Retail Propane
     Terminal                                                                                                                                    Crude Barges and
     NuStar Energy Terminal                                                                Eagle Ford                                            Tug Boats
     Common Carrier Propane                                                                                                                      Crude Oil Logistics
     Pipelines                                                                                          Basins
     Colonial Products Pipeline                                                                                                                  NGL Crude Terminal
     Santa Fe Products Pipeline                                                                         Assets and Marketing                     Glass Mountain (50%)
                                                                                                        Presence
     Magellan Products Pipeline                                                                                                                  Grand Mesa Pipeline
     NuStar Products Pipeline

                                                                                                                                                                        5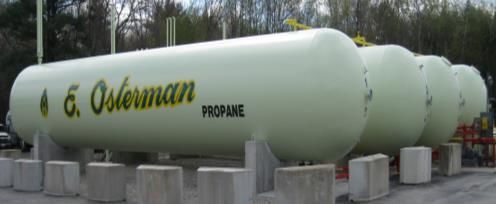
NGL Operational
 Business       Assumptions
          Strategy
                           §   Transport crude oil from the well head to refiners

  Build a diversified      §   Refined Products from refiners to customers
  vertically integrated    §   Wastewater from the wellhead to treatment for disposal, recycle or discharge
  Energy Business
                           §   Natural Gas Liquids from processing plant to end users including retail propane customers

                           §   Projects that increase volumes, enhance our operations and generate attractive rates of return
  Achieve organic growth
  by investing in new      §   Accretive organic growth opportunities that originate from assets we own and operate
  assets                   §   Focused on projects within crude oil logistics, NGL liquids and refined products that provide high quality fee based revenues

                           §   Build upon on our vertically integrated business
  Accretive growth         §   Scale our existing operating platforms
  through strategic
                           §   Enhance our geographic diversity
  acquisitions
                           §   Continue our successful track record of acquiring companies and assets at attractive returns

                           §   Focus on long-term fee based contracts and back-to-back transactions that minimize commodity price exposure
  Focus on businesses
  that generates long-     §   Increase cash flows that are supported by certain fee-based multi-year contracts that include acreage dedication and volume
                               commitments
  term fee based cash
  flows                    §   Expand retail propane footprint where business has a high percentage of company owned tanks resulting in strong customer
                               retention rates

                           §   Target leverage levels that are consistent with investment grade companies
  Disciplined Capital
  Structure                §   Maintain sufficient liquidity to manage existing and future capital requirements and take advantage of market opportunities

                           §   Prudent distribution coverage to manage commodity cycles and fund growth opportunities

                                                                                                                                                        6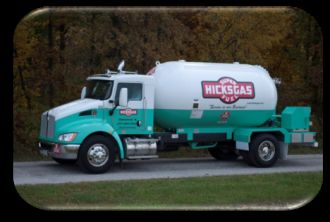
NGL Operational
 Growth Projects Assumptions
                 and Recent Events
      Organic Growth
                               §   On schedule for in-service date of November 1
                               §   Combination with Saddlehorn reduced capital requirements by approximately $200 million
                               §   NGL will own 150,000 barrels per day of capacity on undivided joint interest pipeline
     Grand Mesa Pipeline       §   Total expected capex of $800 million; Remaining capex to spend of approximately $110 million as of March 31,
                                   2016
                               §   Year 1 EBITDA projected to be $120 million increasing to $150 million in Year 2
                               §   Take or Pay contracts with average term - 9 years
                               §   Gulf coast crude storage terminal facility in Houma, La
                               §   Strategic location next to major refiner
     Crude Terminal, LA
                               §   Total project cost $35 million with in-service date of 9/30/16
                               §   Project multiple of approximately 4.0x
                               §   800 acre facility capable of 8 salt dome caverns for propane and butane storage
                               §   4 caverns in operation with the 5 th cavern to be completed by mid-June providing total capacity of 5.4 MMBbls
    Sawtooth NGL Caverns
                               §   Repeatable fee based business
                               §   Largest west coast liquids storage facility

  Strategic Transactions

                               § April 2016 completed $200 million private placement of 10.75% Class A Convertible Preferred Units
  Preferred Equity / Oaktree   § Created a strategic relationship to pursue future opportunities
                               § Proceeds will be used to reduce debt and fund growth opportunities

                               § Feb. 2016 closed the sale of our interest in TransMontaigne GP to ArcLight Capital Partners for $350 million
                               § Retained the TMG marketing business (customer contracts, line space on Colonial and Plantation Pipelines), also
  TransMontaigne GP/LP Sale      entered into marketing agreement which extends NGL lease of TLP’s SE terminals
                               § April 2016 sold remaining 3.2 million common units of TLP for $112.4 million
                               § Transactions result in no reductions to EBITDA for ongoing NGL refined products business

                                                                                                                                                    7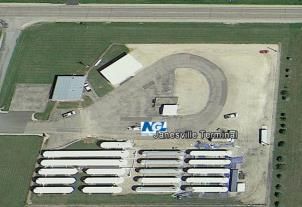
Segment
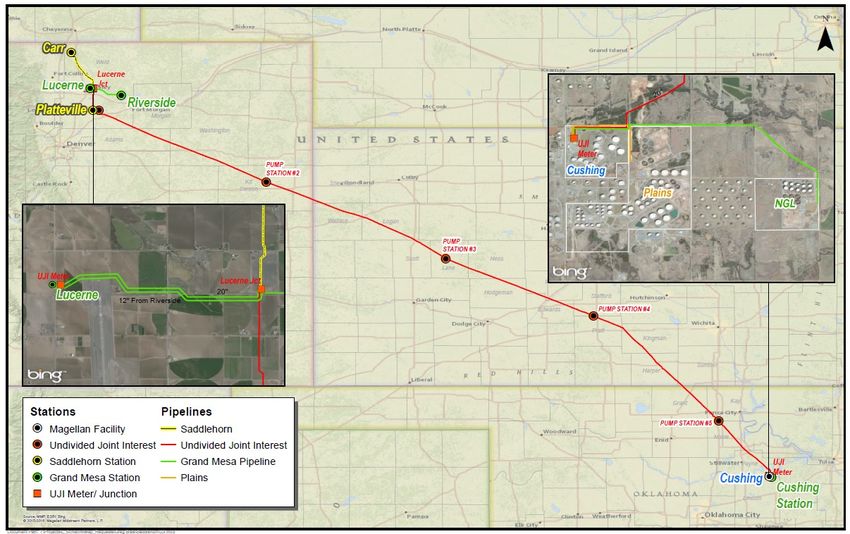
Grand Mesa
Contribution
Update
§ NGL announced in November that it is combining Grand Mesa with Saddlehorn Pipeline Company, LLC ("Saddlehorn") for the construction of a
20-inch undivided joint interest pipeline from the DJ Basin to Cushing
– Operating costs will be allocated to Saddlehorn (62.5%) and Grand Mesa (37.5%) based on their proportionate ownership interest and throughput
once in-service
– Pipeline has 340,000 bpd initial capacity with potential of 400,000 bpd of capacity, of which NGL owns 150,000 bpd capacity
– NGL expects a reduction in capital expenditures of ~$200 million and a ~$2 million decrease in annual operating costs from the combination of
pipeline projects
– Crude oil shipments expected to begin by November 1, 2016
– The Partnership currently expects year one EBITDA to be approximately $120 million, year two EBITDA to be approximately $150 million and the
average contract term on the pipeline to be approximately nine years.
Grand Mesa Pipeline
8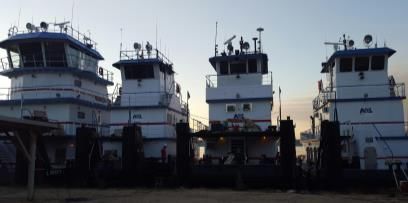
Operating Segments

                     9
Segment
Crude Oil Contribution
          Logistics
                                  Overview                                                                       Area of Operation
 §   Purchases and transports crude oil for resale to a pipeline injection
     point, storage terminal, barge loading facility, rail facility, refinery or trade
     hub

 §   Provides transportation, terminaling, and storage of crude oil and
     condensate to third parties for a fixed-fee per barrel

 §   Long term, take-or-pay contracts on Grand Mesa Pipeline and Glass
     Mountain Pipeline

 §   Ability to take advantage of Contango markets and lock in forward
     Crude Oil curve pricing on our storage

 §   Purchase and sale transactions are entered into on a back-to-back
     basis

                     Sample of Counterparties                                                                      Asset Summary
                                                                                         §   Crude Oil Pipelines
                                                                                                –   100% interest in Grand Mesa Pipeline; 150MBPD capacity
                                                                                                –   50% interest in Glass Mountain Pipeline; ~147MBPD capacity
                                                                                                –   Ship on 21 common carrier pipelines, Utilize historical shipper
                                                                                                    space on 11 prorated pipelines
                                                                                         §   Crude Oil Storage
                                                                                                – 4.6 MMbbls of storage in Cushing
                                                                                                – 4 Gulf Coast terminals with storage of approx. ~510 Mbbls
                                                                                                – Port of Catoosa, Oklahoma - storage services; truck and rail trans-
                                                                                                    loading to barges with access to Gulf Coast; 140Mbbls storage
                                                                                                    capacity
                                                                                         §   Crude Oil Transportation
                                                                                                – 50+ truck terminals, ~200 owned trucks and ~270 trailers
                                                                                                – ~1,000 GP railcars leased or owned
                                                                                                – Own 11 tows, 25 barges, >25Mbbls per barge capacity

                                                                                                                                                                        10
Segment
Crude Oil Contribution
Logistics
Adjusted EBITDA (In Millions) Crude BBL’s/Day (In Thousands)
$150 368
$127 400
300
$100 230
$73
$61 184
200
$41 126
$50
100
$- 0
FY 2014 FY 2015 FY 2016 FY 2017E FY 2014 FY 2015 FY 2016 FY 2017E
§ $1 change in crude price impacts margins by approximately $.015 § 10% change in crude volumes impacts gross margin by
per barrel approximately $5 million
Assets
4 NGL Crude Logistics Tugboats Arnett Origin Station for Glass Mountain Pipeline
11Segment
Water Solutions
Contribution
Overview Area of Operation
§ Provides services for the treatment, processing, and disposal of
wastewater, and solids generated from oil and natural gas production
§ Revenue streams from the disposal of wastewater, solids, water
pipelines, truck and frac-tank washouts, and recovered hydrocarbons
§ Over 1.5 million bpd of total capacity
§ Significant Geographic diversification in the basins with the most
attractive returns
§ Working towards long-term take or pay contracts with producers,
have several currently in place
§ Ability to provide all levels of technology required per basin. Multi-
patented 14-step water treatment process to provide better than
drinking water quality
Sample of Counterparties Asset Summary
§ 70 water treatment and disposal facilities, including 86 wells across
the Permian, Eagle Ford, DJ, Bakken and Pinedale Anticline basins
§ 8 facilities that can dispose of solids such as tank bottoms and drilling
fluids
§ 2 facilities in the DJ have the technology needed to treat the water to
the point that we can sell the water back to producers for use in future
drilling operations
§ 1 facility in the Pinedale Anticline that can process water to a recycle
and discharge standard
§ Several water pipelines which directly connect from oil and gas
producing wells to NGL’s salt water disposal facilities
12Segment
Water Solutions
Contribution
Adjusted EBITDA (In Millions) Water Disposal BBL’s/Day (In Thousands)
570 585
$150
$126 600
500 443
$100 400
$68 $72
$65
300 207
$50 200
100
$- 0
FY 2014 FY 2015 FY 2016 FY 2017E FY 2014 FY 2015 FY 2016 FY 2017E
§ $1 change in Crude Price impacts Oil Revenue by $1 million § 10% change in water volumes impacts gross margin by
annualized at current volumes approximately $11 million
Assets
NGL saltwater disposal facility with solids processing capacity NGL Anticline water recycling & discharge facility
13Segment Contribution
Liquids
Overview Area of Operation
§ Transports, stores, and markets NGLs to and from refiners, gas
processors, propane wholesalers, propane retailers, proprietary
terminals, petrochemical plants, diluent markets and other merchant
users of NGLs
§ Service offered in each of the lower 48 states and Canada
§ Utilizes terminal storage to take advantage of seasonal demand
§ Purchase-and-sale transactions are entered primarily on a back-to-
back basis
§ Majority of liquids sold are butane and propane
§ Automated truck loading and unloading facilities operating 24 hours
a day
Sample of Counterparties Asset Summary
§ 19 terminals serving over 400 customers
§ 13 terminals with rail unloading capability, 4 multi-product
terminals, 9 pipe-connected terminals
§ > 3.8 million barrels of leased underground storage, 0.33 million
barrels of above ground storage
§ Sawtooth NGL Caverns, 5 Caverns with ~5.4 million barrels of
butane and propane storage in Utah
§ Shipper on 5 common carrier pipelines
§ ~ 3,500 leased high pressure railcars; ~ 600 GP railcars
14Segment Contribution
Liquids
Adjusted EBITDA (In Millions) Propane & Other NGL’s GAL’s/Day (In Thousands)
$150 4,000 3,522 3,400 3,425
3,261
$101 3,000
$93 $93 2,306
$100 $84 2,155 2,262
1,942
2,000
$50
1,000
$- 0
FY 2014 FY 2015 FY 2016 FY 2017E FY 2014 FY 2015 FY 2016 FY 2017E
Propane Other NGL's
§ $0.01 change in Propane Margin/Gallon impacts EBITDA by $12.5MM annualized § 10% change in Propane volumes impacts gross margin by approximately by $ 4.7 million
§ $0.01 change in Other NGLs Margin/Gallon impacts EBITDA by $8.4MM § 10% change in Other NGLs volumes impacts gross margin by $8.7 million
annualized
Assets
Railcar Rack at NGL Sawtooth Caverns Lebanon NGL Wholesale Liquids Terminal Janesville NGL Wholesale Liquids Terminal
15Segment
Retail Propane
Contribution
Overview Area of Operation
§ Sells propane and distillates to end-users consisting of residential,
agricultural, commercial and industrial customers
§ 6th Largest Retail Propane business in the United States
§ Geographic diversity mitigates weather risk
§ No customer accounts for more than 1% of revenue
§ Seasonal business with ~65% of retail propane volume sold during the peak
heating season from October through March
§ Liquids Logistics segment provides 75% of Retail Propane segment
demand
§ Cost plus margins allow immediate pass-through of wholesale price
increases
§ Focus on residential customers, high tank ownership and customer
retention
Sample of Trade Names Asset Summary
§ Own or lease 107 customer service locations
§ Own or lease 91 satellite distribution locations
§ Aggregate propane storage capacity of 11.5 million gallons
§ Aggregate distillate storage capacity of 3.7 million gallons
§ Own 400 bulk storage tanks with capacities ranging from 2,000 to
90,000 gallons
§ Customer service locations in Illinois and Indiana rent over 16,000 water
softeners and filters
16Segment
Retail Propane
Contribution
Adjusted EBITDA (In Millions) Propane & Distillate GAL’s/Day (In Thousands)
$150 470
500 445 464
416
$91 $97 $95 400
$100 $79
300
$50 200
96 96 84 103
100
$- 0
FY 2014 FY 2015 FY 2016 FY 2017E FY 2014 FY 2015 FY 2016 FY 2017E
Propane Distillate
§ $0.01 change in Margins is equal to $2MM in Gross Margin § 10% change in Propane volumes impacts gross margin by
approximately by $15 million
Assets
4 Osterman storage tanks at an NGL retail location Hicks delivery truck at NGL retail location
17SegmentProducts/Renewables
Refined Contribution
Overview Area of Operation
§ Purchase refined petroleum products primarily in the Gulf Coast, Southeast,
and Midwest regions of the United States and schedule them for delivery
primarily on the Colonial, Plantation, Magellan and NuStar pipelines
§ Sell our products to commercial and industrial end users, independent
retailers, distributors, marketers, government entities, and other
wholesalers
§ Market our products at TLP’s terminals and at terminals owned by third
parties.
§ Focus on large, credit worthy customers with Retail Demand
Sample of Counter Parties Asset Summary
§ Allocated Line Space on the Colonial and Plantation pipelines
§ Sales from approximately 200 terminals over 37 states
§ Approx. 307 million gallons of storage capacity
§ Automated truck loading and unloading facilities operating 24 hours a day
§ Rack sales through common carrier pipeline terminals
§ Long-term Lease of TLP SE Terminals along Colonial and Plantation
pipelines
§ Continue to market under TransMontaigne LLC trade name
18SegmentProducts/Renewables
Refined Contribution
Adjusted EBITDA (In Millions) Refined Products/Renewables BBL’s/Day (In Thousands)
$142 270
$150 $134 300
210
186
$100 200
$79
$50 100
27 15 16 16
10
0
$-
FY 2014 FY 2015 FY 2016 FY 2017E
FY 2014 FY 2015 FY 2016 FY 2017E
Refined Products Renewables
§ $0.01 change in Refined Product Margin/Gallon impacts EBITDA by § 10% change in Refined Product volumes impacts gross margin by
$42MM annualized $13 million
Assets
Refined Products Terminal Caljet facility in Phoenix
19Financial Overview
20Financial Objectives
§ The Partnership has made significant strides in the last 7 months
Strong Balance and will continue to pursue a flexible balance sheet with a leverage
Sheet target of less than 3.25x on a compliance basis
§ Goal of achieving investment grade rating
§ Increasing fee-based business and long-term contracts with high
Robust Distribution Coverage
Cash Flow credit quality customers
Predictability
§ Transitioning to a more traditional midstream repeatable cash flow
Cap ive
model
Proj tal
ects
et
i
Accr
Stron e
Balan t
Shee
g
c
§ Continues to pursue opportunities to find and execute on low cost of
Lower Cost of capital financing in the current and future environments
Capital
§ Consistently pursuing strategies that increase NGL’s unit price and
y
ilit lower cost of debt
Lo
ab
w
ict
er
ed
C
r
os
P
to
l ow
fC
hF § Five business segments provide multiple growth platforms
ap
s
Ca
ita
l
Accretive Capital § Accretive growth through organic growth projects and strategic
Projects
acquisitions focused on assets backed by multi-year fee based
contracted cash flows
§ Sufficient liquidity to operate the business and execute growth objectives
Robust Distribution § Targeting 1.3x - 1.5x distribution coverage
Coverage
§ Excess distribution coverage will be used to strengthen the balance
sheet
21NGL Management Goals and Achievements
1) Reduce Committed Capital Expenditure Requirements
2) Strengthen Balance Sheet and Enhance Liquidity § Retired ~$100 million of NGL debt at ~60% of par
§ Temporary reduction of the NGL common unit
3) Lower Current Cost of Capital Including Lower Debt and distribution to $1.56 annualized
Common Unit Yields § Formed a strategic partnership with Oaktree and
issued $200 million of preferred units
4) Capacity to Fund Strategic Future Growth Opportunities
§ Sale of the TLP GP to ArcLight for
$350 million and reduced debt § Sale of TLP
§ Combination of Grand Mesa and § Retained TransMontaigne LLC refined LP common
Saddlehorn projects reduced products business units for
capital requirements by ~$200 ~$112 million
§ Extended our lease agreement of TLP
million
SE Terminals
11/1/2015 12/1/2015 1/1/2016 2/1/2016 3/1/2016 4/1/2016 5/1/2016
10/1/2015 5/26/2016
22Performance Metrics
(1)
NGL Adjusted EBITDA (In Millions) Acquisition, Growth and Maintenance Capex (In Millions)
$1,269
$500
$443
$424 $961
$271 $600
$491
$184
$200-$300
$133 $160 $138
$59$14 $32 $35 $30 $35
$24 $-
FY 2013 FY 2014 FY 2015 FY2016 FY 2017E
IPO FY 2013 FY 2014 FY 2015 FY2016 FY 2017E
Acquisitions Growth Capital Maintenance Capital
(2)
Distributable Cash Flow & Total Distributions (In Millions) Distribution Coverage
$357 2.0x
$320
$290
$266 $277
1.3x-1.5x
1.2x Target
$182 1.0x
$169 $168 1.0x
FY 2014 FY 2015 FY2016 FY 2017E FY 2014 FY 2015 FY2016 FY 2017E
Distributable Cash Flow Distributions
(1) Does not include TLP capital expenditures (2) Includes the GP and preferred unit distributions if any 23NGL
KeyOperational Assumptions
Investment Highlights
§ Multiple business segments reduce cash flow volatility and provides significant opportunities for growth in multiple
regions and business segments
Diversified and
§ Presence in the highest rate of return oil & gas producing regions in North America as well as the highest growing
Attractive Asset Base population areas for consumer demand
§ Natural hedge between business segments reduces commodity price volatility and risk exposure
§ Vertical integration allows for capture of margin across the value chain from wellhead to end-user
Vertical Integration
§ Emphasis on asset ownership drives ability to capitalize on multiple revenue/bolt-on opportunities
§ Focus on medium to long-term, repeatable fee-based cash flows
Stable Cash Flows § Combination of fee-based, take-or-pay, acreage dedication, margin-based and cost-plus revenue contracts
§ Targeting ~70% fee based revenues upon Grand Mesa completion in normal commodity price environment
§ Conservative capital structure with low leverage (targeted compliance leverage of under 3.25x
Strong Credit Profile and
§ Targeting distribution coverage between 1.3x - 1.5x on a go-forward basis
Liquidity
§ Excess distribution coverage will be reinvested in growth opportunities and reduce indebtedness
§ Adjusted EBITDA growth from $24 million at IPO to $500 million forecasted for Fiscal 2017
Successful Track
§ Growth has been combination of organic and acquisitions (more than 40 completed since IPO) for aggregate value
Record of Growth
over $4.0 billion
§ Extensive industry and MLP experience with proven record of acquiring, integrating, operating and growing
successful businesses
Experienced & Incentivized § Senior management holds significant limited partner interests and general partner ownership, which strengthens
Management Team alignment of incentives with lenders and public unitholders
§ Support general partner which is privately owned with no indebtedness
24Appendix
254th Quarter Update
§ Segment Summary Quarterly Summary Performance ($’s In Millions )
– Refined Products/Renewables continues to outperform expectations
4Q FY2016 4Q FY2015 % Variance
driven by growth in motor fuels demand Total Volume (In Thousand's)
– Crude Logistics was impacted by lower crude production and pricing. Refined Products/Renewables
Refined Products (BBL's) 27,780 18,997 46%
Storage demand increased in contango market
Renewables (BBL's) 1,650 1,364 21%
– Liquids business was impacted by warmer winter weather however Crude Oil (BBL's) 11,300 20,569 -45%
expects less volatility through Sawtooth storage growth Liquids
Propane (GAL's) 424,403 481,187 -12%
– Retail Propane volumes were impacted due to significantly warmer than Other NGL's (GAL's) 194,013 210,968 -8%
normal winter Retail Propane
Propane (GAL's) 62,300 73,813 -16%
– Water Solutions continues to see volume and margin pressure from
Distillates (GAL's) 12,929 16,769 -23%
lower crude prices and decrease in active rig count
Water Disposal (BBL's) 43,597 48,912 -11%
§ Executed balance sheet and liquidity improving transactions during quarter and
immediately following: Total Revenue $ 11,742.1 $ 16,802.1 -30%
Total Cost of Sales $ 10,839.0 $ 15,958.2 -32%
– TLP GP and LP sales - $462 million Adjusted EBITDA (1) $ 154.0 $ 185.0 -17%
(2)
– Buying back of NGL Bonds - $98 million face value Distributable Cash Flow $ 123.0 $ 153.5 -20%
– Preferred Equity Issuance - $200 million Distribution to LP Unitholders $ 0.39 $ 0.63 -38%
– Pro forma 3/31/16 liquidity of over $600 million Distribution Coverage 3.02x 1.88x 61%
(3)
§ Temporary reduction of the NGL LP unit distribution to $1.56 per unit Maintenance Capex $ 2.6 $ 4.3 -40%
annualized Growth Capex (3) $ 154.5 $ 160.0 -3%
§ Provides valuable liquidity to reduce debt and fund capital projects
Covenant Compliance Leverage(4) 3.84x 3.18x
with excess coverage Total Debt (Excluding Working Capital Facility) $ 2,294.3 $ 2,057.3 12%
§ Reduces the distributions to NGL GP to approximately $0, proving
Working Capital Facility $ 618.5 $ 688.0 -10%
Total Liquidty $ 329.9 $ 253.2 30%
NGL GP support of the LP
(1) Does not include acquisition expenses (2) Includes acquisition expenses. (3) Does not include TLP capital expenditures (4) Covenant Compliance Leverage 26
excludes acquisition expenses, excludes the working capital facility and includes Pro Forma or add-backs for projects in construction or recently purchasedCredit Profile
Debt Maturities and Balances (In Millions ) Balance Sheet Summary (In Thousands) (2)
$2,000 $1,848 3/31/2016 12/31/2015 Change
Cash and Equivalents $ 28,176 $ 25,179 $ 2,997
$1,500
Other Current Assets 1,000,304 1,204,380 (204,076)
Current Assets 1,028,480 1,229,559 (201,079)
$1,000
$383 $369
Property, Plant and Equipment 1,649,572 1,972,925 (323,353)
$500
Goodwill 1,315,362 1,700,154 (384,792)
$25 $50 $50 $50 $50 $25
Intangibles 1,148,890 1,242,440 (93,550)
$-
FY 2017 FY 2018 FY 2019 FY 2020 FY 2021 FY 2022 FY 2023 Investment in Unconsolidated Entities 219,550 467,559 (248,009)
Credit Facility due 11/2018 Other Long Term Assets 198,301 129,344 68,957
5.125% Notes due 7/2019
6.875% Notes due 10/2021
Total Assets $ 5,560,155 $ 6,741,981 $ (1,181,826)
Covenant Compliance Leverage (1) Current Liabilities 706,017 796,908 (97,749)
5.00x Working Capital Facility 618,500 603,500 15,000
Long-Term Debt 2,294,337 2,719,992 (425,655)
3.9x 3.7x
4.00x Other Long Term Liabilities 247,236 117,488 129,748
3.2x 3.2x 3.25x
2.9x Target
3.00x Total Partners Capital 1,694,065 2,504,093 (810,028)
2.00x
Total Liabilities and Equity $ 5,560,155 $ 6,741,981 $ (1,188,684)
1.00x
Moody's S&P Fitch
.00x Credit Ratings Ba3 BB- B+
FY 2013 FY 2014 FY 2015 FY2016 FY 2017E
(1) Covenant Compliance Leverage excludes acquisition expenses, excludes the working capital facility and includes Pro Forma or add-backs for projects in
construction or recently purchased (2) Most of the significant changes relate to the deconsolidation of TLP 27NGL Organizational Chart
Members
100%
104,169,324 C.U. Outstanding
NGL Energy Holdings LLC
Limited Partners
G.P. (DE LLC) 0.1% GP Interest 99.9% LP Interest
IDR’s
NGL Energy Partners LP (NYSE: NGL)
(DE LP)
100%
NGL Energy Operating LLC
(DE LLC)
NGL Refined
NGL Crude Logistics NGL Water Solutions NGL Liquids NGL Retail Propane
(NGL Crude Logistics, LLC) (1) (NGL Water Solutions, LLC) (NGL Liquids, LLC) (NGL Propane, LLC) Products/Renewables
(TransMontaigne LLC)
(1) Includes the operations of our Legacy Gavilon crude oil logistics, refined products, and renewables businesses.
28You can also read