State of the Markets 2017 - The Early Harvest Second Quarter 2017 - Deloitte UK

Page created by Emily Jennings
 
CONTINUE READING
State of the Markets 2017 - The Early Harvest Second Quarter 2017 - Deloitte UK
State of the
Markets 2017
The Early Harvest
Second Quarter 2017
State of the Markets 2017 - The Early Harvest Second Quarter 2017 - Deloitte UK
State of the Markets: Second Quarter 2017
Four months in, 2017 is shaping up to be a year of harvesting and replanting for the innovation economy.
The SVB team examined the private-company growth propelled by the large capital raises of 2014-15 and the
subsequent plunge in large investments and exits in 2016. Given the activity we’ve seen in the first quarter
of 2017, we are forecasting significant harvesting of returns resulting from the last decade of sweeping
innovations.

We predict many private companies will find numerous avenues open in 2017 for raising cash. For those
companies with the strongest growth stories ― those who are reaching their previously frothy valuations ― the
public equity market, sparingly available in 2016, is opening to new issuances. For companies still growing into
their private valuations, yet in need of capital, there are exceedingly well-capitalized private equity firms
seeking buyout opportunities.

Further, as technology accelerates disruption of incumbent business models, we expect an increase in strategic
corporate acquisitions — designed in many cases to help the corporates stay relevant in the 21st century.

But 2017 isn’t only about harvesting returns. Venture capitalists, flush with cash after raising $42 billion in
2016, will have many opportunities to fund the next crop of innovative companies that are poised to drive
disruption for the next decade.

                                                                                               State of the Markets   2
State of the Markets 2017 - The Early Harvest Second Quarter 2017 - Deloitte UK
State of the Markets: Second Quarter 2017

1   Predictions: Year to Date

2   Market Dynamics

3   Decisions Ahead for Late Stage

4   The Early Harvest: IPO Conditions

5   Encouraging Outlook for UK

6   Closing Thoughts

                                        State of the Markets   3
State of the Markets 2017 - The Early Harvest Second Quarter 2017 - Deloitte UK
Preliminary Grades on 2017 Predictions
The themes of 2016 have provided reliable insight into what 2017 holds for the venture landscape.
But risks remain: Unexpected economic or geopolitical events could shock the innovation economy.

                        Q1 Predictions                                                    Q2 Updates
 With plenty of capital in VC war chests, valuations                                      Early indications for 2017 point toward a
  remain stable across early stages but fall in later                      Valuations     plateau in valuations, as comparable capital
           stages without crossover participation.                                        levels flow to fewer deals.

        With public company valuation confidence                                          After a slow start to 2017 following the U.S.
  restored and a stable of maturing unicorns, 2017                                IPOs    presidential election, IPOs have picked up steam.
     sees 2 to 3 times the number of IPOs as 2016.                                        Bellwether Snap Inc. successfully listed in March.

           Tech giants’ spending spree reaches the                                        Two unicorns were acquired in Q1’17 — as many as
      VC-backed ecosystem but with mixed success                                  M&A     went public. Expect future deals both explosive
    compared to the most recent private valuation.                                        (AppDynamics, $3.6B) and tame (SimpliVity,
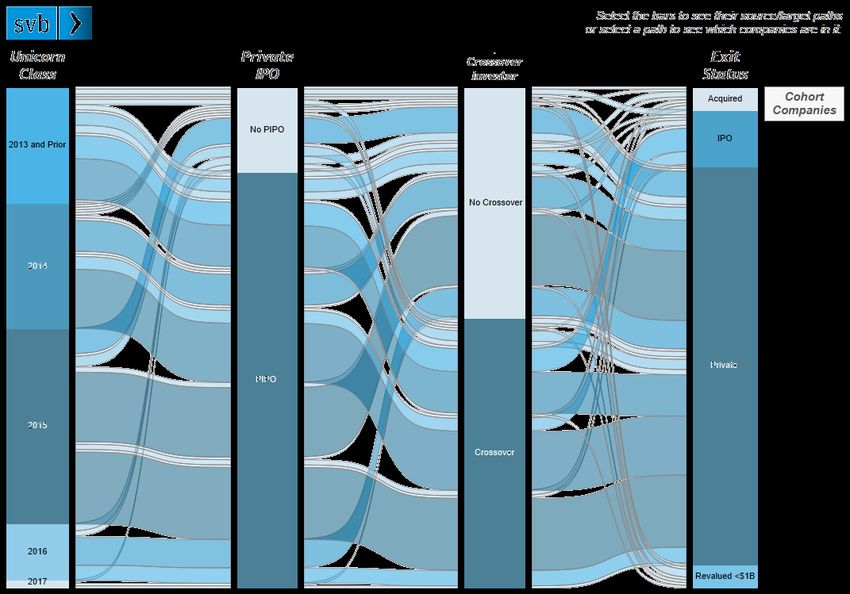
State of the Markets 2017 - The Early Harvest Second Quarter 2017 - Deloitte UK
Market
Dynamics

           State of the Markets   5
Post-Election Rally Reaches New Peaks
The bull run in U.S equities showed no signs of slowing post-election, touching all-time highs even in the
face of fiscal policy stumbles and geopolitical uncertainty.

 Nasdaq Composite Index: Q2’16–Q1’17
 7000
                                                                   Post 2016 Election:              • U.S. investment
                                                                   +14%                               incentives
 6500
                                                                                                    • Tax reform

 6000

 5500                                                                                               • Geopolitical
                                                                                                      concerns
                                                                                 Year 2000 Peak     • Reduced trade
 5000
                                                                                                      and/or immigration
                                                                                                    • Rising rates
 4500

 4000
        April    May      June      July   Aug.   Sept.   Oct.   Nov.   Dec.   Jan.   Feb.   Mar.
        2016                                                                   2017

                Source: S&P Capital IQ.                                                                       State of the Markets   6
The Federal Reserve Tightens Monetary Policy
Strong economic growth indicators in the United States have led the Fed to hike rates three times since
October 2015, departing from a decade of dovish interest rates. The market believes there are more to come.

 Fed Funds Effective Overnight Rate: Q2’07–Q1’17                      Probability of a Rate Hike based on Fed Funds Futures:
                                                                      As of 3/31/2017
  6%

                                                                                                                     80.0%
  5%

                                                                                                    63.0%
  4%                                                                                   56.7%

  3%

  2%
                                        Three rate hikes
                                     in the last 18 months                13.3%
  1%

  0%
       April       Jan.          Jan.          Jan.     Jan.   Jan.
                                                                           May          June          July            Sept.
       2007        2009          2011          2013     2015   2017

               Sources: S&P Capital IQ and Bloomberg.                                                    State of the Markets   7
Rising Rates Lead to Real Capital Movement
As the sun sets on an era of historically low rates, fund managers are once again able to find yields in
debt instruments. Investors in Q1’17 clamored for floating-rate corporate loans, which perform well in
rising interest rate environments, with outsized demand actually reducing the cost of borrowing for
firms. This led to the highest quarterly volume of repricings in the last 15 years.

 Quarterly Volume of Corporate Leveraged-Loan Repricing: Q1’02–Q1’17
 $250B

 $200B

 $150B

 $100B

  $50B

   $0B

           Adopted from: Wirz, Matt. “U.S. Firms Slash Interest Tab in $100 Billion Refinancing Blitz.” The Wall Street Journal. Feb. 8, 2017.
           https://www.wsj.com/articles/u-s-firms-slash-interest-tab-in-100-billion-refinancing-blitz-1486549801
           Data source: Leveraged Commentary and Data, an offering of S&P Global Market Intelligence.                                            State of the Markets   8
Decisions Ahead
for Late Stage

                  State of the Markets   9
Froth Subsides from an Otherwise Healthy Ecosystem
As crossover investors chase returns elsewhere, $100M-plus rounds are again something of a rarity.
Late-stage companies, which may have otherwise continued to rely on growth capital, will face
decisions as to how to adapt to a shifted landscape.

Venture Capital Invested in Information Technology by Round Size: 2012–Q1’17
                                                                                                                                $20B
  Split by Round Size:
    $100–999M        $1B+
                                                                                                                                $18B
    $25–50M          $50–100M
    $0–9M            $10–24M
                                                                                                                                $16B

                                                                                                                                $14B

                                                                                                                                $12B

                                                                               $100M+ Rounds                                    $10B

                                                                                                                                $8B

                                                                                                                                $6B

                                                                                                                                $4B

                                                                                                                                $2B

                                                                                                                                $0B
   Q1   Q2     Q3      Q4         Q1   Q2   Q3   Q4   Q1   Q2   Q3   Q4   Q1    Q2   Q3   Q4   Q1   Q2   Q3       Q4       Q1
          2012                          2013                2014                 2015                2016                 2017

             Source: PitchBook.                                                                               State of the Markets     10
Options Available to the Late Stage
Lacking the crossover mega-rounds of 2014 and 2015, which extended private runway, today’s late-stage
ventures face a familiar assortment of possibilities worth exploring ― some more lucrative than others.

          $100M+                   Financial                  Strategic
          Rounds                    Buyers                                                      IPO
                                                               Buyers

                                                                                     State of the Markets   11
Turning to Strategic Investors ― Sell or Raise?
Consolidation continues as tech giants look for inorganic growth and accelerated access to hot
markets — particularly autotech and developer tools. Many of these acquisitions were of publicly
traded companies, including the four largest: NXP, LinkedIn, Mobileye and NetSuite.1

 Notable Strategics’ $200M+ Acquisitions: 2016–Q1’17                                       Most Active CVC’s Deal Participation: 2016–Q1’17
                                                                                            90
 Apple                 Alphabet                    Microsoft                                                           Split by Total Round Size:
                                                                                                                         Deals $50M+ Deals
Names to Know in Private Equity
Private equity took notice of steep declines in tech valuations in mid-2016, prompting a string of
acquisitions. Be on the lookout for more investment following new fundraising in 2016 and 2017.

 Notable Private Equity Firms: Technology

                             Vista                              KKR                       Insight                        Thoma Bravo              Silver Lake
                        Equity Partners                                               Venture Partners
                          Austin, TX                    New York, NY                      New York, NY                     Chicago, IL          Menlo Park, CA
 HQ
 Fundraise

                            $10.5B                           $13.9B                            $6.0B                          $7.6B                 $15.0B
                           March 2017                       March 2017                        In Process1                    Sept. 2016              April 2017

                         $1.8B Acquisition                    Series G2                         Series F                 Minority Investment   $24B MBO2 / $67B Acq.2
  Notable Investments

                             May 2016                         Apr. 2017                        Jun. 2014                     Apr. 2017          Feb. 2013 / Oct. 2015

                         $1.6B Acquisition                   Series C2                         Series D                   $3.0B Acquisition          Series G
                            April 2016                       Feb. 2016                         Oct. 2015                      June 2016             March 2017

                         $1.5B Acquisition                    Series D2                         Series C                  $2.4B Acquisition      Growth Financing
                            Sept. 2016                       June 2016                         April 2017                     Dec. 2014             Aug. 2015

                           1. According to The PE Hub; March 7, 2017.
                           2. Denotes participation.
                           Sources: Company websites, Crunchbase, Bloomberg, The PE Hub, S&P Capital IQ and PitchBook.                           State of the Markets   13
What Does It Take to Go Public Today?
Despite investor sentiment shifting away from “growth at all costs,” all 11 of the most recently
announced cloud software offerings were unprofitable as of their S-1 filing. In fact, just two exceeded
the “Rule of 40”* guideline for measuring software-as-a-service company growth vs. profitability.

 Selected Metrics from Last 11 SaaS S-1 Filings: 2016–Q1’17
                                                                                                                                                               100%
     Listed
     Filed                                      Okta3                                                                                                          90%
                                                                                                                           Twilio5
     Acquired
                                                                                                                                                               80%
                                                                      Coupa4
                                                                                                                  MuleSoft2                                    70%

                                                                                                                                                                       Revenue Growth
                      Cloudera1                                                              Alteryx2                                                          60%
                                                      AppDynamics3
                                                                                                    BlackLine4                                                 50%

                                                                                                    Yext3                                                      40%

                                                                                                                                     Everbridge4               30%

      Notes:                                                                                                                       Apptio4                     20%
      1. Growth: Fiscal Year 2017 vs. Fiscal Year 2016; Margin: Fiscal Year 2017
      2. Growth: Full Year 2016 vs. Full Year 2015; Margin: Full Year 2016
      3. Growth: 9 months ended Oct. 31, 2016 vs. 9 months ended Oct. 31, 2015; Margin: 9 months ended Oct. 31, 2016                                           10%
      4. Growth: 6 months ended June 30, 2016 vs. 6 months ended June 30, 2015; Margin: 6 months ended June 30, 2016
      5. Growth: Full Year 2015 vs. Full Year 2016; Margin: Full Year 2015
                                                                                                                                                               0%
   -80%             -70%               -60%                -50%                -40%                -30%                -20%              -10%             0%
                                                                   Operating Margin

              *The “Rule of 40” is a guideline for software-as-a-service companies to manage growth (approximated by revenue) in
              sacrifice of profitability (approximated by operating margin). Growth rate + profitability should exceed 40%.
              For further reading: http://feld.com/archives/2015/02/rule-40-healthy-saas-company.html
              Source: Company SEC filings.                                                                                                      State of the Markets              14
The Early Harvest:
IPO Conditions

                     State of the Markets   15
Multiples Climb Following 2016 M&A Blitz
Cloud software companies continue to ride a wave of restored confidence in valuation metrics as they
enter the public market. After a post-election pause at the start of the year, as of March 31, 2017 two
cloud software companies had successfully listed and three more had filed: Okta, Yext and Cloudera.

 NTM Revenue Multiples1

 10.0x              Shopify: 11x                            Atlassian: 12x                            Twilio: 10x        Coupa: 12x          MuleSoft: 12x
         Box
                                                                                                      Q2-Q3 Cloud M&A
         Cloud IPOs2
  8.0x
         BVP Cloud Index                                                                                 Demandware                                    Alteryx
         Constituents (Median)

  6.0x
                                                                Instructure                                   LinkedIn           Apptio

  4.0x
                                              Xactly
                                                                                                              Opower

  2.0x

                                                                                        6-Month Gap                                Restored
                                 “Good Times”
                                                                                        Between IPOs                              Confidence
  0.0x
         Jan. ’15           April ’15         July ’15           Oct. ’15          Jan. ’16           April ’16     July ’16      Oct. ’16          Jan. ’17

               1. NTM revenue multiples for IPOs based on earliest estimates, adjusted to IPO date.
               2. Multiples above 10x at IPO are represented with an arrow.
               Sources: S&P Capital IQ and Bessemer Venture Partners.                                                                           State of the Markets   16
Recent Listings Exceed Their Private Values
The success of recent IPOs serves as an indication of public market confidence. These companies
represent a diverse range of sectors ― from social media and adtech to communications hardware.

 Market Cap Relative to Last Private Round for Venture-Backed Tech Companies Listing in 2016–Q1’17:
 As of 3/31/2017
         +1061%      +423%
 200%
                                                                                                                                            IPO Date: 2016
                                                                                                                                                      2017
  150%

  100%

  50%

   0%

  -50%
          Acacia      Impinj        Twilio       MuleSoft     The Trade Quantenna           Coupa        Nutanix          Snap   Everspin    Alteryx     Apptio
         .Comm.                                                 Desk     .Comm.                                                   .Tech.

           Includes venture-backed technology companies with available private valuation data within five years of IPO.
           Sources: PitchBook and S&P Capital IQ.                                                                                            State of the Markets   17
Markets’ Calm Waters Ideal for IPO Plunges
After the 2016 U.S. election, the VIX experienced its longest streak of sub-15 closes since 2007.
Despite this period of calm, just two technology companies priced in the three months following the
election. Snap broke that streak with its $3.4 billion capital raise in early March.

  90
 VIX Volatility Index (Daily) vs. U.S. Tech IPO Count (Semiannual): 2007–Q1’17
  80

  70

  60

  50
                                                                                                                             2016
                                                                                                                          Election
  40

  30

  20

  10
                                                                                                                                           IPO
        23    25       2      1       4       2      13    11   16   10   20   10   16   16   23   9     10    7     3      13      4      Count
   0
   Jan/07 2007 Jan/08 2008 Jan/09 2009 Jan/10 2010 Jan/11 2011 Jan/12 2012 Jan/13 2013 Jan/14 2014 Jan/15 2015 Jan/16 2016 Jan/17Q1’17

             Sources: S&P Capital IQ and Yahoo! Finance.                                                            State of the Markets           18
Field of $1B+ IPO Candidates Remains Crowded
Snap’s IPO was just the third U.S. tech debut greater than $10 billion since Facebook’s 2012 offering.
Seven others have attained that lofty valuation through private funding, with another 82 above $1 billion.

 U.S. Tech IPOs with Market Caps $1B+ Sized by First-Day Market Cap or Last Private Valuation: 2012–Q1’17

        2012                 2013                     2014         2015   2016        2017         …and Beyond1
Q1

Q3

Q4                                                                                               x13
                                                                                                       x30
                                                                                                             x35

            1. For illustrative purposes only.
            Sources: S&P Capital IQ and The Wall Street Journal.                                       State of the Markets   19
Encouraging
Outlook for UK

                 State of the Markets   20
UK Shows Vitality in European Venture Landscape
While the long-term impacts of the decision to leave the EU are yet to be seen, the period following last
summer’s referendum saw no significant drop in deal numbers. 1 In fact, recent figures revealed UK tech
firms received more venture capital investment than any other European country post-referendum.2

 European Venture Activity by Region: Q1’17                                             European Venture Activity by Metro (Top 5): Q1’17

           Deal Value              Deal Count
 100%                                                                                      Metro Area       Deal Count         Deal Value
  90%
                                                          UK/Ireland
                                                                                             London             118             €635.4M
  80%        37.5%                   41.6%

  70%                                                     Southern Europe
                                                                                              Paris              41              €235.4M
  60%                                                     Nordics

  50%
                                                          DACH                                Berlin             39             €209.8M
  40%
                                                          France/Benelux
  30%
                                                          Central &
                                                                                           Stockholm             16              €239.8M
  20%
                                                          Eastern Europe
  10%
                                                                                           Barcelona             11               €29.0M
   0%

            1. The Deal: Equity Investment in the UK 2016. Beauhurst (February 2017).
            2. PitchBook data sourced by London & Partners (January 2017).
            Sources: PitchBook and Beauhurst.                                                                               State of the Markets   21
Strong Fundraising Leads to Full Coffers
Global venture capital and private equity firms have $121 billion and $754 billion, respectively, to invest
after raising new funds in recent years. 1 We therefore expect to see funds continue investing in the best
high-growth UK technology companies through 2017 and beyond.

 Global Venture Capital Overhang: 2007–20161                                        European Venture Fund Size: 2007–2016

 $140B                                                                              €200M                                                       €187
                                                                   2016
                                                                Overhang by                       Average
                                                                 Fund Size1
 $120B                                                                                            Median
                                                                                    €160M
                                                                     $1B+
$100B                                                                                                                                           €132
                                                                   $500M-
                                                                                    €120M
 $80B                                                                $1B

 $60B                                                              $250M-
                                                                                     €80M
                                                                   $499M-                   €66
                                                                                                            €60           €55
 $40B
                                                                   $100M-
                                                                                     €40M
                                                                   $249M-                   €24
 $20B                                                                                                       €20           €17
Closing Thoughts

                   State of the Markets   23
Tech Drives Overall Economic Growth
Since the hype and collapse of the dot-com era almost two decades ago, technology has steadily
increased in importance (and value) for the U.S. economy. Tech companies comprise nearly one-quarter
of the S&P 500 index value. As a consequence, all industries face disruption from tech-native companies.

 S&P 500 Technology Sector1 Weighting: 1995–2016                                                  Largest U.S. Companies by Market Cap as of 3/31/2017
                                                                                                  with Value Change Since 3/31/2015
 35%
                                                                                                   Autos                                       Lodging
 30%                                                                                                                                                                +17%2
                                                                                                                                -13%
 25%
                                                                           23%

 20%                                                                                                                                                                +210%
                                                                                                                                                                3
                                                                                                                                -28%
 15%
                                                                                                                                                                     -34%
 10%

                                                                                                                               +91%                                  -19%
  5%
       Technology     Peak of            Trough of                  Slope of
         Trigger      Inflated        Disillusionment            Enlightenment
                    Expectations                                                                                                                                     -19%
  0%
    1995      1998       2001      2004      2007       2010      2013       2016
                                                                                                                                Tech-Native        Other

              1. Amazon.com has been included in the technology sector.
              2. Value change for Marriott is based on stock price. Marriott acquired Starwood for $13B in cash and stock in September 2016.
              3. Airbnb value is based on most recent private valuation (March 2017).
              Sources: Company websites, PitchBook, Siblis Research, CNBC and S&P Capital IQ.                                                        State of the Markets   24
Corporates Take up the Innovation Imperative
Old-guard companies have recognized and embraced the need to innovate — from soup to nuts and
bolts, no sphere of the global economy has been unaffected by this next generation of technology.

 Number of New Corporate Venture Capital Groups: 2011–2016                                                           Deals with CVC Participation: 2011–2016
 120                                                                                                                                                                 1600

                                                                                                                                                                     1400
 100
                                                                                                                                         1

                                                                                                                                                                     1200

  80                                                                                                             2                       2
                                                                                                                                                                     1000
                                                                                          2
                                                                                                                                         1
  60                                                                                                                                                                 800
                                                                                                                 2
                                                                  1                       2
                                                                                                                                         1                     1
                                           2                                                                                                                         600
  40
                                                                                          2
                                                                  1                                                                      1                     1
                  1                       2                                                                                                                          400

  20                                                                                                              1
                                                                                                                                         1
                  1                                               1                       1                                                                    1     200
                                           1

   0                                                                                                                                                                 0
           2011                  2012                    2013                    2014                   2015                    2016             2017

          1. Denotes launch of CVC and/or first investment.
          2. Denotes announcement of corporate initiative (accelerator, research facility, etc.)
          Sources: Company websites, Crunchbase, Fortune, Bloomberg, The Wall Street Journal, Star Tribune, Xconomy, Skift and CB Insights.   State of the Markets         25
Updated: SVB’s Interactive Unicorn Navigator
Use our Unicorn Navigator to follow the journeys of the billion-dollar club as they traverse the venture
landscape toward an eventual exit – now updated with 2017 entrants: C3 IoT, View and Zoom Video.

                                     https://www.svb.com/state-of-the-markets-report/

           Sources: The Wall Street Journal, PitchBook and S&P Capital IQ.              State of the Markets   26
About Silicon Valley Bank                                                                         About SVB’s UK Branch
For more than 30 years, Silicon Valley Bank has helped                                            SVB provides a range of targeted financial services and expertise
innovative companies and their investors move bold ideas                                          through its office in the UK. With commercial and international
forward, fast. SVB provides targeted financial services and                                       banking services, SVB helps address the unique needs of
expertise through its offices in innovation centers around the                                    innovators. The UK's leading technology and life science
world. With commercial, international and private banking                                         businesses, in all stages of development, look to SVB’s niche
services, SVB helps address the unique needs of innovators.                                       expertise, experience and unparalleled network, as they grow at
                                                                                                  home and tackle new markets abroad.

This material, including without limitation to the statistical information herein, is provided for informational purposes only. The material is based in part on information from third-party
sources that we believe to be reliable, but which have not been independently verified by us and for this reason we do not represent that the information is accurate or complete. The
information should not be viewed as tax, investment, legal or other advice nor is it to be relied on in making an investment or other decision. You should obtain relevant and specific
professional advice before making any investment decision. Nothing relating to the material should be construed as a solicitation, offer or recommendation to acquire or dispose of any
investment or to engage in any other transaction.
Silicon Valley Bank is registered in England and Wales at Alphabeta, 14-18 Finsbury Square, London EC2A 1BR, UK under No. FC029579. Silicon Valley Bank is authorised and regulated by the
California Department of Business Oversight and the United States Federal Reserve Bank; authorised by the Prudential Regulation Authority with number 577295; and subject to regulation by
the Financial Conduct Authority and limited regulation by the Prudential Regulation Authority. Details about the extent of our regulation by the Prudential Regulation Authority are available
from us on request. Silicon Valley Bank is a subsidiary of SVB Financial Group, a Delaware corporation and is an affiliate of SVB Financial Group UK Limited. SVB Financial Group UK Ltd is
registered in England and Wales at Alphabeta, 14-18 Finsbury Square, London EC2A 1BR, UK under No. 5572575 and is authorised and regulated by the Financial Conduct Authority, with
reference number 446159. SVB Financial Group and its subsidiary Silicon Valley Bank are members of the Federal Reserve System and Silicon Valley Bank is a member of the FDIC.
©2017 SVB Financial Group. All rights reserved. Silicon Valley Bank is a member of FDIC and Federal Reserve System. SVB>, SVB Financial Group, and Silicon Valley Bank are registered
trademarks.
                                                                                                                                                                   State of the Markets         27
You can also read