The displacement of the Brazilian population to the metropolitan areas
←
→
Page content transcription
If your browser does not render page correctly, please read the page content below

The displacement of the
Brazilian population to
the metropolitan areas
FAUSTO BRITO

       Introduction

T
         HE ACCELER ATED PROCESS of urbanization in Brazil, as a
         result of the internal migrations, is a relatively recent phenomenon
         that is associated to a set of changes that have occurred in the
Brazilian economics, society and politics along the last century, especially in
its second half. That does not mean that the cities did not already belong to
the country’s social picture since the colonial period, in spite of their strict
population dimension.
        From the Second Empire to the end of the Old Republic, with the
remarkable expansion of the coffee-based economics and with the first and
expressive industrialization outbreak, the mercantile relationships increased
among the different Brazilian regions, which so far were but mere regional
archipelagoes. However, the internal migrations did not fit this integration
process, due to the expressive flows of international immigrants. The
international immigration was strongly subsidized by the State, and, in
this way, established a limit to the internal population displacements. The
European immigrants, who up to this time were oriented to the Southern
Region in order to populate it, started to concentrate in Rio de Janeiro and
São Paulo, the same provinces, later states, which presented the greatest
potential of attraction to the internal immigrants. It is estimated that, only
between 1890 and 1899, 1.2 million immigrants arrived in Brazil, mainly in
the aforementioned states (Bassanezi, 1995).
        Those regional archipelagoes, essentially articulated on the agricultural
activities, presented a system of cities polarized by the capitals, forming an
embryonic urban network, basically inshore. The capitals centralized the
major public services and the commercial and financial intermediation of the
regional economical activities, particularly those associated to export and
import. In the beginning of the 20th century, the most important cities were:
Belém and Manaus, on the Northern Region of the country; Salvador, Recife
and Fortaleza, on the Northeast; Porto Alegre and Curitiba, on the South.

ESTUDOS AVANÇADOS    20 (57), 2006                                            221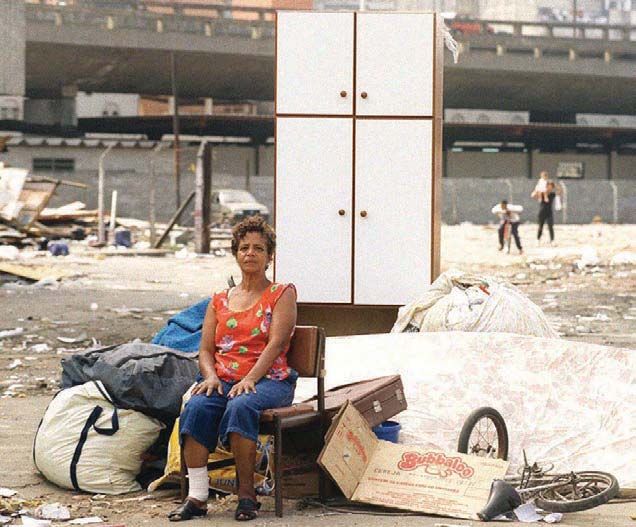
Only Cuiabá, on the Central-Western Region, was an exception to the coastal
trend. On the Southeastern Region, Rio de Janeiro, capital of the Republic,
and São Paulo suffered the demographic impact of the coffee-based economics
expansion and the incipient industrialization. In those two cities, over 50% of
the population of all capitals of the federation states lived in those two cities.
        In 1920, Brazil had a population of 27.5 million inhabitants and counted
on only 74 cities with over twenty thousand inhabitants, in which 4.6 million
people lived – that is, 17% of the total Brazilian population. More than a half of
those that resided in the cities were concentrated on the Southeastern Region.
        The great urban expansion in Brazil, as a fundamental component of
the structural changes in the Brazilian society, occurred on the second half of
the 20th century. Only on the sixties the urban population surpassed the rural
one. Therefore, the fast urbanization process is a relatively recent structural
phenomenon, whose peak can be measured by the speed of the urban
population’s growth between 1950 and 1970 (Charts 1 and 2).
        The swift urbanization of the Brazilian territory is not a strictly
demographic process. It possesses much broader dimensions: it is the Brazilian
society itself that is becoming increasingly urban. In addition to concentrating
an increasing portion of the country’s population, the cities become the
privileged locus of the most relevant economical activities and diffusers of the
new standards of social relationships – including the production ones – and of
lifestyles (Brito & Souza, 2006).
        The big news, when it comes to the Brazilian case, was the speed of
the urbanization process, way higher than that of the most advanced capitalist
countries. Only on the second half of the 20th century, the urban population
increased from 19 million to 138 million inhabitants, growing on a 7.3-fold
basis, with an average annual growth rate of 4.1%. In other words, at each year
an average of over 2.3 million inhabitants were added to the urban population
(ibidem).

       Urbanization, concentration and internal migrations
         This huge transformation of the Brazilian society had as one of its major
vectors the great expansion of the internal migrations. They constituted the
biggest link between the structural changes that the society and economics were
going through and the acceleration of the urbanization process. At the peak of
the urban expansion, the high fertility rates still exerted a certain influence on
the exceptional demographic growth, for only on the second half of the sixties
the decline of the fertility rates started to accelerate and generalize. Nevertheless,
most of the urban demographic growth, between 1960 and 1980, was due to
the intense rural-urban migratory flow. Only between 1960 and the late eighties,
it is estimated that nearly 43 million people left the countryside toward the
cities, including the indirect effect of the migration, that is, the children born to
the rural migrants in the cities (Chart 3).

222                                                 ESTUDOS AVANÇADOS     20 (57), 2006
Chart 1 – Brazil: Rural and urban population, 1940/2000.

      Source: IBGE , Demographic Censuses of 1940, 1950, 1960, 1970, 1980, 1991 and 2000.

    Chart 2 – Brazil: Annual rates of the population’s growth, 1940/2000 (%)

      Source: IBGE , Demographic Censuses of 1940, 1950, 1960, 1970, 1980, 1991 and 2000.

         Chart 3 – Brazil: absolute increment of the urban population and
                  migratory balance over the 1960/1991 period

         Source: IBGE, Demographic Censuses of 1940, 1950, 1960, 1970, 1980 and 1991
                                 (Carvalho & Garcia, 2003)

ESTUDOS AVANÇADOS     20 (57), 2006                                                         223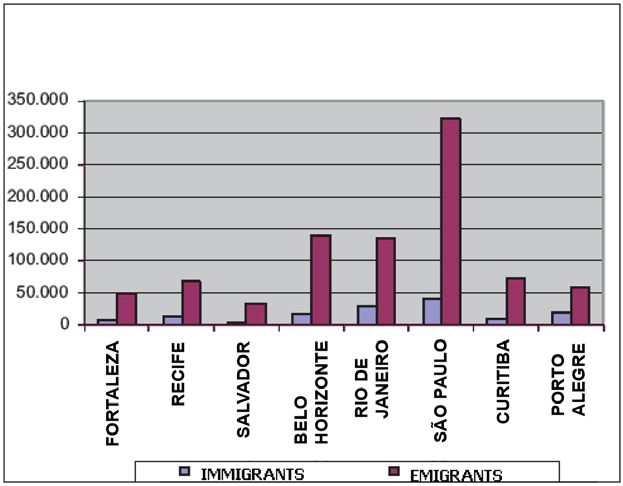
It is a huge population displacement in a short period of time, which
expresses quite well the dimension of the big transformations the Brazilian
society was going through (cf. Brito & Carvalho, 2006).
        The great spatial concentration of the Brazilian economics development,
driven by the industrialization process in Rio de Janeiro and, mainly, in São
Paulo, magnified the regional and social unbalances, stimulating the internal
migrations, which transferred the countryside population to the cities, in
addition to redistributing it among the states and the different regions in Brazil.
        This massive redistribution of the population changed the profile of
the urban population itself. In 1970, more than half of the urban population
already lived in cities with over one hundred thousand inhabitants, and one
third lived in cities with more than five hundred thousand people. In 2000,
about 60% of the urban population lived in cities with over one hundred
thousand inhabitants, showing that the urbanization and the concentration of
the population in the big cities were simultaneous processes in Brazil (Table 1).

  Table 1 – Brazil: relative distribution of the urban population (%), according to the
     cities’ size. Total of the urban population in absolute numbers, 1970/2000
           Cities’ size                 1970           1980           1991          2000
< 20,000 inhabitants                       26.92           21.35          19.34         18.81
ă                            12.04           11.40          12.44         11.49
ă                            7.80           10.50         10.23          10.57
ă                          19.59           21.92         24.43          26.12
500,000 and more                           33.65          34.83          33.56          33.01
Total of urban population            52,097,271      80,436,409     110,990,990   137,953,959
Source: IBGE , Demographic censuses of 1970, 1980, 1991 and 2000.

        It can be observed, however, that the population residing in the cities
with less than fifty thousand inhabitants remains on a level close to one third
of the total urban population. This fact cannot be overlooked, for it certainly is
a consequence of an extremely irregular population occupation of the national
territory, a result of its uneven and combined development and its great
ecological diversity (cf. Carvalho & Garcia, 2003).

        Urbanization and metropolitan agglomerates
       The fast urban expansion in Brazil occurred within the process
of formation of the great metropolitan regions as of the seventies. Those
regions suffered countless transformations with the incorporation of new
municipalities to the already existing ones in its initial formation, as well as
with the less criterious increase of their number. Since the decisions about
the creation or enlargement of the metropolitan regions are accountable to
the State Parliaments, the adopted criteria may often comply more with the

224                                                         ESTUDOS AVANÇADOS      20 (57), 2006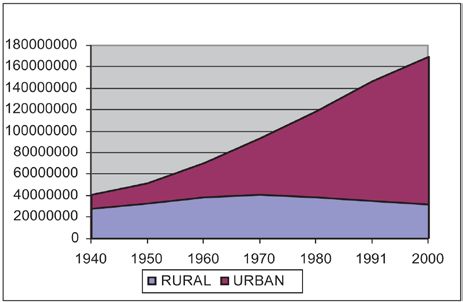
political conveniences than with the actual needs of the metropolitan space
management.
        Aiming at analyzing in a more trustworthy way the Brazilian
metropolises, Ipea, Nesur of the Institute of Economics of Unicamp and
IBGE tried, in a recent study, to identify the characteristics of the real
metropolitan spaces. According to this work, we opted, in this article, for
selecting the ensembles of cities that had been regarded as global metropolitan
agglomerates - São Paulo and Rio de Janeiro -, and national ones - Belém,
Fortaleza, Recife, Salvador, Belo Horizonte, Campinas, Curitiba, Porto Alegre,
Goiânia and Brasília (Ipea, IBGE, Nesur, 1999).

        Table 2 – Brazil: metropolitan agglomerates – total population, 1970/2000
                                                         Total population
 Metropolitan agglomerates
                                      1970            1980            1991          2000
Belém                                 669,768        1,021,486        1,401,305     1,795,536
Fortaleza                            1,070,114       1,627,042       2,339,538      2,910,490
Recife                               1,755,083       2,347,005        2,874,555    3,278,284
Salvador                             1,135,818       1,752,839        2,474,385     2,991,822
Belo Horizonte                       1,619,792       2,570,281       3,385,386      4,177,801
Rio de Janeiro                       6,879,183       8,758,420        9,796,649   10,869,255
São Paulo                            8,113,873      12,552,203       15,395,780    17,813,234
Campinas                              644,490        1,221,104        1,778,821     2,219,611
Curitiba                              809,305        1,427,782        1,984,349    2,635,436
Porto Alegre                        1,590,798        2,307,586        3,029,073    3,498,322
Goiânia                               424,588          807,626        1,204,565     1,609,335
Brasília                              625,916         1,357,171       1,980,432     2,756,701
Agglomerate total (1)              25,338,728       37,750,545       47,644,838   56,555,827
Brazil population (2)              93,134,846      119,002,706      146,825,475   169,799,170
(1) / (2)                                27.21            31.72          32.45         33.31
Urban population (3)               52,097,271      80,436,409       110,990,990   137,953,959
(1) / (3)                                48.64           46.93           42.93          41.00
Source: IBGE , Demographic censuses of 1970, 1980, 1991 and 2000.

       The concentration of the Brazilian population in the metropolitan
agglomerations is very clear from the seventies up to the year 2000, resulting
from the intense migratory flow that had been increasing as of the seventies.
Back in 1970, nearly half the Brazilian urban population already lived in the
selected metropolitan agglomerates. Such a proportion tended to decline, but
on the late 20th century it still remained above 40%. On what concerns to
the total population of the country, it could be detected that, from 1980 on,
approximately one third of it lived in the glomerates (Table 2).

ESTUDOS AVANÇADOS        20 (57), 2006                                                     225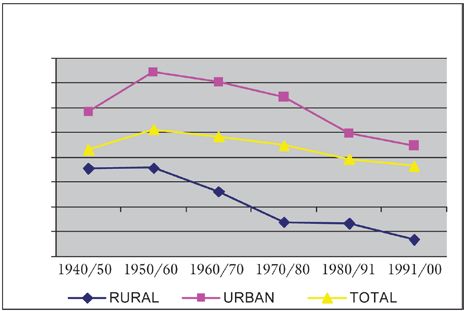
The concentration of the urban population is even more remarkable
if we take into consideration only the metropolitan agglomerates of São
Paulo and Rio de Janeiro. In 1970, nearly 30% of the urban population
lived in them, and, in 2000, the percentage still remained close to 20%. We
can state that the accelerated urbanization in Brazil not only was coexistent
with the process of concentration of the urban population, but with its
metropolitanization as well.
        The data suggest, since the seventies, a relative decentralization of the
population from the metropolitan glomerates, although their demographic
importance remained indisputable. The decrease in the fertility rate, greater in
the big cities, and, basically, the decrease in the migrations – as we will see later
-, have been greatly responsible for the decentralization in favor of median non-
metropolitan cities. In 2000, the rate of the urban population living in cities with
one hundred thousand to five hundred thousand inhabitants, not belonging to the
metropolitan agglomerates – 17.3% -, was already slightly higher than that of the
population that inhabited the agglomerates outskirts, that is, beyond the limits of
the capitals or their nucleuses (Brito & Horta, 2002).
        The economic and social crisis experienced by the Brazilian economics,
along the last two decades of the 20th century, led to a great decrease in the
population’s ability of insertion into the work market in the metropolitan
agglomerates, as well as increased the selectivity of the real estate market. Both
changes worked as a “brake” to the trend that, in the seventies, started to
develop as a “hyper-metropolitanization”.
        We cannot fail to emphasize, however, that, in the nineties, even with
the increasing reduction in the rates of growth of the metropolitan glomerates
ensemble, the average annual increment of its population went from 899
thousand inhabitants, in the eighties, to 985 thousand along the last decade. We
should, furthermore, keep in mind that, in spite of the relative reversal of the
trend to a hyper-metropolitanization, in the year 2000 over 40% of the Brazilian
urban population lived only in the metropolitan areas selected in this article.
        Analyzing, separately, the nucleuses – the capitals – and the outskirts
– the other metropolitan municipalities –, we can detect an extremely
important phenomenon: the spatial reversal of the command of the
agglomerates demographic growth (Chart 4). Despite their evident decline,
the growth rates show they are still high; in the ensemble of the metropolitan
agglomerates they are still relatively high, close to 2% per year along the last
two decades. Nevertheless, the decrease in the capitals growth speed has been
way more accelerated than that of the outskirts – where, in the last decade,
the population increased some 3% per year, compared to a little over 1% in the
nucleuses ensemble.
        Another indicator, the nucleuses’ contribution for the increment of
the glomerates’ total population, in the eighties reveals more clearly still this
spatial reversal of the demographic growth (Table 3).

226                                                ESTUDOS AVANÇADOS     20 (57), 2006
In their ensemble, the capitals, along the nineties, were accountable for
only 38% of the total population growth of the metropolitan agglomerates, in
opposition to the two previous decades, when their participation had almost
reached 60%. The only metropolitan agglomerations that still presented, in the
last decade, a nucleus contribution bigger than the outskirts’ were Fortaleza,
Salvador and Brasília. However, in consonance with the others, they had, along
the considered period, a decrease in the relative weight of their nucleuses,
which grew at a slower pace than that of their outskirts.
Chart 4 – Metropolitan glomerates and annual growth rates of the population,
1970/2000 (%)
TOTAL AGGLOMERATE CAPITALS PERIPHERIES
Fonte: IBGE, Censos demográficos de 1970, 1980, 1991 e 2000.
Source: IBGE , Demographic censuses of 1970, 1980, 1991 and 2000.
Table 3 – Nucleus’ contribution for the increment of the metropolitan
agglomerates population, 1970/2000 (%)
Nucleus’ contribution (%)
Metropolitan agglomerates
1970/80 1980/91 1991/2000
Belém 85.27 81.99 9.11
Fortaleza 80.73 64.71 65.29
Recife 24.19 17.88 30.88
Salvador 80.19 79.45 71.09
Belo Horizonte 57.43 29.36 27.56
Rio de Janeiro 44.63 37.57 35.16
São Paulo 57.87 40.55 32.60
Campinas 50.07 32.82 27.63
Curitiba 67.25 52.12 41.82
Porto Alegre 33.47 19.12 20.71
Goiânia 87.92 51.57 42.19
Brasília 87.44 68.06 57.98
Agglomerates total 58.50 45.10 38.13
Source: IBGE , Demographic censuses of 1970, 1980, 1991 and 2000.
ESTUDOS AVANÇADOS 20 (57), 2006 227“In other words, there has been a great population
evasion from the capitals to the metropolitan outskirts,
here revealed along the quinquennium 1995-2000, but
which had started to show in the eighties.”
Three facts explain this reality: first, the significant decrease in the
women’s fertility rates, certainly higher in the nucleuses than in the outskirts;
second, but certainly more important, the intra-metropolitan migratory flows,
with the migratory balance favorable to the outskirts (Chart 5); third, the
migratory balance of each glomerate, with the remainder of the country, has
been more favorable to the outskirts.
Chart 5 – Metropolitan agglomerates and intra-metropolitan migrants with
origin and destination in the capitals, 2000
Source: Demographic census of 2000.
We can observe that, between 1995 and 2000, the intra-metropolitan
emigrants of the capitals have always been way more numerous than the
immigrants, that is, their intra-metropolitan migratory balances were negative.
In other words, there has been a great population evasion from the capital to
the metropolitan outskirts, here revealed along the quinquennium 1995-2000,
but which had started to show in the eighties (Brito & Souza, 2006).
228 ESTUDOS AVANÇADOS 20 (57), 2006The internal migrations and the metropolitan glomerates
In order to better comply with one of the objectives of this article, in
the analysis of the emigrations and immigrations of the metropolitan
glomerates, we will not be taking into consideration the glomerates of Goiânia
and Brasília, due to the complex definition of the Brasília one, whose territory
extends over the Minas Gerais countryside, which is one of the analysis
units, and to the interactions between them. Campinas will not be taken into
consideration either, for it is a portion of the São Paulo countryside, which is
another analysis unit.
We will analyze, mainly, the results of the Census of 2000. However, in
this initial stage, we must make a comparison between the information on the
migrations of the countryside of the State to which the Metropolitan Region
belongs and the inter-state migrations, using the data on the migrants, fixed
date, of the quinquennia 1986-1991 and 1995-2000.
Table 4 – Selected metropolitan agglomerates, migratory balance,
fixed date, 1986/1991 and 1995/2000
Migratory balance 1986/91 Migratory balance 1995/2000
Metropolitan State State
Agglomerates Other Total Other Total
Country- Country-
States balance States balance
side side
Belém 34,660 -10,155 24,506 32,183 -16,296 15,888
Fortaleza 86,987 -5,370 81,617 38,138 17,877 56,015
Recife 43,730 -25,991 17,738 33,956 -22,613 11,344
Salvador 64,881 -18,261 46,620 45,041 -15,542 29,499
Belo Horizonte 90.038 17,190 107,228 90,440 25,844 116,283
Rio de Janeiro -14,057 -41,817 -55,873 -29,734 40,310 10,576
São Paulo -248,287 376,589 128,302 -296,162 158,692 -137,471
Curitiba 87,747 19,403 107,151 92,327 34,550 126,876
Porto Alegre 77,367 8,972 86,339 46,820 -2,351 44,469
Source: IBGE , Demographic censuses of 1991 and 2000.
In 1986-1991, with the exception of Rio de Janeiro, all other
agglomerates had a positive total migratory balance. However, when
we analyze the inter-state migratory balances in addition to the carioca
metropolis, the agglomerates of the Northeastern Region presented negative
migratory balances as well. On what concerns to the migratory balances
with the countryside of the very State to which the glomerate belongs, Rio
de Janeiro and São Paulo had negative migratory balances, the latter with a
net loss of nearly 250 thousand people. This relation of the flows with the
State countryside is repeated in 1995-2000. In the case of São Paulo, it is
so unfavorable that it cannot compensate the inter-state positive migratory
ESTUDOS AVANÇADOS 20 (57), 2006 229balance, generating a surprising negative total migratory balance. By the way,
it was the only one to have presented, in 2000, a negative total migratory
balance. With regard to inter-state migratory balances, the pattern of the
1986-1991 period is repeated, in a general way, in 1995-2000. There are the
exceptions of Fortaleza and Rio de Janeiro, whose negative migratory balances
became positive on the second quinquennium. We can observe that only Belo
Horizonte and Curitiba had no decline in their migratory balance, between
the two periods and, in both cases, mainly due to the increase in their inter-
state migratory balances.
The migratory balance corresponds to the difference between the
number of immigrants and the number of emigrants. Obviously, small
migratory balances may be the result of very big flows, both of immigrants
and emigrants. This is the case of the metropolitan agglomerate of São
Paulo, where the flows of the 1995-2000 period were big, both inwards and
outwards, mainly in their inter-state exchanges (Table 5). The emigration
from São Paulo was strongly influenced by the return migration, especially
the natives of the Northeastern Region. We can also observe, still concerning
to São Paulo, that its inter-state migratory flows indicate an unmistakable
structural tension between the ongoing process of population decentralization
in the Metropolitan Region and the inertia of the inter-state migratory
trajectories, mainly from the Northeast to São Paulo, as we will see later, which
continued to feed significantly the flow of their immigrants (Table 5).
Table 5 – Some selected metropolitan agglomerates,
fixed date migrants, 1995/2000
Immigrants Emigrants
Metropolitan
State State
regions Other Total of Other Total of
Country- Country-
States immigrants States emigrants
side side
Belém 76,666 37,468 114,134 44,483 53,764 98,246
Fortaleza 92,393 70,078 162,471 54,255 52,201 106,456
Recife 67,730 59,238 126,969 33,774 81,851 115,625
Salvador 110,723 45,860 156,583 65,682 61,402 127,084
Belo Horizonte 177,013 79,615 256,627 86,573 53,771 140,344
Rio de Janeiro 67,901 254,677 322,578 97,635 214,367 312,002
São Paulo 172,134 703,118 875,251 468,296 544,426 1,012,722
Curitiba 144,808 95,571 240,379 52,481 61,021 113,503
Porto Alegre 138,032 44,607 182,639 91,212 46,958 138,170
Source: IBGE , Demographic census of 2000.
In all agglomerates, the immigrants from the countryside of their
respective states were in bigger numbers than those from other states, except
230 ESTUDOS AVANÇADOS 20 (57), 2006in Rio de Janeiro and São Paulo, where the inter-state immigrants were
predominant. With regard to the emigration, the inter-state emigrants formed
the majority in Belém, Recife, Curitiba, Rio de Janeiro and São Paulo. In
the two latter ones, the emigrants returning to their states of birth played a
remarkable role.
The inter-state migrations lead to the need to specify their origin and
destination, especially on what concerns to São Paulo and Rio de Janeiro,
where the inter-state migrations were widely predominant (Table 6).
The paulista metropolis had the Northeast as its major source of
immigrants: approximately 73% of the total. That is, it nourished itself from
the inertia of the migratory trajectory, which since the middle of last century
had in that region its major source of manpower. Historically, Minas Gerais
was an important source of immigrants to the São Paulo glomerate, but,
during the quinquennium in question, its contribution was restricted to a
mere 10% of the inter-state flow. The fluminense metropolis presented a similar
situation: the Northeast was the origin of the great majority of its immigrants,
and Minas, with a much lower percentage, occupied the second position.
Table 6 – Origin of the inter-state immigrants whose destinations were the
selected metropolitan agglomerations, fixed date migrants, 1995/2000
Regions / Metropolitan agglomerations of destination
States of
origin Belo Rio de São Porto
Belém Fortaleza Recife Salvador Curitiba TOTAL
Horizonte Janeiro Paulo Alegre
North 7,423 10,766 3,397 1,796 6,131 13,225 14,532 5,008 1,816 64,092
Northern NE * 12,007 12,634 1,836 1,301 2,114 16,923 56,592 992 633 105,032
Center NE 4,257 11,592 19,142 9,774 5,042 99,491 239,389 3,479 2,412 394,576
Southern NE 689 3,239 4,603 4,913 15,907 28,203 216,153 2,610 1,325 277,641
Minas Gerais 739 1,414 1,666 2,005 0 28,415 71,883 3,639 1,465 111,227
Espírito Santo 231 319 427 905 8,966 11,930 6,572 679 440 30,468
Rio de Janeiro 4,936 5,591 7,142 7,844 9,041 0 23,894 3,883 3,120 65,450
São Paulo 3,304 16,272 16,306 12,111 21,833 30,575 0 33,801 7,892 142,095
Paraná 878 1,143 740 1,027 2,087 4,482 31,612 0 8,536 50,505
Extreme South 1,054 1,864 1,466 1,889 1,788 9,024 18,181 31,817 14,281 81,365
Center West 1,951 5,244 2,513 2,295 6,707 12,409 24,312 9,662 2,689 67,781
Total 37,468 70,078 59,238 45,860 79,615 254,677 703,119 95,570 44,607 1,390,232
Source: IBGE , Demographic census of 2000.
* Northern Northeast: Maranhão and Piauí; Center Northeast: Ceará, Rio Grande do Norte, Paraíba,
Pernambuco and Alagoas; Southern Northeast: Sergipe and Bahia; Extreme South: Santa Catarina
and Rio Grande do Sul.
ESTUDOS AVANÇADOS 20 (57), 2006 231Photo Folha Imagem/Jefferson Coppola - 21.1.2004
The homeless Maria Vieira on the street with her family after
being evicted from the Almeida building, in São Paulo.
Table 7 – Destination of the inter-state immigrants bound to the selected
metropolitan agglomerations, fixed date migrants, 1995/2000
Regions / Metropolitan agglomerations of destination
States of Belo Rio de São Porto
origin Belém Fortaleza Recife Salvador Curitiba TOTAL
Horizonte Janeiro Paulo Alegre
North 17,073 6,986 3,658 1,611 3,762 13,910 14,988 3,497 1,789 67,277
Northern
6,368 6,124 1,944 636 817 5,607 25,872 353 477 48,199
NE *
Center NE 6,943 7,816 21,200 8,247 3,166 51,292 139,686 2,094 2,514 242,960
Southern
1,186 2,465 6,294 5,468 4,377 16,375 88,833 1,110 1,572 127,680
NE
Minas
1,684 1,278 1,753 3,397 0 36,835 113,578 2,752 978 162,256
Gerais
Espírito
409 348 715 1,785 7,548 20,757 8,185 460 190 40,397
Santo
Rio de
5,992 6,131 9,647 8,797 6,909 0 27,137 2,686 3,114 70,413
Janeiro
São Paulo 5,898 12,809 29,566 24,553 16,201 33,381 0 15,980 6,947 145,334
Paraná 966 620 890 1,019 1,935 5,889 62,798 0 6,798 80,914
Extreme
1,308 1,509 1,749 1,510 1,480 11,986 26,022 25,500 18,862 89,925
South
Center West 5,936 6,114 4,434 4,378 7,576 18,333 37,328 6,591 3,716 94,406
Total 53,764 52,200 81,851 61,401 53,772 214,365 544,426 61,022 46,958 1,169,761
Source: IBGE , Demographic census of 2000.
Considering the destination of the emigrants from the metropolitan
agglomerates in the 1995-2000 period, taking, particularly, as a reference the
metropolitan agglomerates of São Paulo and Rio de Janeiro, we can observe
an extremely interesting situation. The destination of the emigrants from
232 ESTUDOS AVANÇADOS 20 (57), 2006those agglomerates, in its majority, gets mixed up with their immigrants’
origin. The Northeast and Minas Gerais were the preferred destinations. Such
phenomenon expresses, undoubtedly, a great rate of people returning to the
states where they were born.
Table 8 – Metropolitan agglomerate of São Paulo, migrants, migratory balance
and emigrants returned to their states or regions of birth, fixed date, 2000
Metropolitan agglomerate of São Paulo
Regions / States
Origin / Destination Emigrants Returned
Immigrants Balance 2/1 (%)
(1) (2)
North 14,532 14,988 -456 2,498 16.67
Northern NE * 56,592 25,872 30,720 17,049 65.90
Center NE 239,389 139,686 99,703 87,539 62.67
Southern NE 216,153 88,833 127,320 54,691 61.57
Minas Gerais 71,883 113,578 -41,695 47,700 42.00
Espírito Santo 6,572 8,185 -1,613 1,960 23.95
Rio de Janeiro 23,894 27,137 -3,243 6,700 24.69
Paraná 31,612 62,798 -31,186 18,244 29.05
Extreme South 18,181 26,022 -7,841 6,539 25.13
Center West 24,312 37,328 -13,016 4,759 12.75
Total 703,119 544,426 158,693 247,679 45.49
Source: IBGE , Demographic census of 2000.
In order to make clearer the importance of this phenomenon, namely
the return emigration, we should take into consideration the metropolitan
agglomerate of São Paulo, where it is more relevant. Of the total of inter-
state emigrants of the 1995-2000 quinquennium, 46% had been born in the
states of destination. Among those bound to the Northeast, that percentage
surpasses 60%; the second place belongs to those that moved to Minas Gerais.
Those two regions, Northeast and Minas, were also the ones that received
the greatest number of migrants from São Paulo. Such situation, analytically
suggestive, is consistent with the migratory tradition of the metropolitan
glomerate of São Paulo: the greatest number of returning migrants is bound
to the very regions from where, in the past, the greatest number of immigrants
had come (Table 8).
Conclusions
This return migration is the expression of the new reality of the
metropolises and migrations. The Brazilian society, on the second half of the
20th century, was structurally marked by its accelerated process of urbanization.
The irreversible construction of the urban hegemony does not depend on the
ESTUDOS AVANÇADOS 20 (57), 2006 233Photo Folha Imagem/Rogério Assis - 27.2.1977
Maria Cândido waits to be moved after being dislodged from
the Esqueleto shantytown, in São Paulo.
variation of the demographic stocks of its great agglomerates. The Brazilian
society is already urban, as well as its big metropolises will continue playing
their hegemonic role, despite the decline in their rates of population growth.
The decrease in the relative participation of the big metropolitan
agglomerates in the total of the urban population, resulting from the
redirection of a portion of the internal migrations, after 1980, to the non-
metropolitan median cities, opens perspectives for new territorialities, social
spaces that have been integrated to the new migratory pattern of the Brazilian
society.
The great demographic deflation of the capitals, nucleuses of the major
metropolitan glomerates, is partly due to the marked decline in the fertility
rates, but, in a greater proportion, to the decrease in their migratory balances
– which, by the way, tend to become negative. Even the outskirts, which
presented a very significant growth on the seventies and eighties – a growth
that still remains high, although in decline -, suffer the impact of the reduction
in the fertility and the migratory balances.
There seems to be a paradox, as in São Paulo, between the ongoing
process of population decentralization and the inertia of the migratory
trajectories that continue to feed its significant number of immigrants. The big
issue is that the flexibility of the migratory trajectories, especially those with
their origin in the Northeast, complies with the strict limits determined by the
regional and social disequilibriums of the present-day Brazilian society.
234 ESTUDOS AVANÇADOS 20 (57), 2006Photo Folha Imagem/Luiz Carlos Murauskas - 9.5.1996
Removal of 1,800 families from the Jardim Alzira Franco shantytown,
in Santo André (SP).
In spite of that, the Metropolitan Region of São Paulo stands out for its
negative migratory balance, caused by the ongoing population decentralization
towards the paulista countryside.
The inter-state immigration is nearly totally compensated by the
emigration, mainly the return emigration. Thus, the inter-state migratory
balance, although being fed by the inertia of the Northeastern migratory
trajectory, is not enough to compensate the population loss to the State
countryside any longer.
The great urban crisis, with its lack of economic and social
opportunities, with the social conflicts that are inherent to the social and
spatial segregation, eventually leads the emigrants, bound to the countryside
or to other states, to leave more the capital than the metropolitan outskirt.
The capitals’ ability of migratory retention has been significantly decreasing
and its recuperation is a distant possibility.
The present-day Brazil has made of the internal migration a risky
activity. It used to be an alternative for the social mobility; now it is a
mere alternative for survival. The potential emigrants exist in abundance;
however, there are no social and economic alternatives that can make of their
displacement a reason, at least, for hope.
ESTUDOS AVANÇADOS 20 (57), 2006 235Bibliography BASSANEZI, M.S. International immigrations in Brazil: a historical overview. In: PATARRA, N. (Coord.) International emigration and immigration in the present-day Brazil. Campinas: FNUAP, 1995. BRITO, F.; SOUZA, J. Urban expansion in the big metropolises: the meaning of the inter-metropolitan migrations and of the pendular mobility in the reproduction of poverty. Revista Perspectiva, Fundação Seade, Jan. 2006. BRITO, F.; CARVALHO, J. A. Are we a country of youngsters? In: ALBUQUERQUE, E. S. (Org.) What sort of country is this? Rio de Janeiro: Globo, 2006. CARVALHO, J. A.; GARCIA, A. Decennial and quinquennial estimates of migratory balances and net migration rates in Brazil between 1960 and 1990 and estimates of international migrations along the 1985/1990 period. Cedeplar, 2003. Available in: . IPEA, IBGE, NESUR-IE-UNICAMP. Characteristics and trends of the urban network in Brazil. Campinas: Unicamp, Institute of Economics, 1999. v.I. BRITO, F.; HORTA, C. The recent urbanization in Brazil and the metropolitan agglomerations. Cedeplar – IUSSP, 2002. ABSTRACT – THE AIM of this article is the analysis of the Brazilian urbanization process during the second half of the 20th century. For this purpose it is important to take note that the 1970 Demographic Census indicated that the urban population had surpassed the rural population for the first time. The rapid contemporary urbanization due to intense internal migration concentrated the urban population in the larger Brazilian cities and metropolitan areas. During the last two decades, however, the growth rates of the larger cities declined due to lower fertility rates and, more importantly, the decreasing number of immigrants. Indeed, the metropolitan area of São Paulo, for example, presented a negative net migration for the 1995-2000 period. Although internal migration trends do not point to a process of “hyper- metropolitanization”, it must be taken into account that, as of 2000, 40% of the country’s urban population still inhabited the larger metropolitan areas. KEYWORDS: Migration, Urbanization, Metropolises. Fausto Brito is a professor and researcher in the Demography Department and Cedeplar, Federal University of Minas Gerais (UFMG). @ – fbrito@cedeplar.ufmg.br Translated by Arlete Dialetachi. The original in Portuguese is available at http:// www.scielo.br/scielo.php?script=sci_issuetoc&pid=0103-401420060002&lng=pt&nr m=iso. Received on 05.24.2006 and accepted on 05.31.2006. 236 ESTUDOS AVANÇADOS 20 (57), 2006
You can also read