2019 Ambient Air Monitoring Network Plan - June 28, 2019 - Washoe County
←
→
Page content transcription
If your browser does not render page correctly, please read the page content below
2019 Ambient Air Monitoring
      Network Plan

        June 28, 2019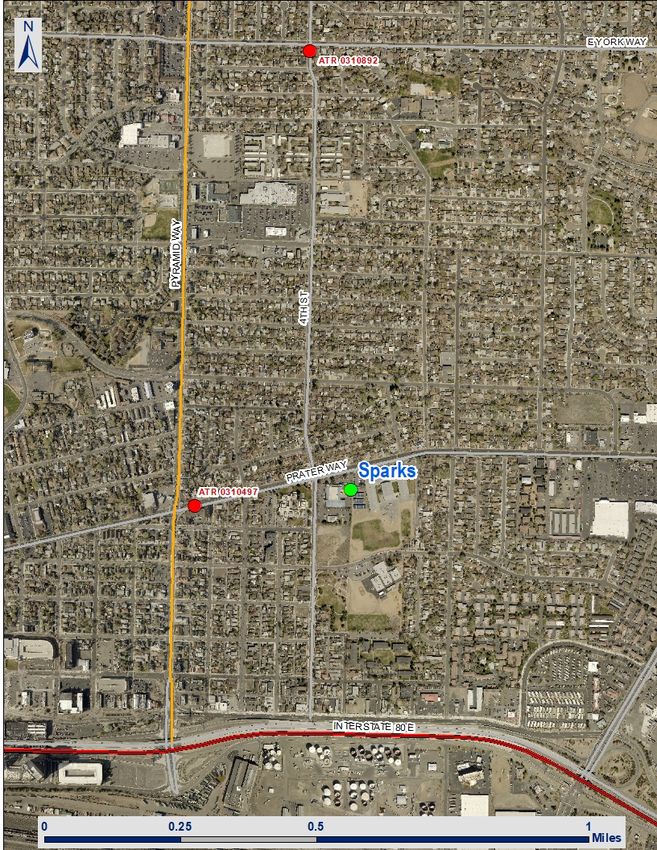
VISION
                                      A healthy community

                                          MISSION
  To protect and enhance the well-being and quality of life for all in Washoe County.

2019 Ambient Air Monitoring Network Plan, June 28, 2019                                 i
Table of Contents

Introduction .................................................................................................................1
       Purpose .............................................................................................................1
       Public Inspection Process ...................................................................................1
       Agency Contacts ................................................................................................1
Overview of Washoe County Health District Network Operation ....................................2
       Network Design .................................................................................................2
       Minimum Monitoring Requirements ...................................................................4
       Collocation Requirements ..................................................................................8
       Network Modifications Completed in 2018 .........................................................9
       Additional Changes Completed in 2018 .............................................................9
       Network Modifications Proposed for 2019-2020...............................................10
       Additional Changes Proposed for 2019-2020 ...................................................10
       PM2.5 Monitoring Network Modifications Proposed for 2019-2020 .....................11
       Data Submission Requirements ........................................................................11
Overview of Tribal Network Operations ......................................................................12
       Network Design ...............................................................................................12
Washoe County Health District Detailed Site Information ............................................15
       Incline..............................................................................................................15
       Lemmon Valley ................................................................................................18
       Reno 3 .............................................................................................................21
       South Reno ......................................................................................................28
       Spanish Springs ...............................................................................................31
       Sparks .............................................................................................................35
       Toll ..................................................................................................................39

Tables ......................................................................................................................... iii
Figures ........................................................................................................................ iii
Acronyms and Abbreviations ....................................................................................... iv

Appendices

Appendix A – Public Inspection Plan
Appendix B – Network Modification Request/Approval

2019 Ambient Air Monitoring Network Plan, June 28, 2019                                                                                ii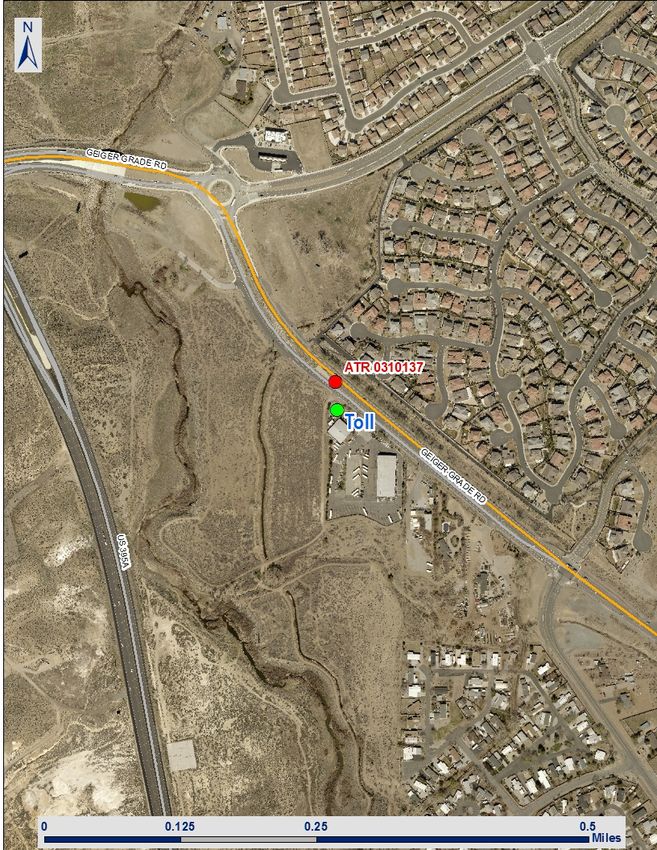
Tables

   1. Ambient Air Monitoring Sites and Parameters Monitored ....................................3
   2. Minimum Monitoring Requirements for O3 .........................................................4
   3. Minimum Monitoring Requirements for PM2.5 SLAMS ...........................................4
   4. Minimum Monitoring Requirements for Continuous PM2.5 Monitors .....................5
   5. Minimum Monitoring Requirements for PM10 ......................................................5
   6. Minimum Monitoring Requirements for NO2 .......................................................5
   7. Minimum Monitoring Requirements for SO2 ........................................................6
   8. Minimum Monitoring Requirements for CO ........................................................6
   9. Source-Oriented Pb Monitoring ..........................................................................7
   10. Near-Road NO2, PM2.5, and CO Monitors ..............................................................7
   11. Collocation of Manual PM2.5, PM10, and non-NCore Pb Monitors ...........................8
   12. Collocation of Automated FEM PM2.5 Monitors .....................................................8
   13. Tribal Ambient Air Monitoring Sites and Parameters Monitored ........................12

Figures

   1. Washoe County Health District - AQMD Ambient Air Monitoring Sites .................2
   2. Reno-Sparks Indian Colony ...............................................................................13
   3. Pyramid Lake Paiute Tribe ................................................................................14
   4. Incline Monitoring Station ................................................................................15
   5. Incline Monitoring Site Vicinity Aerial ...............................................................16
   6. Lemmon Valley Monitoring Station ...................................................................18
   7. Lemmon Valley Monitoring Site Vicinity Aerial ..................................................19
   8. Reno3 Monitoring Station.................................................................................21
   9. Reno3 Monitoring Site Vicinity Aerial................................................................22
   10. South Reno Monitoring Station .........................................................................28
   11. South Reno Monitoring Site Vicinity Aerial ........................................................29
   12. Spanish Springs Monitoring Station ..................................................................31
   13. Spanish Springs Monitoring Site Vicinity Aerial .................................................32
   14. Sparks Monitoring Station ................................................................................35
   15. Sparks Monitoring Site Vicinity Aerial ...............................................................36
   16. Toll Monitoring Station ....................................................................................39
   17. Toll Monitoring Site Vicinity Aerial....................................................................40

2019 Ambient Air Monitoring Network Plan, June 28, 2019                                                                 iii

Acronyms and Abbreviations

AADT       Annual Average Daily Traffic Count
AQMD       Washoe County Health District - Air Quality Management Division
AQS        Air Quality System
ARM        Approved Regional Method
ATR        Automatic Traffic Recorder
BAM        Beta Attenuation Monitor
CARB       California Air Resources Board
CBSA       Core-Based Statistical Area
cc/min     Cubic centimeter per minute
CFR        Code of Federal Regulations
CMSA       Consolidated Metropolitan Statistical Area
CO         Carbon Monoxide
CSA        Combined Statistical Area
EBAM       Met One Environmental Beta Attenuation Monitor
EI         Emissions Inventory
EPA        U.S. Environmental Protection Agency
ESC        Environmental Systems Corporation
FEM        Federal Equivalent Method
FRM        Federal Reference Method
GFC        Gas Filter Correlation
MSA        Metropolitan Statistical Area
NAAQS      National Ambient Air Quality Standards
NCore      National Core multipollutant monitoring station
NDOT       Nevada Department of Transportation
NO         Nitric Oxide
NO2        Nitrogen Dioxide
NOx        Oxides of Nitrogen
NOy        Reactive Oxides of Nitrogen
O3         Ozone
PM2.5      Particulate Matter less than or equal to 2.5 microns in aerodynamic diameter
PM10       Particulate Matter less than or equal to 10 microns in aerodynamic diameter
PMcoarse   PM10 minus PM2.5
ppb        parts per billion
ppm        parts per million
PWEI       Population Weighted Emissions Index
SASS       Speciation Air Sampling System
SIP        State Implementation Plan
SLAMS      State and Local Air Monitoring Station
SO2        Sulfur Dioxide
SPM        Special Purpose Monitoring
SR         State Route
STN        Speciation Trends Network
TAPI       Teledyne Advanced Pollution Instrumentation, Inc.

2019 Ambient Air Monitoring Network Plan, June 28, 2019                                   iv
Introduction

Purpose

The U.S. Environmental Protection Agency (EPA) finalized amendments to the ambient air
monitoring regulations on October 17, 2006. 1 The amendments revise the technical
requirements for certain types of ambient air monitoring sites, add provisions for monitoring
of PMcoarse, and reduce certain monitoring requirements for criteria pollutants. Monitoring
agencies are required to submit annual monitoring network plans, conduct network
assessments every five years, perform quality assurance activities, and in certain instances,
have NCore sites established by January 1, 2011.

This plan was prepared and submitted as part of the fulfillment to these regulations. It
represents the Washoe County Health District - Air Quality Management Division’s (AQMD)
ambient air monitoring program activities completed in 2018 and proposed network
modifications for 2019-2020.

Public Inspection Process

This monitoring network plan was available for public inspection from May 22 to June 22,
2019 at the AQMD website (OurCleanAir.com). A hardcopy of the plan was also available at
the AQMD office. See Appendix A for AQMD’s Public Inspection Plan.

Agency Contacts

For information or questions regarding the 2018 Ambient Air Monitoring Network Plan,
please contact the following individuals of the AQMD.

Charlene Albee, Division Director
(775) 784-7211, or calbee@washoecounty.us

Daniel Inouye, Branch Chief
(775) 784-7214, or dinouye@washoecounty.us

Craig Petersen, Senior Air Quality Specialist
(775) 784-7233, or cpetersen@washoecounty.us

1
    71 FR 61236-61328.
2019 Ambient Air Monitoring Network Plan, June 28, 2019                                         1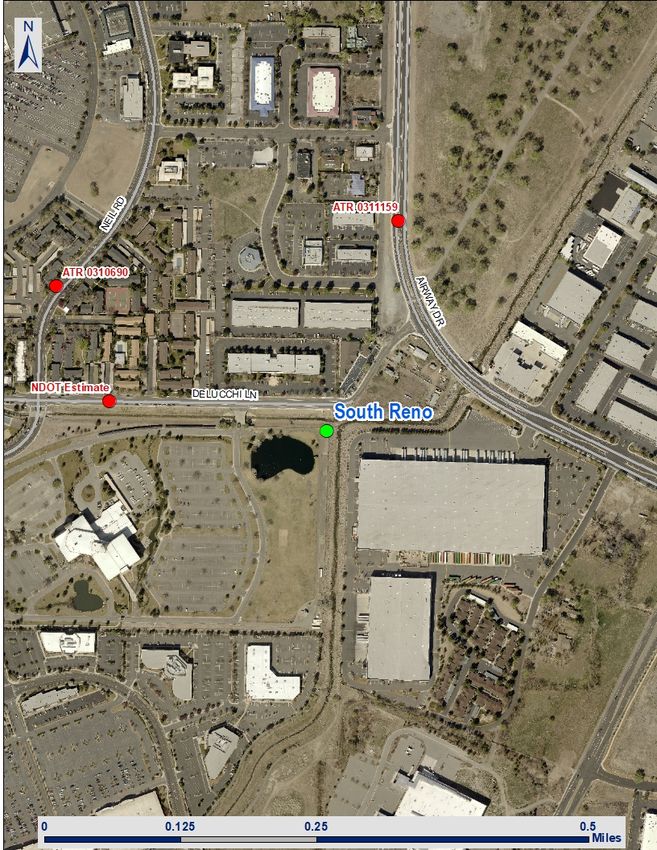
Overview of Washoe County Health District Network Operation

Network Design

The AQMD operated seven (7) ambient air monitoring sites in 2018 (Figure 1). The blue
boundary delineates Hydrographic Area 87 (HA 87) as defined by the State of Nevada Division
of Water Resources. This area was designated as “serious” non-attainment for the 24-hour
PM10 NAAQS until it was redesignated to “Attainment/Maintenance” effective January 7, 2016. 2
Washoe County is classified as “attainment” or “unclassifiable/attainment” for all other
pollutants and averaging times. Table 1 lists the parameters monitored in 2018 sorted by
network type and site.

                                                Figure 1
                   Washoe County Health District - AQMD Ambient Air Monitoring Sites

2
    80 FR 76232 (December 8, 2015).
2019 Ambient Air Monitoring Network Plan, June 28, 2019                                         2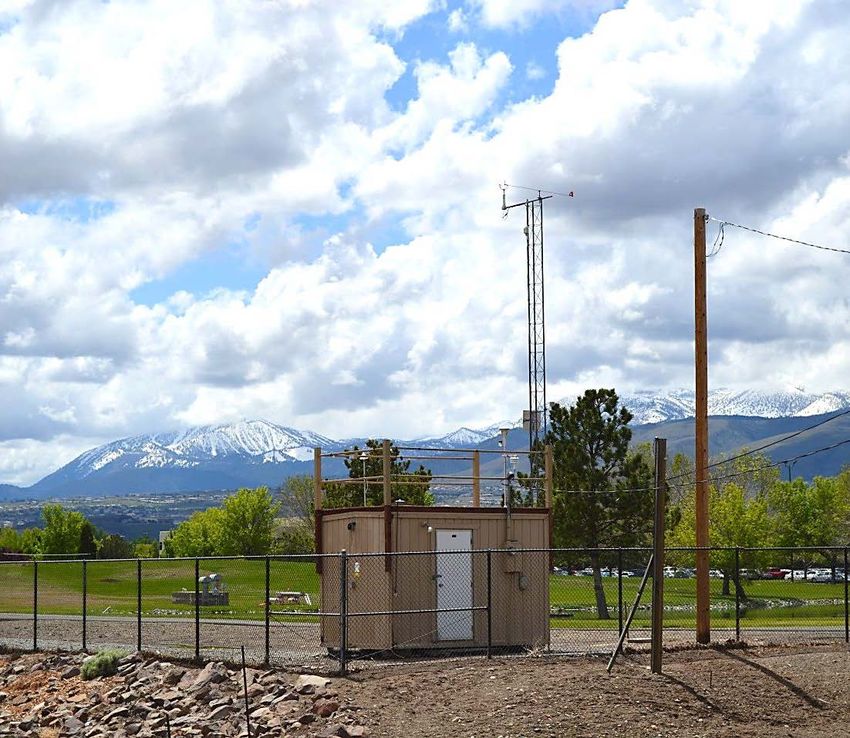
Table 1
Ambient Air Monitoring Sites and Parameters Monitored
Network Type
Site
PMcoarse (continuous)
PM2.5 (continuous)
PM10 (continuous)
PM2.5 Speciation
PMcoarse (manual)
PM2.5 (manual)
PM10 (manual)
Meteorology
Trace SO2
Trace NO
Trace CO
NOy-NO
NOy
NO2
NOx
NO
CO
SLAMS
O3
Incline
Lemmon Valley
South Reno
Spanish
Springs
Sparks
Toll
NCore 3
Reno3
STN
Reno3
SPM
Notes: Meteorology for the NCore network includes ambient temperature, wind speed,
wind direction, and relative humidity. The PM10 manual method monitor at NCore is for
PMcoarse calculation only and is not submitted to AQS for data to be used in comparison
to the NAAQS.
3
NCore monitoring began December 2010.
2019 Ambient Air Monitoring Network Plan, June 28, 2019 3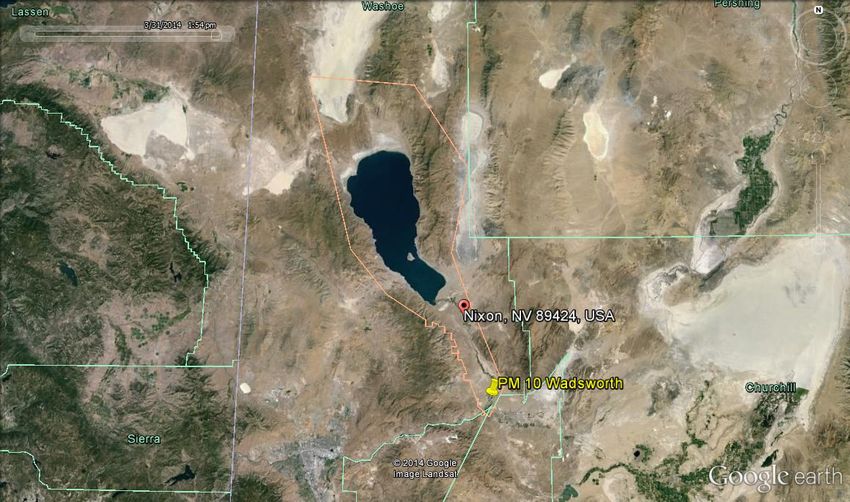
Minimum Monitoring Requirements

Except where otherwise noted, each monitor in AQMD’s ambient air monitoring network
meets the minimum monitoring requirements for all criteria pollutants pursuant to 40 CFR
58, Appendices A, B, C, D, and E, where applicable. Tables 2 through 10 provide pollutant
specific monitoring requirements. Additional pollutant specific data may be found in the
“Washoe County, Nevada, Air Quality Trends Report, 2009-2018”. The 2018 population data
are from the Nevada State Demographer’s Office. 4

                                                 Table 2
                                   Minimum Monitoring Requirements for O3
                                                   8-hour Design Value
                                                       (2016-2018)                          Number of Sites
                                                                                Minimum
     MSA          County        Population         ppm           Site (ID)      Required          Active         Needed
                                                                 Lemmon
                                                                   Valley
                  Washoe         460,237                          (2009),
    Reno-
                  Storey          4,227           0.071           Reno 3             2              7               0
    Sparks
                   Total         464,464                          (0016),
                                                                  Sparks
                                                                   (1005)
          Monitors required for SIP or Maintenance Plan: 2

Title 40 CFR 58, Appendix D, Section 4.1 requires O3 monitoring in MSAs with populations
above 350,000 people. Monitors are also required in MSAs with lower populations if
measured O3 values within that MSA are within 85% of the NAAQS.

                                            Table 3
                 Minimum Monitoring Requirements for PM2.5 SLAMS (FRM/FEM/ARM)
                                                        Design Value
                                                        (2016-2018)                         Number of SLAMS Sites
                                       Annual       Annual        Daily        Daily     Minimum
    MSA      County    Population      (µg/m3)      Site (ID)   (µg/m3)      Site (ID)   Required   Active   Needed
                                                                             Reno 3
             Washoe      460,237
Reno-                                               Sparks                   (0016),
             Storey       4,227          7.6                       25                         0            3            0
Sparks                                              (1005)                   Sparks
              Total      464,464
                                                                              (1005)
          Monitors required for: SIP or Maintenance Plan: 0; NCore: 1

Title 40 CFR 58, Appendix D, Section 4.7.1 requires PM2.5 monitoring in MSAs with
populations above 500,000 people and in MSAs with lower populations if measured PM2.5
values for an MSA are within 85% of the NAAQS.

4
 Nevada State Demographer, “Governor Certified Population Estimates of Nevada’s Counties, Cities and Towns 2000 to 2018”,
2018.
2019 Ambient Air Monitoring Network Plan, June 28, 2019                                                                     4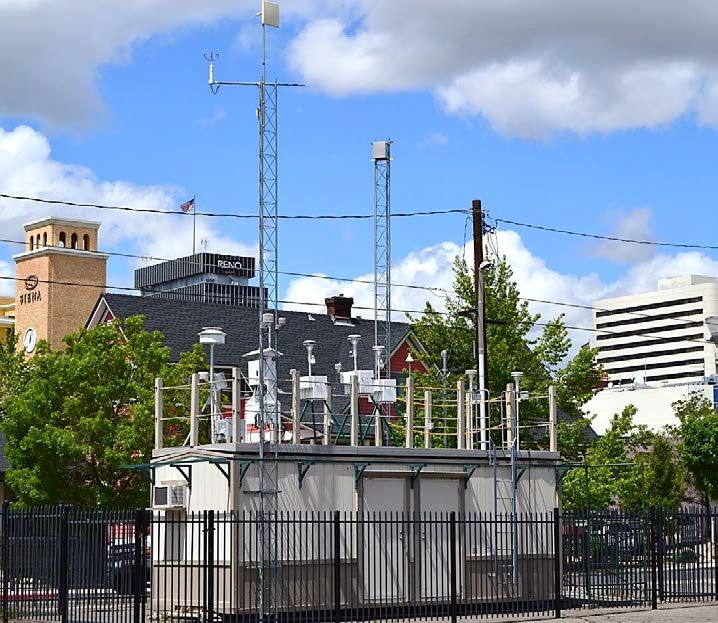
Table 4
       Minimum Monitoring Requirements for Continuous PM2.5 Monitors (FEM/ARM/non-FEM)
                                                               Design Value
                                                               (2016-2018)                       Number of Continuous Monitors
                                           Annual          Annual        Daily       Daily       Minimum
    MSA        County      Population      (µg/m3)         Site (ID)   (µg/m3)     Site (ID)      Required   Active   Needed
                                                                                   Reno 3
              Washoe        460,237
Reno-                                                      Sparks                  (0016),
              Storey         4,227           7.6                         25                          0           3        0
Sparks                                                     (1005)                  Sparks
               Total        464,464
                                                                                    (1005)
             Monitors required for: SIP or Maintenance Plan: 0; NCore: 1

Title 40 CFR 58, Appendix D, Section 4.7.2 requires continuous PM2.5 monitors equal to at
least one-half (round up) of the minimum sites listed in Table D-5 of Title 40 CFR 58,
Appendix D.

                                                    Table 5
                                    Minimum Monitoring Requirements for PM10
                                                   Maximum Concentration
                                                        (2016-2018)                                  Number of Sites
                                                                                          Minimum
     MSA        County       Population            µg/m3               Site (ID)          Required        Active       Needed
                Washoe        460,237
    Reno-
                Storey         4,227                 124             Toll (0025)               3-4           4           0
    Sparks
                 Total        464,464
             Monitors required for SIP or Maintenance Plan: 4

Title 40 CFR 58, Appendix D, Section 4.6 specifies PM10 monitoring requirements in MSAs
based on population and design values. The number of PM10 stations in areas where MSA
populations are from 250,000-500,000 must be in the range of 0 to 4 stations, depending on
ambient concentration levels.

                                                   Table 6
                                    Minimum Monitoring Requirements for NO2
                                             Max                                   Number of Monitors
                                           AADT                         Active      Near-     Required        Active    Area-
                                           counts      Required         Near-       Road     Area-Wide        Area-     Wide
    CBSA      County     Population         (year)     Near-Road        Road       Needed                     Wide     Needed
              Washoe      460,237
Reno,                                     182,000 5
              Storey       4,227                              0           0           0              0           1        0
 NV                                        (2018)
               Total      464,464
             Monitors required for: SIP or Maintenance Plan: 0; NCore: 1
             Monitors required for PAMS: 0
             EPA Regional Administrator-required monitors per 40 CFR 58, App. D 4.3.4: 0

Title 40 CFR 58, Appendix D, Section 4.3.2 requires one near-road NO2 monitoring station in
each CBSA with populations over 1,000,000 people. Likewise, Title 40 CFR 58, Appendix D,
Section 4.3.3 requires one area-wide NO2 monitoring station in each CBSA with populations
over 1,000,000 people. Based on the 2016 population data from the Nevada State
Demographer’s Office, the Reno, NV CBSA does not require a near-road or area-wide NO2
monitoring station.

5
    NDOT ATR 0310634 between the Plumb-Villanova Interchange 'Exit 65' & Mill St Interchange 'Exit 66'.
2019 Ambient Air Monitoring Network Plan, June 28, 2019                                                                         5
Table 7
Minimum Monitoring Requirements for SO2
Data Number of Monitors
PWEI Requirements
(Million Rule Source(s)
Total SO2 persons- using Minimum
CBSA County Population (tons/year) tons/year) Monitoring Required Active Needed
Washoe 460,237
Reno,
Storey 4,227 548.8 6 254.9 n/a 0 1 0
NV
Total 464,464
Monitors required for SIP or Maintenance Plan: 0; NCore: 1
EPA Regional Administrator-required monitors per 40 CFR 58, App. D 4.4.3: 0
Title 40 CFR 58, Appendix D, Section 4.4.2 requires an SO2 monitoring network based on a
calculated population weighted emissions index (PWEI). This index is calculated by
multiplying the population of a CBSA with the National Emission Inventory (NEI) data for
counties within that CBSA. The calculated value is then divided by one million in order to
obtain the PWEI value. PWEI monitoring requirements are as follows: 1) one monitor in CBSAs
with a PWEI value greater than 5,000, 2) two monitors in CBSAs with a PWEI value greater than
100,000, and 3) three monitors in CBSAs with a PWEI value greater than 1,000,000. As shown
in Table 8, AQMD used 2017 population data from the Nevada State Demographer’s Office
and 2014 National Emissions Inventory data to determine that no additional SO2 monitoring is
required.
Table 8
Minimum Monitoring Requirements for CO
Number of Monitors
Required Near-
CBSA County Population Road Active Near-Road Needed
Washoe 460,237
Reno, NV Storey 4,227 0 0 0
Total 464,464
Monitors required for: SIP or Maintenance Plan: 0; NCore: 1
EPA Regional Administrator-required monitors per 40 CFR 58, App. D 4.2.2: 0
Title 40 CFR 58, Appendix D, Section 3.0 requires high sensitivity CO monitors at NCore sites.
Title 40 CFR 58, Appendix D, Section 4.2 requires one CO monitor to operate collocated with
one required near-road NO2 monitor in CBSAs having populations over 1,000,000 people.
Based on the 2016 population data from the Nevada State Demographer’s Office, the Reno,
NV CBSA does not require a CO monitor collocated with a near-road NO2 monitor.
6
U.S.EPA, 2014 National Emissions Inventory (NEI) Data
2019 Ambient Air Monitoring Network Plan, June 28, 2019 6Table 9
Source-Oriented Pb Monitoring
Emission Design Number of Monitors
Pb Inventory Max 3-Month Value Date
Emissions Source & Design Value (3rd Month, Minimum
Source Name Address (tons/year) Data Year (µg/m3) Year) Required Active Needed
4895 Texas
Reno-Stead
Ave 0.17 2014 NEI n/a n/a 0 0 0
Airport
Reno, NV
Reno-Tahoe 2001 E
International Plumb Lane 0.10 2014 NEI n/a n/a 0 0 0
Airport Reno, NV
Monitors required for: SIP or Maintenance Plan: 0
EPA Regional Administrator-required monitors per 40 CFR 58, App. D 4.5(c): 0
Title 40 CFR 58, Appendix D, Section 4.5(a) requires one source-oriented SLAMS site located
to measure the maximum Pb concentration in ambient air resulting from each non-airport Pb
source which emits 0.50 or more tons per year and from each airport which emits 1.0 or
more tons per year based on the most recent National Emission Inventory. All non-airport
sources of Pb within the CBSA emit less than 0.5 tons per year and all airport sources within
the CBSA emit less than 1.0 tons per year, according to the 2014 NEI. Table 10 includes the
two largest sources of Pb emissions in the Reno, NV CBSA.
Table 10
Near-Road NO2, PM2.5, and CO Monitors
Number of Monitors
Max
AADT
Population Counts Required Active Required Active Required Active Additional
CBSA (year) (year) NO2 NO2 PM2.5 PM2.5 CO CO Needed
Reno, 464,464 182,000 7
0 0 0 0 0 0 0
NV (2018) (2018)
Title 40 CFR 58.13 and Appendix D to Title 40 CFR 58, Sections 4.2, 4.3, and 4.7 require one
near-road CO monitor to operate collocated with one near-road NO2 monitor in CBSAs having
a population of 1,000,000 or more persons. An additional NO2 monitor is required in CBSAs
with a population of 2,500,000 or more persons.
7
NDOT ATR 0310634 between the Plumb-Villanova Interchange 'Exit 65' & Mill St Interchange 'Exit 66'.
2019 Ambient Air Monitoring Network Plan, June 28, 2019 7Collocation Requirements
Title 40 CFR 58, Appendix A, Section 3 describes the number of collocated monitors required
for PM2.5, PM10, and Pb networks at the Primary Quality Assurance Organization (PQAO) level.
Tables 12 and 13 display how AQMD is assessing and meeting these collocation
requirements.
Table 11
Collocation of Manual PM2.5, PM10, and non-NCore Pb Monitors
Number of Collocated Monitors
Method Code Number of Primary Monitors Required Active
125 0 0 0
Title 40 CFR 58, Appendix A, Section 3.3.1 requires 15 percent (at least 1) of the manual
method samplers be collocated. Being that AQMD only runs one manual method sampler for
the calculation of PM10-2.5 at the Reno 3 NCore station, and all of the Primary PM10 monitors are
continuous methods, there is no collocation requirement.
Table 12
Collocation of Automated FEM PM2.5 Monitors
Number of Number of Active Number of Active Collocated FEM
Method Primary Number of Required Collocated FRM Monitors (same method
Code Monitors Collocated Monitors Monitors designation as primary)
170 3 1 1 0
Title 40 CFR 58, Appendix A, Section 3.2.5 requires 15 percent (at least 1) of the monitors be
collocated. The first collocated monitor must be a designated FRM monitor. AQMD meets
this requirement by having three Primary PM2.5 FEM monitors with one at the Reno 3
monitoring station collocated with a PM2.5 FRM sampler.
2019 Ambient Air Monitoring Network Plan, June 28, 2019 8Network Modifications Completed in 2018
SLAMS:
All pollutants (Spanish Springs)
• Convert PM10, PM2.5, PM10-2.5, and O3 monitors from a SPM to a SLAMS beginning July 1,
2018.
NCore:
• No modifications completed.
Speciation Trends:
• No modifications completed.
SPM:
• No modifications completed.
Additional Changes Completed in 2018
SLAMS:
• No changes completed.
NCore:
• No changes completed.
Speciation Trends:
• No changes completed.
SPM:
• No changes completed.
2019 Ambient Air Monitoring Network Plan, June 28, 2019 9Network Modifications Proposed for 2019-2020
SLAMS:
• No modifications proposed.
NCore:
All pollutants and meteorology (Reno 3)
• Relocate the Reno 3 NCore monitoring station from its current location to a new
location at Libby Booth Elementary School. A formal request stating this proposal will
be submitted prior to any modifications to follow the 40 CFR 58.14 criteria.
Speciation Trends:
• Relocate the Reno 3 NCore monitoring station from its current location to a new
location at Libby Booth Elementary School. A formal request stating this proposal will
be submitted prior to any modifications to follow the 40 CFR 58.14 criteria.
SPM:
Meteorology (Spanish Springs)
• Complete meteorological tower installation and begin monitoring wind speed, wind
direction, and ambient temperature beginning January 1, 2019.
All pollutants and meteorology (West Reno/Verdi)
• Begin monitoring PM10, PM2.5, PM10-2.5, O3, and meteorology at a new site in West
Reno/Verdi. A formal request stating this proposal will be submitted prior to any
modifications to follow the 40 CFR 58.14 criteria.
Additional Changes Proposed for 2019-2020
SLAMS:
All parameters (Incline, Lemmon Valley, South Reno, Spanish Springs, Sparks, and Toll)
• Replace all ESC 8832 Data Loggers with Agilaire 8872 Site Node Data Loggers as part
of ten-year replacement program.
Meteorology (South Reno, Sparks, and Toll)
• Replace all YSI 700 ambient temperature sensors with Met One 063-1 ambient
temperature sensors as part of ten-year replacement program.
CO (Sparks)
• Program data loggers/calibrators to run nightly automatic zero and span checks.
O3 (Incline, Lemmon Valley, South Reno, Spanish Springs, Sparks, and Toll)
• Program data loggers/calibrators to run nightly automatic zero and span checks.
NCore:
All parameters (Reno 3)
• Replace ESC 8832 Data Logger with Agilaire 8872 Site Node Data Logger as part of ten-
year replacement program.
Meteorology (Reno 3)
• Replace YSI 700 ambient temperature sensor with Met One 063-1 ambient temperature
sensor as part of ten-year replacement program.
• Install a new Met One 595 solar radiation sensor.
Speciation Trends:
2019 Ambient Air Monitoring Network Plan, June 28, 2019 10• No changes proposed.
SPM:
• No changes proposed.
PM2.5 Monitoring Network Modifications Proposed for 2019-2020
SLAMS:
PM2.5 (Toll)
• Convert PM2.5 and PM10-2.5 monitors from a SPM to a SLAMS beginning January 1, 2020.
A formal letter stating this proposal will be submitted prior to any modifications to
follow the 40 CFR 58.14 criteria.
NCore:
PM2.5 (Reno 3)
• Relocate the Reno 3 NCore monitoring station from its current location to a new
location at Libby Booth Elementary School. A formal request stating this proposal will
be submitted prior to any modifications to follow the 40 CFR 58.14 criteria.
Speciation Trends:
• Relocate the Reno 3 NCore monitoring station from its current location to a new
location in downtown Reno. A formal request stating this proposal will be submitted
prior to any modifications to follow the 40 CFR 58.14 criteria.
SPM:
PM2.5 (Toll)
• Begin monitoring PM2.5 and PM10-2.5 at the Toll monitoring station on January 1, 2019.
PM2.5 (West Reno/Verdi)
• Begin monitoring PM2.5 at new site in West Reno/Verdi. A formal request stating this
proposal will be submitted prior to any modifications to follow the 40 CFR 58.14
criteria.
Data Submission Requirements
Precision and Accuracy Reports for 2018 were submitted to AQS for the:
1st quarter in June 2018,
2nd quarter in September 2018,
3rd quarter in November 2018, and
4th quarter in February 2019.
Annual Data Certification for all data for 2018 was submitted to EPA on April 11, 2019.
2019 Ambient Air Monitoring Network Plan, June 28, 2019 11Overview of Tribal Network Operations
Network Design
Two tribes operate ambient air monitoring networks within the geographic boundaries of
Washoe County - The Reno-Sparks Indian Colony (RSIC) and Pyramid Lake Paiute Tribe (PLPT).
Table 13 summarizes the tribal sites and parameters monitored in 2018. Figure 2 shows the
location of tribal lands for the Reno-Sparks Indian Colony and Figure 3 is a map showing the
locations of the Pyramid Lake Paiute Tribes’ monitoring sites. For additional detailed site
information about the RSIC and PLPT monitoring networks including annual network plans,
refer to the following contact information.
Reno Sparks Indian Colony Pyramid Lake Paiute Tribe
Bhie-Cie (BC) N. Ledesma, MPH Tanda Roberts
Acting Environmental Manager Air Quality Specialist
Planning Department/ Environmental Department
Environmental Program P.O. Box 256
1937 Prosperity Street Nixon, NV 89424
Reno, NV 89502 (775) 574-0101 ext.18
(775) 785-1363, ext. 5407 troberts@plpt.nsn.us
bledesma@rsic.org http://plpt.nsn.us/index.html
http://www.rsic.org/
Table 13
Tribal Ambient Air Monitoring Sites and Parameters Monitored
Network
Site
Site ID
PMcoarse (continuous)
PM2.5 (continuous)
PM10 (continuous)
PM2.5 Speciation
PMcoarse (manual)
PM2.5 (manual)
PM10 (manual)
Meteorology
Trace SO2
Trace NO
Trace CO
NOy-NO
NOy
NO2
NOx
NO
CO
RSIC
O3
Hungry Valley
TT-653-2010
PLPT
WADSAQ
T-561-1026
2019 Ambient Air Monitoring Network Plan, June 28, 2019 12Figure 2
Reno-Sparks Indian Colony
2019 Ambient Air Monitoring Network Plan, June 28, 2019 13Figure 3
Pyramid Lake Paiute Tribe
Map 1 - Location of Pyramid Lake Paiute Tribe Air Quality Monitoring Site.
2019 Ambient Air Monitoring Network Plan, June 28, 2019 14Washoe County Health District Detailed Site Information
Incline
This site is located in a Washoe County office building at 855 Alder Avenue and is outside HA
87. It is located in a residential/commercial neighborhood. The AQMD had monitored PM10
(1993-2002) and CO (1993-2002) and currently monitors for O3. This site was temporarily
closed from December 2005 to May 2008 for remodeling. By multi-agency cooperative
agreement, the California Air Resources Board (CARB) monitored PM2.5 (1999-2002) and NO2
(1999-2002). Since May 2008, this site only monitors for O3.
Site Name: Incline
AQS ID: 32-031-2002
Geographical coordinates: 39o 15.025’N, 119o 57.404’W
Location: Inside northeast corner of Washoe County office building.
855 Alder Avenue
Street address:
Incline Village, NV 89451
County: Washoe
Distance to road: 57 meters to Tahoe Boulevard
9,600 AADT (2016-2018)
Traffic count: 8
(NDOT ATR 0310379 – SR28 (Tahoe Blvd), 450 feet south of Village Blvd)
Groundcover: Paved / Vegetated
Representative area: Reno-Sparks MSA
Figure 4
Incline Monitoring Station
8
Nevada Department of Transportation Traffic Information
2019 Ambient Air Monitoring Network Plan, June 28, 2019 15Figure 5
Incline Monitoring Site Vicinity Aerial
2019 Ambient Air Monitoring Network Plan, June 28, 2019 16Incline (continued)
Pollutant, POC O3, 1
Primary / QA Collocated / Other n/a
Parameter code 44201
Basic monitoring objective(s) NAAQS comparison
Population
Site type(s)
Exposure
Monitor type SLAMS
Network affiliation(s) n/a
Instrument manufacturer / model TAPI 400E
Method code 087
FRM / FEM / ARM / Other FEM
Collecting Agency WCHD - AQMD
Analytical Lab n/a
Reporting Agency WCHD - AQMD
Spatial scale Neighborhood
Monitoring start date June 1993
Current sampling frequency Continuous
Required sampling frequency n/a
Sampling season 01/01 – 12/31
Probe height 5.8 meters
Distance from supporting structure 2.5 meters
Distance from obstructions on roof n/a
Distance from obstructions not on
None
roof
Distance from trees 10.8 meters*
Distance to furnace or incinerator
6.3 meters
flue
Distance between collocated
n/a
monitors
For low volume PM instruments, is
n/a
any PM instrument within 1 meter?
For high volume PM instruments, is
any PM instrument within 2 n/a
meters?
Unrestricted airflow 360 degrees
Probe material Teflon
Residence time 8 seconds
Proposed modifications
None
within the next 18 months?
Is it suitable for comparison
n/a
against the annual PM2.5 NAAQS?
Frequency of flow rate verification
n/a
for manual samplers (PM)
Frequency of flow rate verification
n/a
for automated analyzers (PM)
Frequency of one-point QC check
Bi-weekly (3 point)
(gaseous)
03/20/18
Date of annual performance
06/20/18
evaluation (gaseous &
09/07/18
meteorological)
12/14/18
Date of two semi-annual flow rate
n/a
audits (PM)
*At least 90 percent of the monitoring path is at least 10 meters from the drip line of the trees.
2019 Ambient Air Monitoring Network Plan, June 28, 2019 17Lemmon Valley
Located at the Boys and Girls Club at 325 Patrician Drive, this site is outside HA 87. It is in a
transitional area among residences, parks, and open fields.
Site name: Lemmon Valley
AQS ID: 32-031-2009
Geographical coordinates: 39° 38.716’N, 119° 50.401’W
Location: Inside northwest corner of Boys and Girls Club.
325 W. Patrician Drive
Street address:
Reno, NV 89506
County: Washoe
Distance to road: 59 meters to Patrician Drive.
837 AADT (2016-2018)
Traffic count:
(NDOT ATR 0310926 - Patrician Drive, 150 feet west of Lemmon Drive)
Groundcover: Paved / Vegetated
Representative area: Reno-Sparks MSA
Figure 6
Lemmon Valley Monitoring Station
2019 Ambient Air Monitoring Network Plan, June 28, 2019 18Figure 7
Lemmon Valley Monitoring Site Vicinity Aerial
2019 Ambient Air Monitoring Network Plan, June 28, 2019 19Lemmon Valley (continued)
Pollutant, POC O3, 1
Primary / QA Collocated / Other Primary
Parameter code 44201
Basic monitoring objective(s) NAAQS comparison
Highest
Site type(s)
Concentration
Monitor type SLAMS
Network affiliation(s) n/a
Instrument manufacturer / model TAPI T400
Method code 087
FRM / FEM / ARM / Other FEM
Collecting Agency WCHD - AQMD
Analytical Lab n/a
Reporting Agency WCHD - AQMD
Spatial scale Urban
Monitoring start date January 1987
Current sampling frequency Continuous
Required sampling frequency n/a
Sampling season 01/01 – 12/31
Probe height 5.5 meters
Distance from supporting structure 2.0 meters
Distance from obstructions on roof n/a
Distance from obstructions not on
None
roof
Distance from trees 21 meters
Distance to furnace or incinerator
9.1 meters
flue
Distance between collocated
n/a
monitors
For low volume PM instruments, is
n/a
any PM instrument within 1 meter?
For high volume PM instruments, is
any PM instrument within 2 n/a
meters?
Unrestricted airflow 360 degrees
Probe material Teflon
Residence time 7 seconds
Proposed modifications
None
within the next 18 months?
Is it suitable for comparison
n/a
against the annual PM2.5 NAAQS?
Frequency of flow rate verification
n/a
for manual samplers (PM)
Frequency of flow rate verification
n/a
for automated analyzers (PM)
Frequency of one-point QC check
Bi-weekly (3 point)
(gaseous)
03/19/18
Date of annual performance
06/21/18
evaluation (gaseous &
08/29/18
meteorological)
12/11/18
Date of two semi-annual flow rate
n/a
audits (PM)
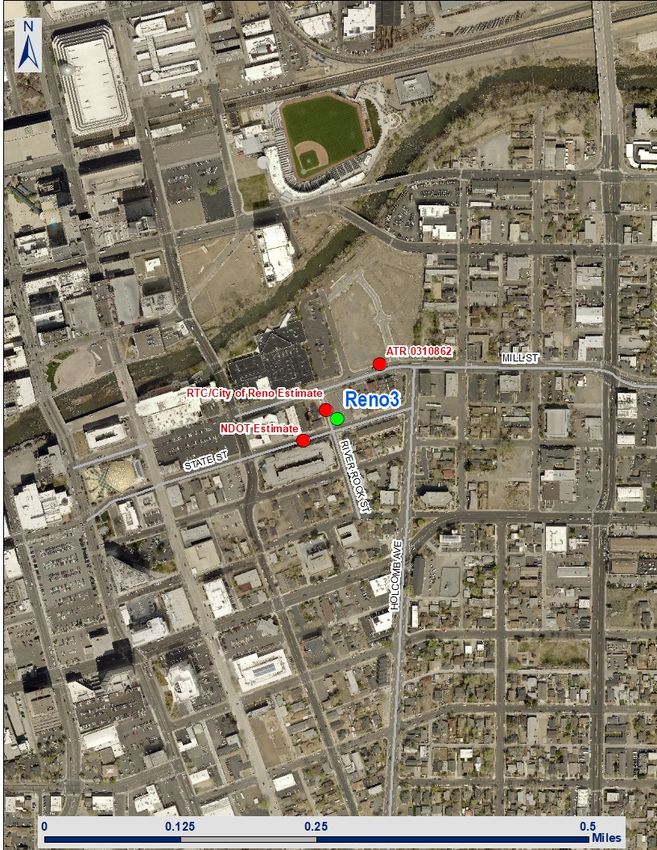
2019 Ambient Air Monitoring Network Plan, June 28, 2019 20Reno 3
This downtown site began operation in January 2002 to replace the Reno site. Both a
residential neighborhood and a commercial growth area surround this site. In December
2010, this site became an NCore site.
Site name: Reno 3
AQS ID: 32-031-0016
Geographical coordinates: 39o 31.505’N, 119o 48.463’W
Location: Southwest corner of City of Reno parking lot.
301A State Street
Street address:
Reno, NV 89501
County: Washoe
38 meters to Mill Street, 13.1 meters to State Street, and 6.7 meters to River
Distance to road:
Rock.
4,233 AADT (2016-2018)
(NDOT ATR 0310862 – Mill Street, 100 feet west of Holcomb Avenue)
≤900 Approximate AADT
Traffic count:
(NDOT Estimate – State Street)
200-300 Approximate AADT
(RTC/City of Reno Estimate – River Rock Street)
Groundcover: Paved
Representative area: Reno-Sparks MSA
Figure 8
Reno 3 Monitoring Station
2019 Ambient Air Monitoring Network Plan, June 28, 2019 21Figure 9
Reno 3 Monitoring Site Vicinity Aerial
2019 Ambient Air Monitoring Network Plan, June 28, 2019 22Reno 3 (continued)
Pollutant, POC PM10, 2 PM2.5, 3 PM10-2.5, 2 PM2.5 Speciation, 1
Primary / QA Collocated / Other Primary Primary Primary Primary
Parameter code 81102 & 85101 88101 86101 88502
Basic monitoring objective(s) NAAQS comparison NAAQS comparison Research Support Research Support
Population Highest Population Population
Site type(s)
Exposure Concentration Exposure Exposure
Monitor type SLAMS SLAMS SLAMS SLAMS
Network affiliation(s) NCore NCore NCore CSN STN, NCore
Met One BAM 1020 Met One SASS;
Instrument manufacturer / model Met One BAM 1020 Met One BAM 1020
Coarse Pair URG 3000N
SASS: 810
Method code 122 170 185
URG: 870
FRM / FEM / ARM / Other FEM FEM FEM Other
Collecting Agency WCHD - AQMD WCHD - AQMD WCHD - AQMD WCHD - AQMD
AMEC Foster
Analytical Lab n/a n/a n/a
Wheeler
Reporting Agency WCHD - AQMD WCHD - AQMD WCHD - AQMD WCHD - AQMD
Spatial scale Neighborhood Neighborhood Neighborhood Neighborhood
Monitoring start date December 2010 December 2010 December 2010 November 2001
Current sampling frequency Continuous Continuous Continuous 1:3
Required sampling frequency n/a n/a n/a 1:3
Sampling season 01/01 – 12/31 01/01 – 12/31 01/01 – 12/31 01/01 – 12/31
SASS: 4.8 meters
Probe height 5.0 meters 5.1 meters 5.1 meters
URG: 5.0 meters
SASS: 1.8 meters
Distance from supporting structure 2.1 meters 2.2 meters 2.2 meters
URG: 2.1 meters
Distance from obstructions on roof n/a n/a n/a n/a
Distance from obstructions not on
None None None None
roof
SASS: 19.7 meters*
Distance from trees 19.3 meters* 18.3 meters* 18.3 meters*
URG: 21 meters
Distance to furnace or incinerator
n/a n/a n/a n/a
flue
Distance between collocated
n/a 3.8 meters n/a n/a
monitors
For low volume PM instruments, is
No No No No
any PM instrument within 1 meter?
For high volume PM instruments, is
n/a n/a n/a n/a
any PM instrument within 2 meters?
Unrestricted airflow 360 degrees 360 degrees 360 degrees 360 degrees
Probe material n/a n/a n/a n/a
Residence time n/a n/a n/a n/a
Proposed modifications See pages 10 and See pages 10 and See pages 10 and See pages 10 and
within the next 18 months? 11 11 11 11
Is it suitable for comparison against
n/a Yes n/a No
the annual PM2.5 NAAQS?
Monthly
Frequency of flow rate verification
n/a n/a n/a verifications and
for manual samplers (PM)
quarterly audits
Bi-weekly Bi-weekly Bi-weekly
Frequency of flow rate verification
verifications and verifications and verifications and n/a
for automated analyzers (PM)
quarterly audits quarterly audits quarterly audits
Frequency of one-point QC check
n/a n/a n/a n/a
(gaseous)
Date of annual performance
evaluation (gaseous & n/a n/a n/a n/a
meteorological)
03/13/18 03/13/18 03/13/18 03/19/18
Date of two semi-annual flow rate 06/12/18 06/12/18 06/12/18 06/06/18
audits (PM) 09/11/18 09/11/18 09/11/18 09/25/18
12/18/18 12/18/18 12/18/18 12/12/18
2019 Ambient Air Monitoring Network Plan, June 28, 2019 23Reno 3 (continued)
Pollutant, POC PM10, 1 PM2.5, 1 PM10-2.5, 1 Trace CO, 1
Primary / QA Collocated / Other Other QA Collocated Other n/a
Parameter code 85101 88101 86101 42101
Basic monitoring objective(s) Research Support NAAQS comparison Research Support NAAQS comparison
Population Population Population Population
Site type(s)
Exposure Exposure Exposure Exposure
Monitor type SLAMS SLAMS SLAMS SLAMS
Network affiliation(s) NCore NCore NCore NCore
BGI PQ200 coarse
Instrument manufacturer / model BGI PQ200 BGI PQ200 TAPI 300EU
pair
Method code 125 142 173 593
FRM / FEM / ARM / Other FRM FRM FRM FRM
Collecting Agency WCHD - AQMD WCHD - AQMD WCHD - AQMD WCHD - AQMD
Analytical Lab WCHD - AQMD WCHD - AQMD WCHD - AQMD n/a
Reporting Agency WCHD - AQMD WCHD - AQMD WCHD - AQMD WCHD - AQMD
Spatial scale Neighborhood Neighborhood Neighborhood Neighborhood
Monitoring start date April 1988 January 1999 March 2009 December 2010
Current sampling frequency 1:3 1:3 1:3 Continuous
Required sampling frequency 1:3 1:3 1:3 n/a
Sampling season 01/01 – 12/31 01/01 – 12/31 01/01 – 12/31 01/01 – 12/31
Probe height 5.0 meters 5.0 meters 5.0 meters 4.9 meters
Distance from supporting structure 2.0 meters 2.0 meters 2.0 meters 1.9 meters
Distance from obstructions on roof n/a n/a n/a n/a
Distance from obstructions not on
None None None None
roof
Distance from trees 18.4 meters* 19.4 meters* 18.4 meters* 17.4 meters*
Distance to furnace or incinerator
n/a n/a n/a n/a
flue
Distance between collocated
n/a 3.8 meters n/a n/a
monitors
For low volume PM instruments, is
No No No n/a
any PM instrument within 1 meter?
For high volume PM instruments, is
n/a n/a n/a n/a
any PM instrument within 2 meters?
Unrestricted airflow 360 degrees 360 degrees 360 degrees 360 degrees
Probe material n/a n/a n/a Teflon
Residence time n/a n/a n/a 6 seconds
Proposed modifications See pages 10 and See pages 10 and See pages 10 and See pages 10 and
within the next 18 months? 11 11 11 11
Is it suitable for comparison against
n/a Yes n/a n/a
the annual PM2.5 NAAQS?
Monthly Monthly Monthly
Frequency of flow rate verification
verifications and verifications and verifications and n/a
for manual samplers (PM)
quarterly audits quarterly audits quarterly audits
Frequency of flow rate verification
n/a n/a n/a n/a
for automated analyzers (PM)
Frequency of one-point QC check
n/a n/a n/a Weekly
(gaseous)
03/13/18
Date of annual performance
06/26/18
evaluation (gaseous & n/a n/a n/a
09/18/18
meteorological)
12/18/18
03/20/18 03/20/18 03/20/18
Date of two semi-annual flow rate 06/20/18 06/20/18 06/20/18
n/a
audits (PM) 09/19/18 09/19/18 09/19/18
12/11/18 12/11/18 12/11/18
2019 Ambient Air Monitoring Network Plan, June 28, 2019 24Reno 3 (continued)
Pollutant, POC O3, 1 NO, 1 NO2, 1 NOX, 1
Primary / QA Collocated / Other n/a Primary Primary Primary
Parameter code 44201 42601 42602 42603
Basic monitoring objective(s) NAAQS comparison Research Support NAAQS comparison Research Support
Highest Population Population Population
Site type(s)
Concentration Exposure Exposure Exposure
Monitor type SLAMS SLAMS SLAMS SLAMS
Network affiliation(s) NCore NCore NCore NCore
Instrument manufacturer / model TAPI 400E TAPI 200EU TAPI 200EU TAPI 200EU
Method code 087 099 099 099
FRM / FEM / ARM / Other FEM FRM FRM FRM
Collecting Agency WCHD - AQMD WCHD - AQMD WCHD - AQMD WCHD - AQMD
Analytical Lab n/a n/a n/a n/a
Reporting Agency WCHD - AQMD WCHD - AQMD WCHD - AQMD WCHD - AQMD
Spatial scale Neighborhood Neighborhood Neighborhood Neighborhood
Monitoring start date January 1983 November 2001 November 2001 November 2001
Current sampling frequency Continuous Continuous Continuous Continuous
Required sampling frequency n/a n/a n/a n/a
Sampling season 01/01 - 12/31 01/01 - 12/31 01/01 - 12/31 01/01 - 12/31
Probe height 4.9 meters 4.8 meters 4.8 meters 4.8 meters
Distance from supporting structure 1.9 meters 1.8 meters 1.8 meters 1.8 meters
Distance from obstructions on roof n/a n/a n/a n/a
Distance from obstructions not on
None None None None
roof
Distance from trees 17.4 meters* 18.4 meters* 18.4 meters* 18.4 meters*
Distance to furnace or incinerator
n/a n/a n/a n/a
flue
Distance between collocated
n/a n/a n/a n/a
monitors
For low volume PM instruments, is
n/a n/a n/a n/a
any PM instrument within 1 meter?
For high volume PM instruments, is
n/a n/a n/a n/a
any PM instrument within 2 meters?
Unrestricted airflow 360 degrees 360 degrees 360 degrees 360 degrees
Probe material Teflon Teflon Teflon Teflon
Residence time 6 seconds 5 seconds 5 seconds 5 seconds
Proposed modifications See pages 10 and See pages 10 and See pages 10 and See pages 10 and
within the next 18 months? 11 11 11 11
Is it suitable for comparison against
n/a n/a n/a n/a
the annual PM2.5 NAAQS?
Frequency of flow rate verification
n/a n/a n/a n/a
for manual samplers (PM)
Frequency of flow rate verification
n/a n/a n/a n/a
for automated analyzers (PM)
Frequency of one-point QC check Weekly Weekly Weekly
Weekly
(gaseous) (4 point w/ GPT) (4 point w/ GPT) (4 point w/ GPT)
03/13/18 03/14/18 03/14/18 03/14/18
Date of annual performance
06/26/18 06/27/18 06/27/18 06/27/18
evaluation (gaseous &
09/18/18 09/18/18 09/18/18 09/18/18
meteorological)
12/18/18 12/19/18 12/19/18 12/19/18
Date of two semi-annual flow rate
n/a n/a n/a n/a
audits (PM)
2019 Ambient Air Monitoring Network Plan, June 28, 2019 25Reno 3 (continued)
Pollutant, POC Trace NO, 2 NOY-NO, 1 NOY, 1 Trace SO2, 1
Primary / QA Collocated / Other n/a n/a n/a n/a
Parameter code 42601 42612 42600 42401
Basic monitoring objective(s) Research Support Research Support Research Support NAAQS comparison
Population Population Population Population
Site type(s)
Exposure Exposure Exposure Exposure
Monitor type SLAMS SLAMS SLAMS SLAMS
Network affiliation(s) NCore NCore NCore NCore
TAPI 200EU with TAPI 200EU with TAPI 200EU with
Instrument manufacturer / model TAPI 100EU
501 501 501
Method code 699 699 699 600
FRM / FEM / ARM / Other Other Other Other FEM
Collecting Agency WCHD - AQMD WCHD - AQMD WCHD - AQMD WCHD - AQMD
Analytical Lab n/a n/a n/a n/a
Reporting Agency WCHD - AQMD WCHD - AQMD WCHD - AQMD WCHD - AQMD
Spatial scale Neighborhood Neighborhood Neighborhood Neighborhood
Monitoring start date December 2010 December 2010 December 2010 December 2010
Current sampling frequency Continuous Continuous Continuous Continuous
Required sampling frequency n/a n/a n/a n/a
Sampling season 01/01 - 12/31 01/01 - 12/31 01/01 - 12/31 01/01 - 12/31
Probe height 10.0 meters 10.0 meters 10.0 meters 4.9 meters
Distance from supporting structure 10.0 meters 10.0 meters 10.0 meters 1.9 meters
Distance from obstructions on roof n/a n/a n/a n/a
Distance from obstructions not on
None None None None
roof
Distance from trees 17.4 meters* 17.4 meters* 17.4 meters* 17.4 meters*
Distance to furnace or incinerator
n/a n/a n/a n/a
flue
Distance between collocated
n/a n/a n/a n/a
monitors
For low volume PM instruments, is
n/a n/a n/a n/a
any PM instrument within 1 meter?
For high volume PM instruments, is
n/a n/a n/a n/a
any PM instrument within 2 meters?
Unrestricted airflow 360 degrees 360 degrees 360 degrees 360 degrees
Probe material Teflon Teflon Teflon Teflon
Residence time 9 seconds 9 seconds 9 seconds 6 seconds
Proposed modifications See pages 10 and See pages 10 and See pages 10 and See pages 10 and
within the next 18 months? 11 11 11 11
Is it suitable for comparison against
n/a n/a n/a n/a
the annual PM2.5 NAAQS?
Frequency of flow rate verification
n/a n/a n/a n/a
for manual samplers (PM)
Frequency of flow rate verification
n/a n/a n/a n/a
for automated analyzers (PM)
Frequency of one-point QC check Weekly Weekly Weekly
Weekly
(gaseous) (4 point w/ GPT) (4 point w/ GPT) (4 point w/ GPT)
03/14/18 03/14/18 03/14/18 03/13/18
Date of annual performance
06/27/18 06/27/18 06/27/18 06/26/18
evaluation (gaseous &
09/18/18 09/18/18 09/18/18 09/18/18
meteorological)
12/19/18 12/19/18 12/19/18 12/18/18
Date of two semi-annual flow rate
n/a n/a n/a n/a
audits (PM)
*At least 90 percent of the monitoring path is at least 10 meters from the drip line of the trees.
2019 Ambient Air Monitoring Network Plan, June 28, 2019 26Reno 3 (continued)
Ambient Relative Humidity,
Pollutant, POC Wind Speed, 1 Wind Direction, 1
Temperature, 1 1
Primary / QA Collocated / Other n/a n/a n/a n/a
Parameter code 61101 & 61103 61102 & 61104 62101 62201
Research, Public Research, Public Research, Public Research, Public
Basic monitoring objective(s)
Information Information Information Information
Population Population Population Population
Site type(s)
Exposure Exposure Exposure Exposure
Monitor type SLAMS SLAMS SLAMS SLAMS
Network affiliation(s) NCore NCore NCore NCore
Instrument manufacturer / model Met One 50.5H Met One 50.5H YSI Series 700 Met One 083E
Method code 061 061 014 061
FRM / FEM / ARM / Other n/a n/a n/a n/a
Collecting Agency WCHD - AQMD WCHD - AQMD WCHD - AQMD WCHD - AQMD
Analytical Lab n/a n/a n/a n/a
Reporting Agency WCHD - AQMD WCHD - AQMD WCHD - AQMD WCHD - AQMD
Spatial scale Neighborhood Neighborhood Neighborhood Neighborhood
Monitoring start date February 2013 February 2013 February 2013 February 2013
Current sampling frequency Continuous Continuous Continuous Continuous
Required sampling frequency n/a n/a n/a n/a
Sampling season 01/01 – 12/31 01/01 – 12/31 01/01 – 12/31 01/01 – 12/31
Probe height 10.0 meters 10.0 meters 5.0 meters 5.0 meters
Distance from supporting structure 10.0 meters 10.0 meters 5.0 meters 5.0 meters
Distance from obstructions on roof n/a n/a n/a n/a
Distance from obstructions not on
None None None None
roof
Distance from trees 22 meters 22 meters 22 meters 22 meters
Distance to furnace or incinerator
n/a n/a n/a n/a
flue
Distance between collocated
n/a n/a n/a n/a
monitors
For low volume PM instruments, is
n/a n/a n/a n/a
any PM instrument within 1 meter?
For high volume PM instruments, is
n/a n/a n/a n/a
any PM instrument within 2 meters?
Unrestricted airflow 360 degrees 360 degrees 360 degrees 360 degrees
Probe material n/a n/a n/a n/a
Residence time n/a n/a n/a n/a
Proposed modifications See pages 10 and See pages 10 and See pages 10 and See pages 10 and
within the next 18 months? 11 11 11 11
Is it suitable for comparison against
n/a n/a n/a n/a
the annual PM2.5 NAAQS?
Frequency of flow rate verification
n/a n/a n/a n/a
for manual samplers (PM)
Frequency of flow rate verification
n/a n/a n/a n/a
for automated analyzers (PM)
Frequency of one-point QC check
n/a n/a n/a n/a
(gaseous)
03/13/18 03/13/18 03/13/18 03/13/18
Date of annual performance
06/12/18 06/12/18 06/12/18 06/12/18
evaluation (gaseous &
09/11/18 09/11/18 09/11/18 09/26/18
meteorological)
12/18/18 12/18/18 12/18/18 12/18/18
Date of two semi-annual flow rate
n/a n/a n/a n/a
audits (PM)
2019 Ambient Air Monitoring Network Plan, June 28, 2019 27South Reno
Located on the NV Energy property at 4110 Delucchi Lane, this site is in a transitional
environment between open fields and office buildings.
Site name: South Reno
AQS ID: 32-031-0020
Geographical coordinates: 39o 28.153’N, 119o 46.521’W
Location: Northeast corner of NV Energy campus.
4110 Delucchi Lane
Street address:
Reno, NV 89502
County: Washoe
Distance to road: 37 meters to Delucchi Lane.
4,833 AADT (2016-2018)
(NDOT ATR 0310690 - Neil Road, 515 feet north of Delucchi Lane)
10,033 AADT (2016-2018)
Traffic count:
(NDOT ATR 0311159 - Airway Drive, south of McCarran Blvd.)
≤900 Approximate AADT
(NDOT Estimate – Delucchi Lane)
Groundcover: Gravel / Dirt / Vegetated
Representative area: Reno-Sparks MSA
Figure 10
South Reno Monitoring Station
2019 Ambient Air Monitoring Network Plan, June 28, 2019 28Figure 11
South Reno Monitoring Site Vicinity Aerial
2019 Ambient Air Monitoring Network Plan, June 28, 2019 29South Reno (continued)
Ambient
Pollutant, POC O3, 1 Wind Speed, 1 Wind Direction, 1
Temperature, 1
Primary / QA Collocated / Other n/a n/a n/a n/a
Parameter code 44201 61101 61102 62101
NAAQS
Basic monitoring objective(s) Public Information Public Information Public Information
comparison
Population Population Population Population
Site type(s)
Exposure Exposure Exposure Exposure
Monitor type SLAMS SLAMS SLAMS SLAMS
Network affiliation(s) n/a n/a n/a n/a
Instrument manufacturer / model TAPI T400 Met One 50.5H Met One 50.5H YSI Series 700
Method code 087 061 061 014
FRM / FEM / ARM / Other FEM n/a n/a n/a
Collecting Agency WCHD - AQMD WCHD - AQMD WCHD - AQMD WCHD - AQMD
Analytical Lab n/a n/a n/a n/a
Reporting Agency WCHD - AQMD WCHD - AQMD WCHD - AQMD WCHD - AQMD
Spatial scale Neighborhood Neighborhood Neighborhood Neighborhood
Monitoring start date January 1988 January 2014 January 2014 January 2014
Current sampling frequency Continuous Continuous Continuous Continuous
Required sampling frequency n/a n/a n/a n/a
Sampling season 01/01 – 12/31 01/01 – 12/31 01/01 – 12/31 01/01 – 12/31
Probe height 4.0 meters 10.0 meters 10.0 meters 5.0 meters
Distance from supporting structure 1.2 meters 10.0 meters 10.0 meters 5.0 meters
Distance from obstructions on roof n/a n/a n/a n/a
Distance from obstructions not on
None None None None
roof
Distance from trees 27 meters 27 meters 27 meters 27 meters
Distance to furnace or incinerator
n/a n/a n/a n/a
flue
Distance between collocated
n/a n/a n/a n/a
monitors
For low volume PM instruments, is
n/a n/a n/a n/a
any PM instrument within 1 meter?
For high volume PM instruments, is
any PM instrument within 2 n/a n/a n/a n/a
meters?
Unrestricted airflow 360 degrees 360 degrees 360 degrees 360 degrees
Probe material Teflon n/a n/a n/a
Residence time 6 seconds n/a n/a n/a
Proposed modifications
None None None None
within the next 18 months?
Is it suitable for comparison
n/a n/a n/a n/a
against the annual PM2.5 NAAQS?
Frequency of flow rate verification
n/a n/a n/a n/a
for manual samplers (PM)
Frequency of flow rate verification
n/a n/a n/a n/a
for automated analyzers (PM)
Frequency of one-point QC check
Bi-weekly (3 point) n/a n/a n/a
(gaseous)
03/22/18 03/28/18 03/28/18 03/28/18
Date of annual performance
06/20/18 06/12/18 06/12/18 06/12/18
evaluation (gaseous &
09/05/18 09/11/18 09/11/18 09/11/18
meteorological)
12/12/18 12/19/18 12/19/18 12/19/18
Date of two semi-annual flow rate
n/a n/a n/a n/a
audits (PM)
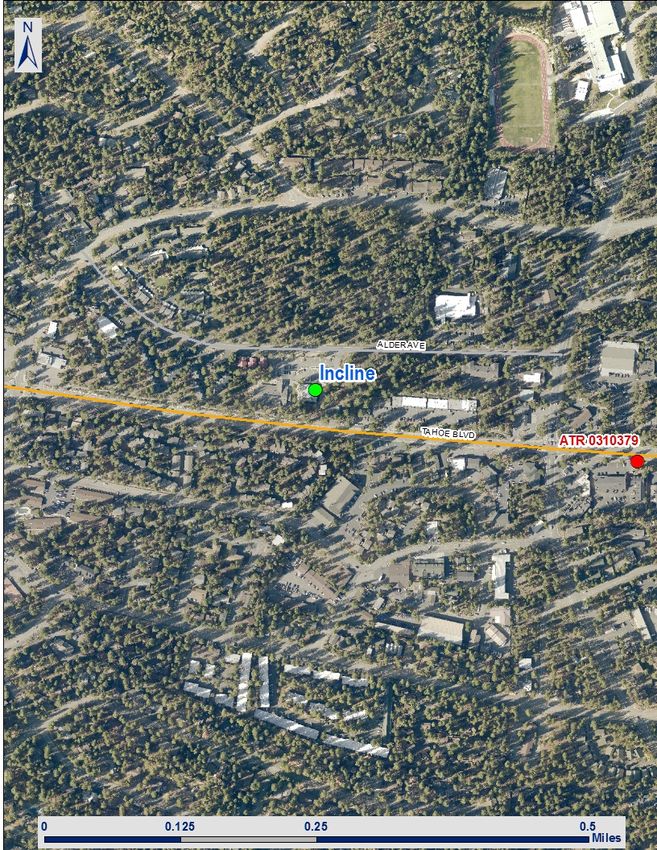
2019 Ambient Air Monitoring Network Plan, June 28, 2019 30Spanish Springs
Located on the north side of Lazy 5 Regional Park in Spanish Springs, this site is located
outside of HA 87. It is in a transitional area between open rangeland, residential areas, and a
Washoe County Public Library. The Spanish Springs site began monitoring O3, PM10, PM2.5, and
PM10-2.5 as a SPM on January 1, 2017, and was converted to a SLAMS on July 1, 2018. It began
monitoring wind speed, wind direction, and ambient temperature as a SPM on January 1,
2019, and will convert to a SLAMS on January 1, 2020.
Site name: Spanish Springs
AQS ID: 32-031-1007
Geographical coordinates: 39°37.287’ N, 119°43.124’ W
Location: North side of Lazy 5 Regional Park.
7200 Pyramid Way
Street address:
Sparks, NV 89436
County: Washoe
Distance to road: 460 meters to Pyramid Hwy and 99 meters to Aquene Court.
36,000 AADT (2016-2018)
(NDOT ATR 0311128 – SR445 (Pyramid Hwy), 0.25 miles north of Sparks Blvd.)
Traffic count:
≤900 Approximate AADT
(NDOT Estimate – Aquene Court)
Groundcover: Paved / Vegetated
Representative area: Reno-Sparks MSA
Figure 12
Spanish Springs Monitoring Station
2019 Ambient Air Monitoring Network Plan, June 28, 2019 31Figure 13
Spanish Springs Site Vicinity Aerial
2019 Ambient Air Monitoring Network Plan, June 28, 2019 32Spanish Springs (continued)
Pollutant, POC PM10, 1 PM2.5, 1 PM10-2.5, 1 O3, 1
Primary / QA Collocated / Other Primary Primary Primary n/a
Parameter code 81102 88101 86101 44201
Basic monitoring objective(s) NAAQS comparison NAAQS comparison Research Support NAAQS comparison
Population Population Population Population
Site type(s)
Exposure Exposure Exposure Exposure
Monitor type SLAMS SLAMS SLAMS SLAMS
Network affiliation(s) n/a n/a n/a n/a
Met One BAM 1020
Instrument manufacturer / model Met One BAM 1020 Met One BAM 1020 TAPI T400
Coarse Pair
Method code 122 170 185 087
FRM / FEM / ARM / Other FEM FEM FEM FEM
Collecting Agency WCHD - AQMD WCHD - AQMD WCHD - AQMD WCHD - AQMD
Analytical Lab n/a n/a n/a n/a
Reporting Agency WCHD - AQMD WCHD - AQMD WCHD - AQMD WCHD - AQMD
Spatial scale Neighborhood Neighborhood Neighborhood Neighborhood
Monitoring start date January 2017 January 2017 January 2017 January 2017
Current sampling frequency Continuous Continuous Continuous Continuous
Required sampling frequency n/a n/a n/a n/a
Sampling season 01/01 – 12/31 01/01 – 12/31 01/01 – 12/31 01/01 – 12/31
Probe height 5.0 meters 5.1 meters 5.1 meters 4.0 meters
Distance from supporting structure 2.1 meters 2.2 meters 2.2 meters 1.1 meters
Distance from obstructions on roof n/a n/a n/a n/a
Distance from obstructions not on
n/a n/a n/a n/a
roof
Distance from trees 33 meters 34 meters 33 meters 35 meters
Distance to furnace or incinerator
n/a n/a n/a n/a
flue
Distance between collocated
n/a n/a n/a n/a
monitors
For low volume PM instruments, is
No No No n/a
any PM instrument within 1 meter?
For high volume PM instruments, is
n/a n/a n/a n/a
any PM instrument within 2 meters?
Unrestricted airflow 360 degrees 360 degrees 360 degrees 360 degrees
Probe material n/a n/a n/a Teflon
Residence time n/a n/a n/a 6 seconds
Proposed modifications
None None None None
within the next 18 months?
Is it suitable for comparison against
n/a Yes n/a n/a
the annual PM2.5 NAAQS?
Frequency of flow rate verification
n/a n/a n/a n/a
for manual samplers (PM)
Frequency of flow rate verification Bi-weekly and Bi-weekly and Bi-weekly and
n/a
for automated analyzers (PM) quarterly audits quarterly audits quarterly audits
Frequency of one-point QC check
n/a n/a n/a Bi-weekly (3 point)
(gaseous)
03/15/18
Date of annual performance
06/21/18
evaluation (gaseous & n/a n/a n/a
08/29/18
meteorological)
12/11/18
03/27/18 03/27/18 03/27/18
Date of two semi-annual flow rate 06/14/18 06/14/18 06/14/18
n/a
audits (PM) 09/13/18 09/13/18 09/13/18
12/18/18 12/18/18 12/18/18
2019 Ambient Air Monitoring Network Plan, June 28, 2019 33Spanish Springs (continued)
Ambient
Pollutant, POC Wind Speed, 1 Wind Direction, 1
Temperature, 1
Primary / QA Collocated / Other n/a n/a n/a
Parameter code 61101 61102 62101
Basic monitoring objective(s) Public Information Public Information Public Information
Population Population Population
Site type(s)
Exposure Exposure Exposure
Monitor type SPM SPM SPM
Network affiliation(s) n/a n/a n/a
Instrument manufacturer / model Met One 50.5H Met One 50.5H YSI Series 700
Method code 061 061 014
FRM / FEM / ARM / Other n/a n/a n/a
Collecting Agency WCHD - AQMD WCHD - AQMD WCHD - AQMD
Analytical Lab n/a n/a n/a
Reporting Agency WCHD - AQMD WCHD - AQMD WCHD - AQMD
Spatial scale Neighborhood Neighborhood Neighborhood
Monitoring start date January 2019 January 2019 January 2019
Current sampling frequency Continuous Continuous Continuous
Required sampling frequency n/a n/a n/a
Sampling season 01/01 – 12/31 01/01 – 12/31 01/01 – 12/31
Probe height 10.0 meters 10.0 meters 5.0 meters
Distance from supporting structure 10.0 meters 10.0 meters 5.0 meters
Distance from obstructions on roof n/a n/a n/a
Distance from obstructions not on
None None None
roof
Distance from trees 32 meters 32 meters 32 meters
Distance to furnace or incinerator
n/a n/a n/a
flue
Distance between collocated
n/a n/a n/a
monitors
For low volume PM instruments, is
n/a n/a n/a
any PM instrument within 1 meter?
For high volume PM instruments, is
any PM instrument within 2 n/a n/a n/a
meters?
Unrestricted airflow 360 degrees 360 degrees 360 degrees
Probe material n/a n/a n/a
Residence time n/a n/a n/a
Proposed modifications
See page 10 See page 10 See page 10
within the next 18 months?
Is it suitable for comparison
n/a n/a n/a
against the annual PM2.5 NAAQS?
Frequency of flow rate verification
n/a n/a n/a
for manual samplers (PM)
Frequency of flow rate verification
n/a n/a n/a
for automated analyzers (PM)
Frequency of one-point QC check
n/a n/a n/a
(gaseous)
Date of annual performance
evaluation (gaseous & 12/18/18 12/18/18 12/18/18
meteorological)
Date of two semi-annual flow rate
n/a n/a n/a
audits (PM)
2019 Ambient Air Monitoring Network Plan, June 28, 2019 34You can also read