Growing Stronger by Delivering on Our Purpose, Passion and Promise - May 2021
←
→
Page content transcription
If your browser does not render page correctly, please read the page content below

Growing Stronger by Delivering on
Our Purpose, Passion and Promise

May 2021
                                    May 2021   1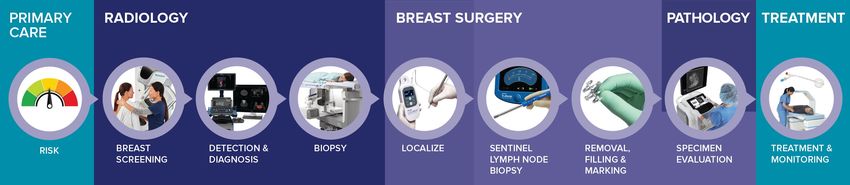
Safe Harbor Statement
This otherwise successfully integrated, and the risks that acquisitions may involve unexpected costs or unexpected liabilities; the risks of conducting business
internationally; presentation contains forward-looking information that involves risks and uncertainties, including statements about the Company’s plans, objectives,
expectations and intentions. Such statements include, without limitation: financial or other information based upon or otherwise incorporating judgments or estimates
relating to future performance, events or expectations; the Company’s strategies, positioning, resources, capabilities, and expectations for future performance; and the
Company's outlook and financial and other guidance. These forward-looking statements are based upon assumptions made by the Company as of the date hereof and are
subject to known and unknown risks and uncertainties that could cause actual results to differ materially from those anticipated.

Risks and uncertainties that could adversely affect the Company’s business and prospects, and otherwise cause actual results to differ materially from those anticipated,
include without limitation: the severity and duration of the COVID-19 pandemic and its impact on the U.S. healthcare system, the U.S. economy and worldwide economy;
the timing, scope and effect of further U.S. and international governmental, regulatory, fiscal, monetary and public health responses to the COVID-19 pandemic; continued
demand for the Company’s COVID-19 TMA assay; the Company’s ability to manufacture, on a scale necessary to meet demand, its COVID-19 TMA assay as well as the
Panther systems on which the assay runs; U.S., European and general worldwide economic conditions, trade relations, and related uncertainties; manufacturing risks,
including the Company’s reliance on a single or limited source of supply for key components, the need to comply with especially high standards for the manufacture of many
of its products and risks associated with utilizing third party manufacturers; the Company’s ability to predict accurately the demand for its products, and products under
development, and to develop strategies to address its markets successfully; the ability of the Company to successfully manage leadership and organizational changes,
including the ability of the Company to attract, motivate and retain key employees and maintain engagement and efficiency in remote work environments; the Company’s
reliance on third-party reimbursement policies to support the sales and market acceptance of its products, including the possible adverse impact of government regulation
and changes in the availability and amount of reimbursement and uncertainties for new products or product enhancements; changes to applicable laws and regulations,
including tax laws, global health care reform, and import/export trade laws; changes in guidelines, recommendations and studies published by various organizations that
could affect the use of the Company’s products; uncertainties inherent in the development of new products and the enhancement of existing products, including FDA
approval and/or clearance and other regulatory risks, technical risks, cost overruns and delays; the risk that products may contain undetected errors or defects or otherwise
not perform as anticipated; risks associated with strategic alliances and the ability of the Company to realize anticipated benefits of those alliances; risks associated with
acquisitions, including, without limitation, the Company’s ability to successfully integrate acquired businesses, the risks that the acquired businesses may not operate as
effectively and efficiently as expected even if the risk of adverse exchange rate fluctuations on the Company’s international activities and businesses; the early stage of
market development for certain of the Company’s products; the Company’s leverage risks, including the Company’s obligation to meet payment obligations and financial
covenants associated with its debt; cybersecurity risks; risks related to the use and protection of intellectual property; expenses, uncertainties and potential liabilities relating
to litigation, including, without limitation, commercial, intellectual property, employment and product liability litigation; technical innovations that could render products
marketed or under development by the Company obsolete; and competition.

The risks included above are not exhaustive. Other factors that could adversely affect the Company's business and prospects are described in the filings made by the
Company with the SEC, including its most recent Annual Report on Form 10-K and Quarterly Report on Form 10-Q. The Company expressly disclaims any obligation or
undertaking to release publicly any updates or revisions to any such statements presented herein to reflect any change in expectations or any change in events, conditions
or circumstances on which any such statements are based. Hologic and associated logos are trademarks and/or registered trademarks of Hologic, Inc. and/or its
subsidiaries in the United States and/or other countries.
                                                                                                                                            May 2021                               2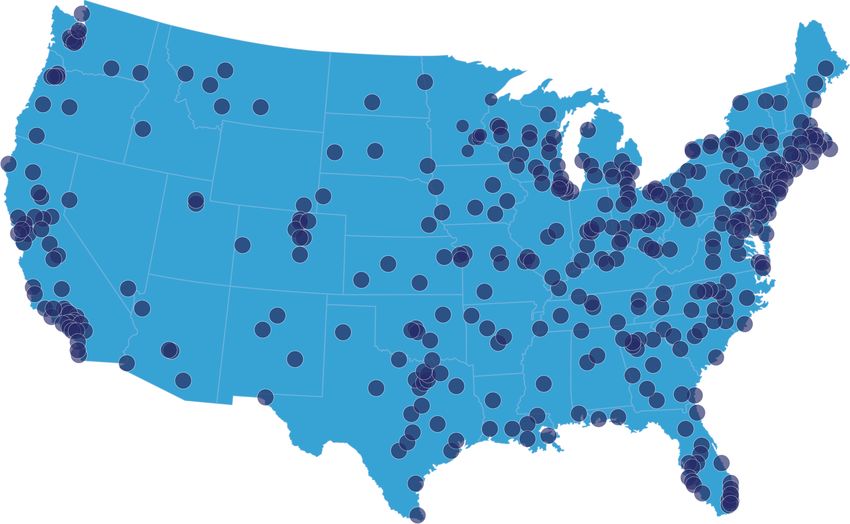
Non-GAAP Financial Measures
The Company has presented the following non-GAAP financial measures in this presentation: constant currency revenues; organic revenues; non-GAAP gross margin;
non-GAAP operating expenses; non-GAAP operating margin; non-GAAP effective tax rate; non-GAAP net income; non-GAAP net margin; non-GAAP EPS; and
adjusted EBITDA. The Company defines its non-GAAP net income, EPS, and other non-GAAP financial measures to exclude, as applicable: (i) the amortization of
intangible assets and impairment of goodwill, intangible assets and equipment; (ii) additional depreciation expense from acquired fixed assets and accelerated
depreciation related to consolidation and closure of facilities; (iii) additional expenses resulting from the purchase accounting adjustment to record inventory at fair value
and adjustments to contingent consideration; (iv) restructuring and divestiture charges and facility closure and consolidation charges and costs incurred to integrate
acquisitions (including retention, transaction bonuses, legal and professional consulting services) and separate divested businesses from existing operations; (v)
expenses related to its divested Cynosure business incurred subsequent to the disposition date primarily related to indemnification provisions for legal and tax matters
(vi) transaction related expenses for divestitures and acquisitions; (vii) third-party expenses incurred related to implementing the European MDR/IVDR requirements
and obtaining the appropriate approvals for its existing products (viii) debt extinguishment losses and related transaction costs; (ix) the unrealized (gains) losses on the
mark-to-market of forward foreign currency contracts and foreign currency option contracts for which the Company has not elected hedge accounting; (x) litigation
settlement charges (benefits) and non-income tax related charges (benefits); (xi) other-than-temporary impairment losses on investments and realized gains and losses
resulting from the sale of investments; (xii) the one-time discrete impact of tax reform and other one-time impacts related to internal restructuring and non-operational
items; (xiii) other one-time, non-recurring, unusual or infrequent charges, expenses or gains that may not be indicative of the Company's core business results; and
(xiv) income taxes related to such adjustments. The Company defines adjusted EBITDA as its non-GAAP net income plus net interest expense, income taxes, and
depreciation and amortization expense included in its non-GAAP net income. The Company defines organic revenue to exclude the divested Blood Screening business,
and the Acessa, Biotheranostics, and Diagenode businesses.

These non-GAAP financial measures should be considered supplemental to, and not a substitute for, financial information prepared in accordance with GAAP. The
company's definition of these non-GAAP measures may differ from similarly titled measures used by others.

The non-GAAP financial measures used in this presentation adjust for specified items that can be highly variable or difficult to predict. The company generally uses
these non-GAAP financial measures to facilitate management's financial and operational decision-making, including evaluation of Hologic's historical operating results,
comparison to competitors' operating results and determination of management incentive compensation. These non-GAAP financial measures reflect an additional way
of viewing aspects of the company's operations that, when viewed with GAAP results and the reconciliations to corresponding GAAP financial measures, may provide a
more complete understanding of factors and trends affecting Hologic's business.

Because non-GAAP financial measures exclude the effect of items that will increase or decrease the company's reported results of operations, management strongly
encourages investors to review the company's consolidated financial statements and publicly filed reports in their entirety. A reconciliation of the non-GAAP financial
measures to the most directly comparable GAAP financial measures is included in the tables accompanying this presentation.

                                                                                                                                           May 2021                              3
Presentation Outline
Introduction

Making a massive difference against COVID-19

Stronger company post-pandemic

Financials and conclusion

                                               May 2021   4
What Makes Us Tick

                     May 2021   5
Investment Thesis
• Unrivaled leader in women’s health
• Making a huge, global impact in the
  fight against COVID-19
• Revenue doubled in 2Q21
• Building on core businesses to
  emerge from the pandemic as a
  stronger company
 – With a distinctive culture rewarding
   performance and courage

                                          May 2021   6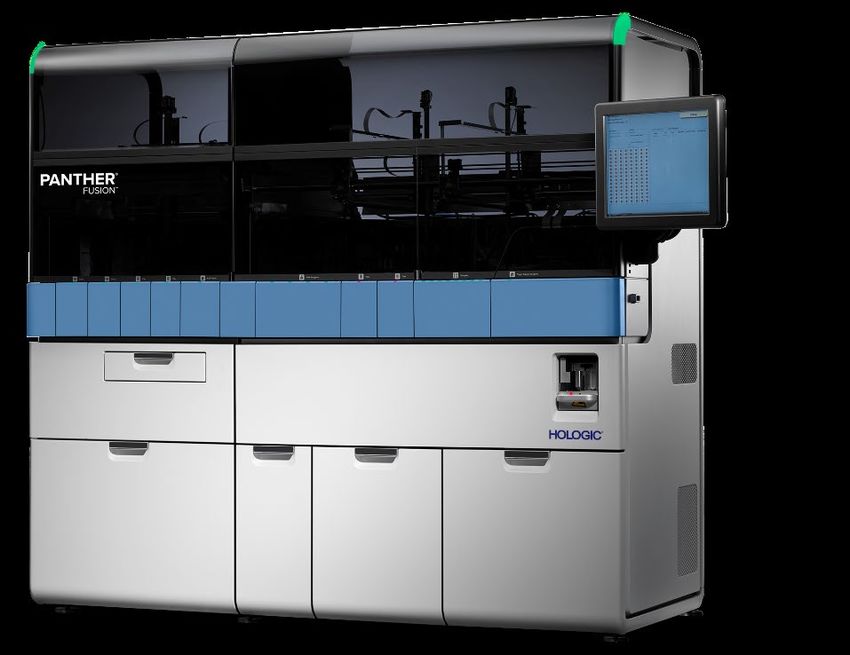
Hologic Overview
 • Revenue of $3,776 million in fiscal 2020, representing 12.1% constant currency
   growth and 21.7% organic growth
                     By Division                                               By Type            By Geography

                  Surgical                                                Service
                    10%                                                    14%                    OUS
                                                                                                  24%
                                                                     Capital
           Breast                                                     17%
                                   Diagnostics                                      Consumables
            and                                                                                                 US
                                      57%                                               69%
          Skeletal                                                                                             76%
            33%

Note: Percentages in pie charts are for FY20 and exclude Cynosure.                                      May 2021     7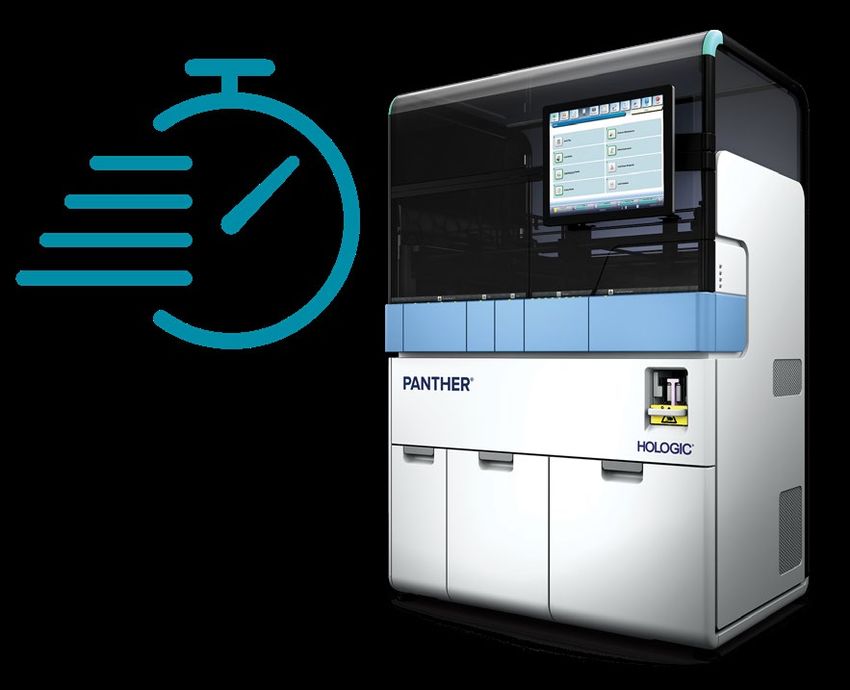
Presentation Outline
Introduction

Making a massive difference against COVID-19

Stronger company post-pandemic

Financials and conclusion

                                               May 2021   8
Developed Two Tests for COVID-19 in Record Time
• As one of world’s leading molecular Dx firms, uniquely positioned to help
  fight COVID-19

• Received EUA for Panther Fusion SARS-CoV-2 assay and second,
  high-production Aptima test
  ‒ Both fast and accurate

          COLLECT                       LOAD                            DELIVER

                                                                   May 2021       9
Leveraged Huge Panther Installed Base
• About 2,600 Panther instruments globally
 – Strong start to 2021 with ~340 shipments YTD

               Cumulative Global Shipments*
 2500
                                                             +511
 2000
                                                      +213
                                            +214
 1500
                                     +253
                        +252
 1000
               +207

  500

    0
        2014   2015      2016        2017     2018    2019   2020
                      US Shipments    OUS Shipments

                                                                    May 2021   10
Dramatically Increased Production
• Roughly tripled total molecular Dx manufacturing capacity
‒ Further expanding to 75 million tests/quarter by Q2’22
• Helping labs deliver fast, accurate COVID-19 results when and where needed
‒ $2.35 billion of cumulative COVID-19 assay revenue
COVID-19 Tests Provided to Customers Globally
35
30
25
20
15
10
5
-
2Q20 3Q20 4Q20 1Q21 2Q21
May 2021 11Presentation Outline
Introduction
Making a massive difference against COVID-19
Stronger company post-pandemic
Financials and conclusion
May 2021 12Long-Term Need for COVID-19 Testing
• Unprecedented societal concern
• Multiple needs for molecular
– Symptomatic patients
– Confirmatory testing
– Population-based screening (schools, offices)
– Travel
– Medical procedures
• Hologic well-positioned
– Geographically dispersed, high-throughput installed base
– Broad labels including asymptomatic claims
– Pooling
– Multiplex assay
May 2021 13Panther Placements Turbo-Charge Dx Business Model
• Expect to place several hundred more Panther
systems due to COVID-19
• Significant new business on deck globally
– $35 million of US TORs in 2020, 50% higher than
previous record
» Momentum continues YTD 2021
– Tremendous OUS opportunities
• 18 assays on Panther, 4 on older TIGRIS system
May 2021 14Mobidiag Enables Entry into Near-Patient, Acute Care Testing
• Acquiring Mobidiag for approximately
$795 million
• Accelerates entry into large, fast-growing
acute care adjacency with near-patient
testing solution
• Differentiated Novodiag platform
combines real-time PCR and microarray
capabilities to provide:
– High-level multiplexing
– Ease of use
– Rapid turnaround time
May 2021 15Biotheranostics Accelerates Growth in Oncology
• Acquired Biotheranostics for $232 million
• Accelerates entry into large, fast-growing
oncology adjacency
– Two PCR-based gene expression tests for
breast and metastatic cancers
– BCI test recently included in NCCN
guidelines
• Provides lab capabilities to develop
markets for new tests
• Attractive financials consistent with capital
deployment goals
May 2021 16Diagenode Strengthens European Diagnostics Business
• Acquired Diagenode for $153 million
• Belgium developer and manufacturer of molecular
diagnostic assays and epigenetics products
• Expands international capabilities, speeds regional
time to market, and expands test menu
– Broad portfolio of PCR-based, CE-marked tests
– Previously partnered to develop assays for Panther
Fusion
May 2021 17Breast Health Leadership Across the Continuum of Care
ARTIFICIAL INTELLIGENCE & ANALYTICS
May 2021 18Breast Health Revenue Increasingly Diversified
$1,200
• Gantry sales impacted by 3% US Breast Conserving
COVID-19 pandemic but Surgery
$1,000 23%
recovering 20% Total OUS
$800
• Service and consumable US Service
30% 34%
revenue streams helping $600
business grow US Interventional
13%
$400 13%
• HSD growth in 2Q 2021 11% US Accessories and
10% Equipment
$200
25%
17% US Gantries
$-
FY'15 FY'20
19
Note: Percentages do not add to 100% due to rounding. May 2021Surgical Rebounding Strongly
Surgical Revenue Accelerating
• Best-in-class products 10% 7%
10%
7%
4% 5% 4% 3%
1%
• New leadership 0%
-13%
• New sales model -10%
-20%
• New products
– Acessa acquisition -30%
-54%
• Continued recovery in 2Q -40%
-50%
-60%
1Q19 2Q19 3Q19 4Q19 1Q20 2Q20 3Q20 4Q20 1Q21 2Q21
20Realizing International Potential
• Growth from new leadership, new products, going direct
• COVID assay sales provide significant upside, accelerate growth strategies
Core OUS Revenue (ex. Blood, Medical Aesthetics)
$1,000
31%
$800
11%
13%
$600 -5% 11%
5% 0%
$400
$533 $510 $492 $538 $634 $671 $879
$200
$-
2014 2015 2016 2017 2018 2019 2020
Note: Growth percentage changes are in constant currency, $ amounts are as reported. May 2021 21Strong Cash Flows Create Unique Opportunity
• Robust free cash flow in fiscal 2021 from COVID assay sales and
recovery of other businesses
• Comfortable with leverage ratio 2 to 3x in the long-term
– Lower near-term due to benefits of COVID assay sales
• Pursuing growth-accretive acquisitions that strengthen core businesses
– Building track record of success
– Division-led deals
– Leverage existing channels or expand into near adjacencies
– Attractive ROIC, EPS accretion over time
• Buybacks
– $120 million in 2Q
May 2021 22Presentation Outline
Introduction
Making a massive difference against COVID-19
Stronger company post-pandemic
Financials and conclusion
May 2021 237.0% Annual Revenue Growth from 2014 to 2020
Total Revenue¹
12.1%²
$3,500 5.7%
4.3%
8.3%
$3,000 5.4%
9.9%
0.4%
$2,500
$2,000
$1,500
$2,511 $2,705 $2,833 $3,059 $3,218 $3,367 $3,776
$1,000
$500
$0
2014 2015 2016 2017 2018 2019 2020
¹ Total non-GAAP revenue growth in millions. Growth rates in constant currency. As reported except FY14, which excludes ~$20 million
one-time revenue from amending Roka license. Results include contributions from the Blood Screening business that was divested in
2017, the Medical Aesthetic business that was acquired in 2017 and divested in 2020, and other smaller acquisitions.
2 Excluding the divested Blood Screening and Medical Aesthetics businesses, growth was 22.5% in 2020.
2418.2% Annual Growth in Non-GAAP EPS
Non-GAAP EPS*
$4.50
63.8%
$4.00
$3.50
$3.00
$2.50 9.0%
9.9%
17.4% 3.6%
$2.00 14.4%
-2.7%
$1.50
$1.00
$1.46 $1.67 $1.96 $2.03 $2.23 $2.43 $3.98
$0.50
$0.00
2014 2015 2016 2017 2018 2019 2020
* Non-GAAP EPS as presented in our earnings releases except FY14, which excludes ~$0.05 one-time contribution from
amending Roka license. Results include contributions from the Blood Screening business that was divested in 2017, the
Medical Aesthetic business that was acquired in 2017 and divested in 2020, and other smaller acquisitions. 25Strong, Consistent Free Cash Flow
• Sales of two COVID assays represent significant upside in 2021
Adjusted Free Cash Flow*
$800
$740
$707 $704 $687
$600
$599 $608
$400
$200
$0
2015 2016 2017 2018 2019 2020
*Notes:
1) Adjusted for the approximate impact of $650 million of taxes paid related to the gain on the divestiture of our blood screening business and $50 million of convertible notes tax recapture in FY’17, $60
million for convertible notes tax recapture in FY’18, and $35M for a litigation payment, $28M for acquisition related tax payments, $10.5M for a litigation payment, and $6M for a litigation receipt in FY’19.
2) Capital expenditures calculated as the sum of purchase of property and equipment and expenditures due to increase in equipment under customer usage agreements.
3) Free cash flow defined as operating cash flow less capital expenditures.
26Revenue Highlights 2Q21
Non-GAAP
CC ∆
Revenue ($M) 2Q21 vs. 2Q20
Diagnostics $1,064.5 225.2%
Excluding Blood $1,052.5 237.5%
Breast Health $336.3 7.3%
GYN Surgical $114.2 6.6%
Skeletal Health $22.6 (6.8%)
Total Revenue $1,537.6 98.7%
Organic* $1,516.4 100.0%
US Organic $1,045.5 86.8%
OUS Organic $470.9 140.7%
* Organic revenue excludes divested Blood Screening business, and acquired Acessa, Biotheranotics and Diagenode businesses.
27Financial Overview 2Q21
Non-GAAP
$M, except EPS 2Q21 ∆ vs. 2Q20
Revenue $1,537.6 103.4% (98.7% CC)
Organic* $1,516.4 104.7% (100.0% CC)
Gross Margin 75.0% +1,400 bps
Operating Expenses $277.7 24.8%
Operating Margin 56.9% +2,540 bps
Net Margin 43.8% +2,380 bps
Diluted EPS $2.59 354.4%
EBITDA $896.7 261.1%
* Organic revenue excludes divested Blood Screening business, and acquired Acessa, Biotheranotics and Diagenode businesses.
28Q3 2021 Financial Guidance
3Q (Non-GAAP*)
Q3 2021 Reported CC Organic vs.
Guidance vs. Q3 2020 vs. Q3 2020 Q3 2020
Revenue $1,000 - $1,070 21.5% – 30.0% 17.9% – 26.4% 15.1% – 23.6%
Diluted EPS $1.00 – $1.15 33.3% – 53.3%
* Dollars in millions. Guidance provided by press release on 4/28/21. Presentation here is not, and should not be construed as, re-affirmation of guidance. 29
Guidance assumes diluted shares outstanding of approximately 261 million for the quarter and an effective tax rate of approximately 21.5%.Financial Appendix
30Capitalization as of 2Q21
Tranche
Amount Leverage Coupon Rating Call Date Maturity
Cash & Equivalents 816
Revolving Facility ($1,500 million) - L + 100 Baa3 / BBB- 12/17/23
Term Loan 1,425 L + 100 Baa3 / BBB- 12/17/23
Total Secured Debt 1,425 0.5x
Senior Unsecured Notes - 2028 400 4.625% Ba2 / BB- 02/01/23 02/01/28
Senior Unsecured Notes - 2029 950 3.250% Ba2 / BB- 09/28/23 02/15/29
Total Guaranteed Debt 2,775 0.9x
Total Debt 2,775 0.9x
Net Debt 1,959 0.7x
LTM Adjusted EBITDA 2,945
Corporate Rating Ba1 / BB+
31Reconciliation of GAAP to Non-GAAP (unaudited)
$s in millions, except earnings per share
Years Ended
September 26, 2020 September 28, 2019
GROSS PROFIT
GAAP gross profit $2,227.5 $1,170.9
Adjustments:
Amortization of intangible assets 253.2 318.5
Additional Cynosure related expenses 2.3 -
Integration/consolidation costs 0.9 0.3
Impairment of intangible assets and equipment 25.8 578.7
Fair value write-up of acquired inventory 6.7 7.1
Non-GAAP gross profit $2,516.4 $2,075.5
GROSS MARGIN PERCENTAGE
GAAP gross margin percentage 59.0% 34.8%
Impact of adjustments above 7.6% 26.8%
Non-GAAP gross margin percentage 66.6% 61.6%
OPERATING EXPENSES
GAAP operating expenses $1,122.5 $1,294.7
Adjustments:
Amortization of intangible assets (39.7) (52.0)
Transaction expenses (5.7) (4.5)
Additional Cynosure related expenses (3.2) -
Contingent consideration adjustment (0.3) (1.7)
Integration/consolidation costs (7.9) (10.9)
MDR expenses (2.5) -
Litigation settlements (0.7) (4.5)
Restructuring and divestiture charges (15.3) (6.6)
Non-income tax settlement adjustment 2.9 -
Purchased research and development asset charges - (4.5)
Impairment of intangible asset and equipment (4.4) (106.7)
Acquisition related adjustments 3.8 -
Non-GAAP operating expenses $1,049.5 $1,103.3
32
Continued on next pageReconciliation of GAAP to Non-GAAP (unaudited)
$s in millions, except earnings per share
Years Ended
September 26, 2020 September 28, 2019
OPERATING MARGIN
GAAP income (loss) from operations $1,105.0 ($123.8)
Adjustments to gross profit as detailed above 288.9 904.6
Adjustments to operating expenses as detailed above 73.0 191.4
Non-GAAP income from operations $1,466.9 $972.2
OPERATING MARGIN PERCENTAGE
GAAP operating margin percentage 29.3% (3.7%)
Impact of adjustments above 9.5% 32.6%
Non-GAAP operating margin percentage 38.8% 28.9%
PRE-TAX INCOME
GAAP pre-tax earnings (loss) $1,001.9 $(257.7)
Adjustments to pre-tax earnings (loss) as detailed above 361.9 1,096.0
Debt extinguishment loss and debt transaction costs - 1.6
(Gain) Loss on sale of available-for-sale marketable securities - (0.9)
Loss from SSI (1.5) 1.5
Unrealized losses (gains) on forward foreign currency contracts (3.8) 2.1
Other charges 0.5 -
Non-GAAP pre-tax income $1,359.0 $842.6
NET INCOME
GAAP net income (loss) $1,110.5 $(203.6)
Adjustments to GAAP net income (loss) as detailed above 357.1 1,105.3
Tax benefit of internal reorganization - (19.2)
Discrete tax benefit from sale of Cynosure (313.4) -
Income tax effect of reconciling items 2 (104.4) (223.2)
Non-GAAP net income $1,049.8 $659.3
Net loss attributable to non-controlling interest (3.4) -
Non-GAAP net income attributable to Hologic $1,053.2 $659.3
EARNINGS PER SHARE
GAAP earnings (loss) per share – Diluted $4.21 $(0.76)
Adjustments to net earnings (as detailed below) (0.23) 3.19
Non-GAAP earnings per share – Diluted 1 $3.98 $2.43
ADJUSTED EBITDA
Non-GAAP net income $1,053.2 $659.3
Interest expense, net, not adjusted above 112.2 135.3
Provision for income taxes 309.1 183.3
Depreciation expense, not adjusted above 83.1 91.0
Adjusted EBITDA $1,557.6 $1,068.9
1Non-GAAP earnings per share was calculated based on 264,613 and 271,263 weighted average diluted shares outstanding for the years ended September 26, 2020 and September 28,2019 respectively. ² To
33
reflect an annual effective tax rate of 22.75% and 21.75% on a non-GAAP basis for fiscal 2020 and 2019, respectively.Reconciliation of GAAP to Non-GAAP (unaudited)
$s in millions, except earnings per share
Three Months Ended
March 27, 2021 March 28, 2020
GROSS PROFIT
GAAP gross profit $1,085.8 $395.8
Adjustments:
Amortization of acquired intangible assets 64.5 62.9
Impairment of intangible assets and equipment - -
Integration/consolidation costs 0.6 0.4
Fair value write-up of acquired inventory sold 2.3 1.9
Non-GAAP gross profit $1,153.2 $461.0
GROSS MARGIN PERCENTAGE
GAAP gross margin percentage 70.6% 52.3%
Impact of adjustments above 4.4% 8.7%
Non-GAAP gross margin percentage 75.0% 61.0%
OPERATING EXPENSES
GAAP operating expenses $289.0 $239.4
Adjustments:
Amortization of acquired intangible assets (10.2) (10.1)
Impairment of intangible asset and equipment - -
Transaction expenses (4.5) (1.4)
Acquisition related adjustment - -
MDR expenses (2.4) (0.4)
Contingent consideration adjustments 14.7 0.5
Purchased research and development asset charges (7.0) -
Integration/consolidation costs (3.6) (2.6)
Restructuring and divestiture charges (1.6) (2.9)
Non-income tax benefit 3.3 -
Non-GAAP operating expenses $277.7 $222.5
Continued on next page 34Reconciliation of GAAP to Non-GAAP (unaudited)
$s in millions, except earnings per share
Three Months Ended
March 27, 2021 March 28, 2020
OPERATING MARGIN
GAAP (loss) income from operations $796.8 $156.4
Adjustments to gross profit as detailed above 67.4 65.2
Adjustments to operating expenses as detailed above 11.3 16.9
Non-GAAP income from operations $875.5 $238.5
OPERATING MARGIN PERCENTAGE
GAAP operating margin percentage 51.8% 20.7%
Impact of adjustments above 5.1% 10.8%
Non-GAAP operating margin percentage 56.9% 31.5%
PRE-TAX INCOME
GAAP pre-tax (loss) earnings $780.5 $118.9
Adjustments to pre-tax (loss) earnings as detailed above 78.7 82.1
Debt extinguishment loss - -
Debt transaction costs - -
Gain from SSI - -
Unrealized losses (gains) on forward foreign currency contracts (4.6) (3.7)
Other - (0.5)
Non-GAAP pre-tax income $854.6 $196.8
NET INCOME
GAAP net (loss) income $619.4 $94.8
Adjustments to GAAP net (loss) income as detailed above 14.1 5.4
Amortization of acquired intangible assets 74.7 73.0
Impairment of intangible assets and equipment - -
Contingent consideration adjustment (14.7) (0.5)
Income tax effect of reconciling items 2 (20.3) (22.7)
Non-GAAP net income $673.2 $150.0
Net loss attributable to non-controlling interest (0.9) (0.9)
Non-GAAP net income attributable to Hologic $674.1 $150.9
EARNINGS PER SHARE
GAAP (loss) earnings per share – Diluted $2.38 $0.36
Adjustments to net earnings (as detailed below) 0.21 0.21
Non-GAAP earnings per share – Diluted 1 $2.59 $0.57
ADJUSTED EBITDA
Non-GAAP net income $674.1 $150.9
Interest expense, net, not adjusted above 21.0 30.0
Provision for income taxes 181.3 46.8
Depreciation expense, not adjusted above 20.3 20.6
Adjusted EBITDA $896.7 $248.3
¹Non-GAAP earnings per share was calculated based on 260,749 weighted average diluted shares outstanding for the three months ended March 27, 2021 and 267,114 for the three months ended March 28,
35
2020.2 To reflect an effective tax rate of 21.22% on a non-GAAP basis for the three months ended March 27, 2021 and 23.82% for the three months ended March 28, 2020.Reconciliation of GAAP to Non-GAAP EPS Guidance
Guidance Range
Quarter Ending June 26, 2021
Low High
GAAP Net Income Per Share $0.74 $0.89
Amortization of acquired intangible assets $0.30 $0.30
Other charges $0.03 $0.03
Tax Impact of Exclusions $(0.07) $(0.07)
Non-GAAP Net Income Per Share $1.00 $1.15
36You can also read