Ajinomoto Co., Inc. (2802) Forecast for FY2019 (Ending March 31, 2020) with Outlook - Takaaki Nishii President & CEO November 6, 2019

Page created by Jessie Deleon
 
CONTINUE READING
Ajinomoto Co., Inc. (2802) Forecast for FY2019 (Ending March 31, 2020) with Outlook - Takaaki Nishii President & CEO November 6, 2019
Ajinomoto Co., Inc. (2802)
Forecast for FY2019 (Ending March 31, 2020)
with Outlook

Takaaki Nishii
President & CEO

November 6, 2019
Ajinomoto Co., Inc. (2802) Forecast for FY2019 (Ending March 31, 2020) with Outlook - Takaaki Nishii President & CEO November 6, 2019
Contents
     I.    Financial Statements for the Interim Period Ended September 30, 2019
           and Forecast
     II.   Progress on Initiatives for the Next Medium-Term Management Plan
     Reference Material
     Appendixes: Consolidated Results Interim Period Ended September 30, 2019
                        FY2019 Revised Forecast by Segment

Note: Business profit (consolidated) in this material:
      Sales - Cost of sales - Selling expenses, Research & development expenses and General & administrative
      expenses + Share of profit of associates and joint ventures
Ajinomoto Co., Inc. (2802) Forecast for FY2019 (Ending March 31, 2020) with Outlook - Takaaki Nishii President & CEO November 6, 2019
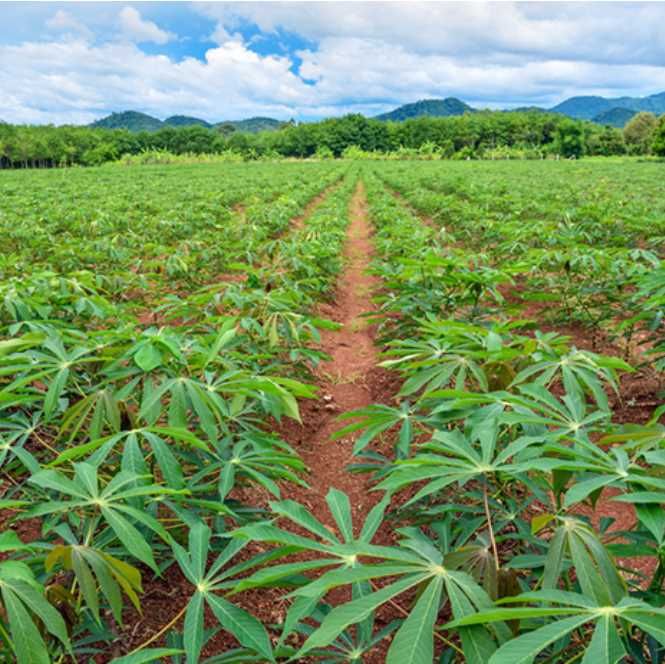
I-1. Financial Statements for the Interim Period Ended September 30, 2019

   Despite robust performance of the food products business (except for Vietnam and PH*), sales decreased
   due to a slump in the animal nutrition business, but profit increased.
                                                                                                                    *Promasidor
                  Year-on-Year                                   Sales                            Business profit   Holdings Limited
               (% increase/decrease)

        1Q-FY19                                                    -1%                                +28%
        2Q-FY19                                                    -1%                                 -11%
        1H-FY19                                                    -1%                                 +7%
        Excluding currency translations
                                                                  (-0%)                               (+9%)
        and exchange rates in trade

    • Effect of exchange rates in translation and trade in 1H: Sales - ¥6.4 bil., BP - ¥0.4 bil.
   Downward revision of the initial forecast for FY2019. Sales will be at the level of the previous year, but
   business profit will be lower.

                                                             Sales                              Business profit
        FY2019
                                                         ¥1,138.5 bil.                              ¥88.0 bil.
        Revised forecast
        (Versus initial forecast)                              -2%                                    -9%

        (Versus previous year)                                 +1%                                    -5%

★For details, refer to handout material: Consolidated Results Interim Period Ended September 30, 2019
                                    Copyright © 2019 Ajinomoto Co., Inc. All rights reserved.                                   1
Ajinomoto Co., Inc. (2802) Forecast for FY2019 (Ending March 31, 2020) with Outlook - Takaaki Nishii President & CEO November 6, 2019
I-2. Summary by Segment for Interim Period Ended September 30, 2019

        ◆ If the animal nutrition business is exempted, the food products and AminoScience businesses
          remained robust.
                                                                                              Versus previous year (Unit: ¥billion)
                         Vs.                                                                        Vs.
        Segment        previous           Comments                          Segment               previous          Comments
                         year                                                                       year

Japan Food                                                         International Food                               Revised down
Products                                                           Products                                  Impact of Vietnam
                                  Decline in sales of coffee                                                 distribution inventory,
Sales                    -0.7                                      Sales                           -1.9      impact of exchange rates,
                                  and bakery products, etc.
                                                                                                             etc. (about the same as
                                                                                                             the previous year on local
                                                                                                             currency base)

                                                                                                             Impact of impairment loss
Business profit          2.3      Robust overall                   Business profit                  2.7
                                                                                                             on PH trademark rights:
                                                                                                             -3.8
Life Support                            Revised down               Healthcare

Sales                    -6.9     Animal nutrition business        Sales                            1.1      Amino acids robust
                                  Impact of African swine
                                  fever

Business profit          -2.3                                      Business profit                  0.7

                                      Copyright © 2019 Ajinomoto Co., Inc. All rights reserved.                                           2
Ajinomoto Co., Inc. (2802) Forecast for FY2019 (Ending March 31, 2020) with Outlook - Takaaki Nishii President & CEO November 6, 2019
I-3. Revised Forecast for FY2019                                       Animal Nutrition Business

External Environment of Animal Nutrition Business
• The area affected by African swine fever has spread from China to eastern Asia and eastern Europe, and many
  think the impact will be prolonged as there is no vaccine.
• Sharp decline in number of pigs farmed and production of animal feed in China, which accounts for 40–50%1 of
  global pork production.
  ⇒ Stiffening price competition due to increase in amino acid exports from China.
• Market prices for lysine, threonine, and tryptophan all on downward trend at same time.
  ⇒ Expected to remain low in going forward due to continuation of challenging external environment.

            China Pig Feed Production1
                                                                         Market prices1 for lysine, threonine, and tryptophan

                                                                                                                        projected

   1: Estimated values by Ajinomoto Co.
                                                                                                                                    3
                                          Copyright © 2019 Ajinomoto Co., Inc. All rights reserved.
Ajinomoto Co., Inc. (2802) Forecast for FY2019 (Ending March 31, 2020) with Outlook - Takaaki Nishii President & CEO November 6, 2019
I-4. Factors Influencing Revised Forecast of Business Profit for FY2019

              Exchange rate                                       Exchange rate                                                          Exchange rate
                 $=110                                               $=110                                                                  $=107
(¥ bil.)                                                                                                    -5% (+4.6 bil.)
   120

   115
                                   +4% (+4.3 bil.)
                                                                                              Includes raw materials and fuels:
   110                                                                                        +¥4.7 bil. and exchange rate
                                                                                              (translations, trade): -¥0.2 bil.
   105
                                                                                                        -9% (+9.0 bil.)
   100                                - 3.6
                       10.8                            - 2.8
    95
                                                                                       - 5.0                 3.7
    90                                                                                 *Includes PH                      - 7.7
                                                                                       impairment
    85
           92.6                                                         97.0           loss -¥3.8 bil.

    80
                                                                                                                                          88.0
    75

    70
           FY18         Business       Fermentation Exchange rate          FY19         International        Umami      Animal nutrition FY19FY19
                                                                                                                                               Revised
           actual        growth       raw materials, (translations +       initial     seasonings &      seasonings for                    forecast
                                                                                                                                             revised
                                     fuel prices, etc.    trade)         forecast        processed         processed                        forecast
                                                                        (Announced          foods          food mfrs.
                                                                          in May)
                                                                                      (International Food Products) (Life Support)

                                                Copyright © 2019 Ajinomoto Co., Inc. All rights reserved.                                                4
Ajinomoto Co., Inc. (2802) Forecast for FY2019 (Ending March 31, 2020) with Outlook - Takaaki Nishii President & CEO November 6, 2019
I-5. Recording of Impairment Loss in Interim Period Ended September 30, 2019

   Recorded impairment loss and impairment loss on investment accounted for using the equity method
                                                                                                               (Unit: ¥billion)

                                       Operating profit Profit attributable
  Impact on each
                       Business Profit  Profit before   to owners of the                           Comments
   level of profit                                      parent company
                                        income taxes

                                                                                        Life Support: animal nutrition
(1) Animal nutrition          -                          14.9                    11.7
                                                                                        Production equipment

                                                                                       International Food Products:
                                                                                       seasonings & processed foods
                              -                            4.2                     4.2
(2) Promasidor                                                                         Impairment loss on investment
Holdings Limited                                                                       (goodwill)

                                    3.8                    3.8                     3.8 Trademark rights

                                                                                       Japan Food Products:
(3) Bakery
                              -                            3.8                     2.9 seasonings & processed foods
business
                                                                                       Production equipment

Total                              3.8                  26.9                    22.8

                                     Copyright © 2019 Ajinomoto Co., Inc. All rights reserved.                                    5
Ajinomoto Co., Inc. (2802) Forecast for FY2019 (Ending March 31, 2020) with Outlook - Takaaki Nishii President & CEO November 6, 2019
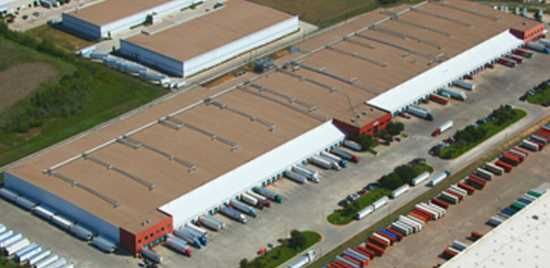
I-6. Profit for FY2019

        Given financial results in 2Q, revised profit for FY2019 down due to recording of some additional
        expenses brought forward for asset light measures.

                                                              FY19          FY19                                      Vs.
                                                                                          Vs. initial    FY18
                   (¥ Billion) -: losses                    Revised         Initial                                 previous                Comments
                                                                                          forecast       Actual
                                                            forecast      forecast                                    year
Sales                                                          1,138.5       1,171.0             -32.6   1,127.4         11.0

                                                                                                                                Of which PH impairment loss:
Business profit                                                   88.0            97.0            -9.0      92.6         -4.6
                                                                                                                                -3.8

Other operating income & expenses                                -45.9            -14.3          -31.6      -39.4        -6.4
   Impairment losses                                             -23.3        -                  -23.0      -34.6        11.6 2Q/FY19:-23.0
   Other                                                         -22.6            -14.3           -8.6       -4.7       -18.2 Structual reform costs: -15.0
Operating profit                                                  42.0            82.6           -40.5      53.1        -11.0
Financial income & expenses                                        0.1             0.3            -0.1        1.0        -0.8
Profit before income taxes                                        42.2            83.0           -40.7      54.2        -11.9
                                                                                                                                Tax rate: Initial forecast: 28.7%,
Income taxes                                                     -15.0            -23.8            8.7      -17.7         2.6
                                                                                                                                revised forecast: 35.7%
Profit (includes discontinued operations)                         27.2            59.2           -32.0      39.0        -11.8
   Profit attributable to owners of the parent company            18.0            50.0           -32.0      29.6        -11.6
   Profit attributable to non-controlling interests                9.2             9.2             0.0        9.3        -0.1
                                               Copyright © 2019 Ajinomoto Co., Inc. All rights reserved.                                                        6
Ajinomoto Co., Inc. (2802) Forecast for FY2019 (Ending March 31, 2020) with Outlook - Takaaki Nishii President & CEO November 6, 2019
I-7. Progress on the FY2017–2019 (for 2020) Medium-Term Management Plan
   ■Sales                                                                        ◆ Business profit
    (¥ bil.)    % (YoY change)                                                   ▲ Profit attributable to owners of the
      15,000                                                                       parent company                          (¥ bil.)
       1,500
                                                                                                                          1,400
                                                                                                                             140

                                               1,127.4                      1,171.0                     1,138.5           1,200
                                                                                                                             120
                         1,114.7
                                                (+1%)                       (+3%)                        (+1%)
       1,000
      10,000                                                                                                              1,000
                                                                                                                             100
                                                                              97.0
                           95.6                  92.6                                                    88.0             80080
                                                                             (+4%)
                                                                                                         (-5%)
                                                (-3%)
                                                                                                                          60060
       5,000
        500
                           60.1                                                                                           40040
                                                                              50.0
                                                                            (+68%)                       18.0
                                                 29.6                                                                     20020
                                               (-50%)                                                    (-39%)
        0                                                                                                                     0
            0                                                                                                             0
                          -38.0                 -37.3                        -38.8                       -38.8
 ■ Group shared         Percent of            Percent of                   Percent of                                        -20
 ■全社共通費                sales: 3.3%                                                                     Percent of         -200
   costs included in                         sales: 3.3%                  sales: 3.3%
  内数                                                                                                  sales: 3.4%
   sales figures                                                                                                             -40
                                                                                                                          -400

                            FY17                FY18                          FY19                     FY19
                            Actual              Actual                  Initial forecast          Revised forecast
Business profit              8.6%                8.2%                        8.3%                        7.7%
margin
ROE                          9.6%                4.7%                        8.0%                        3.0%

ROA                          6.9%                6.6%                        6.5%                        6.2%

EPS                        ¥105.76              ¥53.62                      ¥91.30                      ¥32.84

                                     Copyright © 2019 Ajinomoto Co., Inc. All rights reserved.                                        7
I-8. Approach to Shareholder Returns in FY2019

            Will achieve shareholder returns in line with initial forecast in FY2019 despite downward revision

Cash Flow                                    Investments for Growth                                         Shareholder Returns

      Operating cash flow:                                                                                            Payout ratio: target 30% per FY
                                                 Engage in integrated management of
     approx. ¥350 bil. (3 yrs.)                          CapEx, R&D, M&A                                                FY18 actual: ¥32 (annual)
                                              - R&D: approx. ¥29.0 bil. per FY                                          FY19 forecast: ¥32 (annual)
                                              - CapEx:
     EBITDA to sales ratio:                       FY18 actual, approx. ¥79.6 bil.
                                                                                                                  Forecast total shareholder return: 50.9%
     upper half of 13% level                      FY19 forecast, approx. ¥81.5 bil.
                                                                                                                  (excluding impairment loss)
                                                  1H-FY19 actual, approx. ¥40.7 bil.

                                                                        Dividend per share (¥)                                                                Payout ratio
                                                                                                                               (excluding                             (%)
                                                                                                                               impairment loss                        70
                                                                            34                    Dividends per share
・ R&D: FY18 ¥27.8 bil.; 1H-FY19 actual: ¥13.8 bil.                                                                             34.8%)                        97.4
・Capex:                                                                     32                    Payout ratio                                                        60
 FY18 strategic investment 53%, maintenance investment 47%                  30
                                                                                                                                                                      50
 FY19 strategic investment 59%, maintenance investment 41%                  28                                                                        59.7
 (FY17-19 plan: ¥230.0 bil. FY17-19 projected: ¥240.5 bil.)                       36.7
                                                                            26                                                  33.9 32.3    30.0                     40
                                                                                           26.1                         30.6
                                                                                                             29.1
                                                                            24
・M&A: finance by using interest-bearing debt                                                         24.2                                                             30
                                                                            22
      (aim for D/E ratio of 50%; March 31, 2019 actual: 36.3%;                                                                   28     30       32    32    32
                                                                            20                                                                                        20
      September 30, 2019 actual: 37.6%)                                                                                  24
                                                                            18
                                                                                                                 20                                                   10
・Aim to repurchase non-controlling interests by FY19 end                    16
                                                                                   16       16
                                                                                                      18
                                                                            14                                                                                        0
Net debt is interest-bearing debt - Cash on hand and in banks x 75%

                                            Copyright © 2019 Ajinomoto Co., Inc. All rights reserved.                                                                      8
Contents
     I.    Financial Statements for the Interim Period Ended September 30, 2019
           and Forecast
     II.   Progress on Initiatives for the Next Medium-Term Management Plan
     Reference Material
     Appendixes: Consolidated Results Interim Period Ended September 30, 2019
                        FY2019 Revised Forecast by Segment

Note: Business profit (consolidated) in this material:
      Sales - Cost of sales - Selling expenses, Research & development expenses and General & administrative
      expenses + Share of profit of associates and joint ventures
II-1. Growth Strategy
               International Food Products: Seasonings (GROW 1)
      ◆ Actively expand savory business through expansion of flavor seasonings, which have a large market,
       and menu-specific seasonings, which have high growth potential, based on umami seasonings.

                                 • Expand variety based on demand                            (Specific seasonings)
Economic growth
 (GDP growth)                    • Expand in new target countries
                                                                         Expansion
                             (Multi-purpose                            associated with
                             seasonings)         FY2019 LC            economic growth
                                              growth rate: +4%
            FY2019 LC
          growth rate: -1%        Expansion
         (excluding             associated with                                                                                    FY2019 LC
         Vietnam: +6%)         economic growth                                                                                  growth rate: +11%

                                                                                            Menu-specific seasonings

                                                        Flavor seasonings
                                                                                         (Ref) Powder menu-specific seasonings market
                                                                                         growth rate
                                                   (Ref) Flavor seasonings market
               Umami seasonings                    growth rate
                                                                                         FY2017→FY2018 Ajinomoto Co. research
                                                                                         3 country total (Thailand, Indonesia, Vietnam): +10%
                                                   FY2017→ FY2018 based on
            (Ref) Umami seasonings market          Ajinomoto Co. research
            growth rate                            Global total: +4%
            FY2017→FY2018 based on
            Ajinomoto Co. research
            Global total: 0%

                                                                                                               Expand product categories

                                                  Copyright © 2019 Ajinomoto Co., Inc. All rights reserved.                                         9
II-1. Growth Strategy
                  International Food Products: Seasonings (GROW 1)
        ◆ Business with resilience despite low GDP growth and emergence of local manufacturers.
        ◆ Accelerate growth by providing solutions to global health issues.

1. Ensure competitive advantage
         Development of products
                                                         No. 1 brand                                     Reaching customers
          adapted to the locality          ×       (Communication capabilities)             ×           (Delivery capabilities)
          (Creative capabilities)

      Be particular about raw materials        Become a trusted brand by sharing                 Achieve store exposure that makes our
      and ingredients, locally-based           information via TV commercials,                   products stand out through traditional
      product development and untiring         social media, etc. on how to use in               trade visits with strong customer
      quality enhancement                      key menus                                         connections and follow-up with modern
                                                                                                 trade/convenience store tracking
2. Provide solutions to global health issues (e.g. low salt)

                                          Cut sodium         Use umami to reduce salt
                                          at least 30%       without loss of flavor!
                                                                                                               Organic growth +
                                                                                                               Growth of solution provision
       1 cup salt          ½ cup salt + ½ cup MSG

      Provide solutions for global health issues
      to create both social and economic value                                                                Image of local currency-based
                                                                                                              total savory sales growth

                                            Copyright © 2019 Ajinomoto Co., Inc. All rights reserved.                                         10
II-1. Growth Strategy
                   Electronic materials business (GROW 2)
      ◆ Growth in communications applications with advent of 5G
      ◆ Steady growth in number of data center servers due to expansion of cloud services market
      → Business growth due to expansion into domains adjacent to the PC domain (communication applications
        and servers)

         Logic IC product market forecast                                          Ajinomoto Co. sales trends and ratio by application
              (when 2012 market is 100)    Based on Ajinomoto Co. research                  (when FY2016 sales are 100)
150                                                                                160

140                                                                                      CAGR 2017–19, 11.0% (forecast)
                                                               139                 140
             CAGR 2017–19, 6.0%
130                                                  134
120                                       125                                      120

110                                                                                100
                    112    111     112                                                                                                  62%
100          105                                                                                                          61%
       100                                                                         80                      56%
90                                                                                         48%
      2012   2013   2014   2015   2016    2017      2018      2019
                                                                                   60
         Data center server number forecast
20                                               Based on Ajinomoto Co. research
                                                                                   40
             CAGR 2017–22, 7.2%
15                                                                                         52%             44%            39%           38%
                                                                                   20

10
                                                                                    0
                                                                                         FY2016          FY2017         FY2018    FY2019 forecast FY2020(予想)
                                                                                                                                   FY2019(見込)
 5                                                                                                 PCs            Servers, telecommunications, etc.
                                                                                                   パソコン           サーバー、通信用途         他
                                                                                                       Drastic reduction in the PC area,
 0                                                                                                     with growth in other areas (servers,
      2016 2017 2018 2019 2020 2021 2022 2023 2024 2025                                                telecommunications, etc.)
                                           Copyright © 2019 Ajinomoto Co., Inc. All rights reserved.                                                  11
II-1. Growth Strategy
                     Pharmaceutical custom manufacturing (GROW 3)
◆ Aim to acquire next-generation formulation development project through expansion of new technology domains (ADC1)
◆ Growth of oligonucleotides business in Japan and Europe based on Ajiphase technology2
→ Integrate the operation of Japanese, European, U.S., and Indian sites as Ajinomoto Bio-Pharma Services and aim to further expand
  CDMO3 business as a partner that meets the needs of global pharmaceutical companies

                                                  Target contracts in FY2019                 Commercial pharmaceuticals: 55 or more
                                                                                             Drug development: 152 or more

               Global CDMO market growth                                 Ajinomoto Co. pharmaceutical custom manufacturing sales
               (when FY2016 market size is 100)   Based on Ajinomoto                         (when FY2014 sales are 100)
                                                  Co. research
200                                                                       200

150                                                                       150

100                                                                       100

 50                                                                        50

  0                                                                         0
                                                            (Year)                2014        2015      2016   2017        2018    2019        (FY)
        2016       2017       2018       2019        2020
                                                                                                                                  (forecast)
   1. ADC: Antibody-drug conjugate
   2. Ajiphase technology: the only practical technology that makes it possible to mass produce oligonucleotides
   3. CDMO: Contract Development & Manufacturing Organization
                                            Copyright © 2019 Ajinomoto Co., Inc. All rights reserved.                                                 12
II-2. Non-Financial Initiatives                                                *ASV: The Ajinomoto Group Creating Shared Value

               ASV* Value Creation                                                        Major Initiatives
                     Stories                                 Progress toward FY2020 target: Exceeded ◎; In-line 〇; Below △

           1                                           ・Promote initiatives to improve nutrition ◎
           We contribute to health and well-
                                                     - Increased activities based on our Nutrition Policy in each region in FY2018
           being by utilizing our leading-edge
           bioscience and fine chemical              - Planning to establish key initiatives that leverage our Specialty in the next MTP as we
           technologies which also leads to            work toward further strengthening
           deliciousness technologies, and by          → Redefining quantitative targets and working to improve nutrition and solve
 Social                                                    health issues
           delivering good and healthy food

   S       2                                          ・Steadily increase smart cooking ○
           We contribute to the development            - Popularize smart cooking using simple to prepare foods such as frozen foods and
           of a society that enables strong              soups
           family/social bonds and diverse
                                                       - Grow via expansion of menu-specific seasonings
           lifestyles through eating well
                                                       - Grow via business expansion of Integrated Food Solutions for food services in Japan

           3
                                                      ・Promote various initiatives in line with environmental targets ○
           We contribute to the sustainability of    - Contribute to achieving recycling-oriented society (realize zero plastic waste), initiatives to
Environ-   society and the earth, with our             develop monomaterials and reduce plastic consumption (partially replace with paper)
 mental    customers and local communities,          - Initiatives to deal with climate change (respond to TCFD recommendations and disclose
           across the value chain from                 information appropriately)
   E       production to consumption                   Implementing Southeast Asia MSG scenario analysis and considering total reduction targets
                                                       while preparing to apply for science based targets (SBTs) and participation in RE100

           4                                          ・Attain innovation by improving engagement (productivity) ◎
Gover-
           We co-create value with each region        - FY2018: Change work style: be able to work anywhere
nance      through the perspectives of the                      1,820 total actual working hours, accelerate telecommuting including
   G       customers, with our global, top-class                manufacture department
           and diverse talents                        - FY2019: Engage in improving work style quality through digital transformation

                                              Copyright © 2019 Ajinomoto Co., Inc. All rights reserved.                                              13
II-2. Non-Financial Initiatives                                     Environment: Initiatives to Address Climate Change

     We analysed a scenario using the Southeast Asian MSG business as a model from the perspective of raw
     material and fuel costs, production sites and taxes, assuming warming has progressed and average
     temperatures are up by 2 ℃ in 2050.

                                      ▲ Risk of disease and pest damage

                                                                                               Plan to roll out global analysis
                                                〇 Yield increase if 5 ℃ or less
                                                                                                          MSG other countries and regions
                                                                                                          Food (meat and vegetables)
                                                       〇 Cassava utilization
                      △ Risk of drought and              rate unchanged
                        flooding

                             〇 Balance of water
                               demand and supply

                         ×Carbon tax risk

〇 No effect from                       × Risk of increase in price of heavy
  rising sea levels                      oil and gas
                                       ⇒ Global effect

                                              Copyright © 2019 Ajinomoto Co., Inc. All rights reserved.                                14
II-3. Toward the Next Medium-Term Management Plan                                                                Roadmap

                                                                                         FY20–22MTP                                      From FY23
 Roadmap                              FY17–19 MTP
                                                                                        Structural reform                              Ideal structure
 Strategic scenarios                          FY19                        FY20           FY21          FY22                              Create the next
   and measures                                                Reduced assets                            Return to                     business capable of
                                    Start some ahead                                                                                  highly efficient growth
                                                                via asset light                           growth
                                       of schedule
                                                              (scale of ¥100 bil.)
                                                       Selection and              Asset light in
                                                      concentration of             non-core
                                                       growth areas               businesses                                          Become a global top
                                                                                                                                         10 class food
                                                       Preparatory investments for growth                                                  company

            Key business                      Approx.                                       Promote DX          Approx.                     Approx.
               ratios                          60%                                                               70%                         80%
Company-       Sales growth                                                      Temporary growth
wide
financial
               rate                              2% (CAGR)                       slowdown due to                   4.0% (YoY)
targets                                                                          reduction of assets                                  4% or more (CAGR)
               Business profit                   7.7%                                           1% (CAGR)             10%
               margin
                                                                                                                                              13%
               ROE                 FY19                                  FY20–                         FY22
                                                 3.0%                      21
                                                                                                                      10%
                                  revised                                                              target                                 11%
               ROIC              forecast        3.0%                     plan                                      8%    or more
                                                                                                                                            11–13%
               ROA (BP basis)                    6.2%                                                                 8%
                                                                                                                                              12%
Financial      Operating cash    ¥350 bil. (3 yrs.)
strategies     flows                                                             Returns to shareholders:
                                                                                 over ¥100.0 bil.
               Shareholder       Single fiscal year dividend
               returns
                                                                                                                                    Achieve stable returns
                                 payout ratio of 30%; total
                                                                                                                                    to shareholders
                                 shareholder return above 50%                                                                                            11
                                                       Copyright © 2019 Ajinomoto Co., Inc. All rights reserved.                                         15
Focus on Core
               II-3. Toward the Next Medium-Term Management Plan                                                     Businesses

         Identified non-core businesses and started working on structural reform from this fiscal year.

       High                                                                        Core businesses
                     Businesses considered
                                                                       Prioritize investment, accelerate growth
                     for efficiency
                       Potential for greater
                                                 Yes
                       efficiency                                                           Asian cuisine              QN*
                                                                   Seasonings
                       Presence of brand &                                                  frozen foods        (Processed foods)
                       technological superiority
                       (potential to be in the                      Integrated
                                                                                                                  Life Support
                                                                  Food Solutions                Healthcare
                       global top 3)                            (Industrial ingredients)
                                                                                                               (Electronic materials)
Growth rates
                                     No
  in target                                                                                          *QN:Quick Nourishment
  markets
                                                                                                  Yes
                             Non-core businesses                                           Businesses with re-built
                       Some Mexican and Italian foods in                                   growth strategies
                       frozen foods (excluding appetizers)                                         Potential for greater growth
                       Parts of the seasonings for processed                                       Presence of brand &
                       food business                                                       No      technological superiority
                       Parts of the animal nutrition business                                      (potential to be in the global
                                          Reduce, exit, or structural reform                       top 3)
                                          (start in FY2019, aim for FY2021)
                                                                                                                                        ROA
               Low       7% or less                         7–13%                                            13% or more
                                                                                                                                        16
                                    Copyright © 2019 Ajinomoto Co., Inc. All rights reserved.
II-4. Asset Light Measures                                                             1. Global Frozen Foods Business

  1. Reduce fixed assets by ¥4.5 billion from FY2020 through asset light management
        Planning on reorganizing production globally (from 19 plants to 15 in North America, Europe, China, and Thailand) (proceeding
        with further review)

      Europe: 3 plants
                                              North America:
                          China: 3 plants       10 pants

                     Thailand: 3 plants

                                                                      July 2020: Close AFNA Fort Worth plant
                                                                      →Transfer production to Oakland plant
        As of 2019                                                                                                           3. Increase ROA
 2. Accelerate investment in core businesses                                                                                 • Focus on growth fields
       Accelerate capital investment to meet Asian food demand in North                                                      • Streamline assets
       America and Europe
 Asian cuisine frozen foods market in                                                                                        Aim for 7% ROA in frozen
 North America and Europe (forecast)        (Based on Ajinomoto Co. research)
                                                                                                                             foods business by FY2022
(1 million USD)
                                                    North America market: 2018-28 CAGR (forecast) +3.9%
    North America
    Europe
                                                    Europe market: 2018-28 CAGR (forecast) +6.8%

                                                     2020: Expand fried rice production line at AFNA Oakland plant
                                                                                                                                                        17
                                                        Copyright © 2019 Ajinomoto Co., Inc. All rights reserved.
2. Umami Seasonings for Processed
          II-4. Asset Light Measures                                                   Food Manufacturers

1. Achieve consumer ratio of 80% during the next Medium-Term Management Plan: change the sales ratio by
   increasing sales to consumers and reduce industrial (external) sales to processed food manufacturers.
2. Gradually introduce low-resource fermentation technology. Streamline business assets, improve costs and
   increase per plant productivity.

                           Umami seasonings for processed food manufacturers
                                 (Consumer/industrial ratio, sales base)
           100%

                       33%                  29%                      28%                     20%
            80%

            60%
                       67%                  71%                      72%                    80%
            40%

            20%

            0%
                      FY11-13             FY14-16                   FY17-19                 FY20-22
                      actual
                       実績                   actual
                                             実績                    projected
                                                                     見込                      plan
                                                                                            計画値
                                           Consumer                Industrial

                                Copyright © 2019 Ajinomoto Co., Inc. All rights reserved.                               18
II-4. Asset Light Measures                                                 3. Animal Nutrition Business-1

                                                                                                   In-house production ratios
Main Points of Structural Reform                                            100%
 1. Further reduce ratio of in-house production while
     planning to thoroughly review commodities.                              80%
 2. Exploring external alliances, etc. in specialties.
     Growth through pipeline expansion.                                      60%

1) Reduce ratio of in-house production of lysine and                         40%
  threonine                                                                                                                    リジン
                                                                                                                               Lysine
      Continue reducing in-house production of lysine and                                                                      Threonine
                                                                                                                               スレオニン
                                                                             20%
      threonine in stages.
                                                                              0%
2) Business profit                                                                   FY17 actual
                                                                                      FY2017実績        FY18 actual FY19
                                                                                                       FY2018実績        projected FY20
                                                                                                                    FY2019見込          forecast
                                                                                                                                    FY2020予定
     Commodities expected to record loss in FY2019 due to                 Business profit
                                                                          (¥bil.)
     deterioration in market conditions.                                                     Profit in animal nutrition business
     • Difficult to achieve ¥5.0 billion in business profit in                60
                                                                               6.0                                                      5.0
        FY2020.                                                                4.0
                                                                              40          3.0
     Specialty affected by sluggish valine market conditions,                                             1.9
                                                                               2.0
                                                                              20
     in the red
                                                                                                                        -5.3
                                                                               00
                                                                                                                                  Plan to
                                                                             -2.0
                                                                            (20)                                                  revise in the
Going forward, expand Specialties and continue business                                                                           future
                                                                             -4.0
                                                                            (40)
structure reform
                                                                             -6.0
                                                                            (60)
                                                                                     FY17 actual     FY18 actual
                                                                                      FY2017実績         FY2018実績 FY19 projected Plan from FY20
                                                                                                                  FY2019見込         FY2020~
                                                                                                      Commodity
                                                                                                      コモディティ     Specialty
                                                                                                                 スペシャルティ             (計画)
                                                                                                                                                  19
                                       Copyright © 2019 Ajinomoto Co., Inc. All rights reserved.
II-4. Asset Light Measures                                          4. Resource Allocation

Asset Light Measures

 ・Resource allocation (Initiatives in progress)

    Repayment of loans through reflux of the Group’s cash
    and deposits

    Sale of policy shareholdings

    Reorganization of functional subsidiaries

    Reconsideration of JVs

                  Copyright © 2019 Ajinomoto Co., Inc. All rights reserved.                    20
II-5. Reinforcement of Management Foundation

       Establish “systems to promote continuous upgrading and streamlining” for a structure
       as a GGSC* by promoting “enhancement of operational quality and efficiency” and
       “high-level fostering of human resources,” not only in business activities but also in
       corporate divisions.
                                                                                                   *Global Genuine Specialty Company

                                             Review of function classifications
 Corporate             Manage
                                             and operations                                   Start JV with partner(s) good at raising
  systems              each function
                       individually
                                             Integrate management through                         work efficiency and continually
                                             corporate systems                                          improve efficiency

Shared costs      40                             37.3                    38.8

       (¥ bil.)
        [億円]
                  30       28.5

                  20

                  10

                   0
                       FY13 (actual)        FY18 (actual)          FY19 (forecast)          FY20 (expected)    FY22 (expected)

 % of sales               2.9%                  3.3%                    3.4%                                      2.5%
                                       Copyright © 2019 Ajinomoto Co., Inc. All rights reserved.                                         21
II-6. Approach to Investment and Shareholder Returns
         in the Next Medium-Term Management Plan

• Strengthen organic growth of core businesses with priority investments and bring about
  stable returns to shareholders.
• At the same time, aim for the global level of asset efficiency and work on structural reform
  by moving to asset light.

              Cash in                                                        Cash out
          Approx. ¥400 bil.                                               Approx. ¥400 bil.

                                                                       Investing CF
 Operating CF (approx. ¥350 bil.)                                    Approx. ¥300 bil.
                                                                 (CapEx: approx. ¥220 bil.,
                   +
                                                                   M&A approx. ¥80 bil.)
             Asset light
                  +
                Loans                                              Returns to shareholders
                                                                     More than ¥100 bil.

                        Copyright © 2019 Ajinomoto Co., Inc. All rights reserved.             22
II-7. Schedule of External Announcements for the Next
         Medium-Term Management Plan

February 19
    Announcement of the FY2020–2022 Medium-Term Management Plan

February 21
    Analyst briefing for the FY2020–2022 Medium-Term Management Plan

March 25
   IR-DAY (New)
   (scheduled: presentations by staff in charge of consumer foods
   business, AminoScience business and ESG)

                     Copyright © 2019 Ajinomoto Co., Inc. All rights reserved.   23
Contents
     I.    Financial Statements for the Interim Period Ended September 30, 2019
           and Forecast
     II.   Progress on Initiatives for the Next Medium-Term Management Plan
     Reference Material
     Appendixes: Consolidated Results Interim Period Ended September 30, 2019
                        FY2019 Revised Forecast by Segment

Note: Business profit (consolidated) in this material:
      Sales - Cost of sales - Selling expenses, Research & development expenses and General & administrative
      expenses + Share of profit of associates and joint ventures
Roadmap to a "Genuine Global Specialty Company"
Become a global top 10 class company with robust business structure

                                                                                                                                                                                                                             ¥150 bil.
                        Global top 10 class                                                                                                                                                                                  ¥130 bil.
                       food company level1)
                                                                                                                                                                                                    Sustainable  value creation
                                                                                                                                                                                                    Sustained growth    as a
                                                                                                          Become a global                                                                                       as a
                                                                                                                                                                                                         global top 101)

                                                                                                     top 10 class food company                                                                      Genuine   Global
                                                                                                                                                                                                      class food     Specialty
                                                                                                                                                                                                                  company
                                                                                                                                                                                                             Company
                                                                                                                                 FY19
                                                                      FY17 Actual                     FY18 Actual                                                                                  FY20 Target (Organic growth)
                                                                                                                            Revised forecast
                               Business profit                       ¥95.6 bil.                       ¥92.6 bil.              ¥ 88.0 bil.                                                          ¥137.0 bil.–
 Financial

                            Business profit margin                   8.6%                             8.2%                     7.7%                                                                10%
                                                                                                                                                                                                   10% or higher

                                                                                                                                                                  Rebuilding the growth strategy
                                    ROE                              9.6%                             4.7%                     3.0%
                                                                                                                                                                                                   Double-digit
                              EPS growth rate                        13%                              -49%                     -38%                                                                annual growth
                                                                                                      6%                                                                                           Double-digit
                            Intl. sales growth rate2)                5%4)                                                      3%                                                                  annual growth
                                                                     Meats: 7.2 mil. tons; 17.0%      7.2 mil. tons; 17.0%                                                                         Meats: 8.6 mil. tons; 19%
                                                                            (8.3 kg/person/yr)        (8.3 kg/person/yr)       -                                                                      In concert       with
                                                                                                                                                                                                          (9.7 kg/person/yr)    the
                    Meats and vegetables consumption                 Veg.: 4.4 mil. tons; 7.4%        4.4 mil. tons; 7.4%      -                                                                   Veg.: 5.5 mil. tons; 8%

                                                                                                                                                                                ↓
                                                                                                                                                                                                            next     MTP
 Non-financial3)

                                                                            (5.1 kg/person/yr)        (5.1 kg/person/yr)                                                                                  (6.2  kg/person/yr)

                       Contribution to eating together               60 occasions / household / yr    60 occasions / household / yr                                                                70 occasions / household / yr

                              Spare time created                     37 mil. hrs / yr                 37 mil. hrs / yr                                                                             38 mil. hrs / yr (6 hrs / household)
      3)                                                             (5 hrs / household)              (5 hrs / household)       -
                   Comfortable lifestyles (AminoScience) 19.80 mil. people                 19.90 mil. people                    -                                                                  22 mil. people
                                                          See the page after next
                    Resolution of environmental issues    (Non-Financial Initiatives (Environment): Progress)

                     Employees with high engagement                  79%                              No survey taken           -                                                                  80%
 Inte-
grated                       Brand value5)                           778 mil. USD                     852 mil. USD              -                                                                  1,500 mil. USD or more

  1. Global top 10 class status defined as business profit of ¥130.0 billion or higher with IFRS accounting standards.; 2. Consumer foods, local currency basis
  3. Refer to FY2017-2019 MTP (Feb. 17, 2017); 4. Includes Frozen foods; 5. Measured by Interbrand

                                                                   Copyright © 2019 Ajinomoto Co., Inc. All rights reserved.                                                                                             Reference 1
FY2019 Assumed Exchange Rate and Exchange Rate Sensitivity

        Assumed exchange rate (vs. JPY)                                   * Average rate during the period
                       FY19              FY19
                                                               FY19 Actual                        FY18         FY17-19
                       Initial         Revised
                     forecast          forecast              2Q                1Q                Actual*        MTP
        USD            110.00              107.00           107.36            109.90               110.92          100.0
        EUR            129.00              122.00           119.41            123.50               128.39          110.0
        THB              3.36                3.42             3.49              3.48                 3.43           2.80
        BRL             29.73               28.16            27.05             28.02                29.36           30.3

Exchange Rate Sensitivity
Foreign exchange rates (vs JPY)
                                                                       Impact of exchange rate for trade
                          Sensitivity of translation effects
         Avg. rate                to full year B.P.
                                                                       (Sensitivity of translation effects to full year B.P.)
                                                                       - 1 JPY             vs    USD       →   approx. ¥ 0 million
USD          107.00          ±¥1 → approx. ¥ 100 million
EUR          122.00              ±¥1 → approx. ¥ 50 million            - 0.1 EUR           vs    USD       →   approx. + ¥ 100 million

 THB            3.42       ±¥0.01 → approx. ¥ 100 million              - 1 THB             vs    USD       →   approx. + ¥ 500 million

 BRL          28.16              ±¥1 → approx. ¥ 300 million           - 0.1 BRL           vs    USD       →   approx. + ¥ 200 million

                                     Copyright © 2019 Ajinomoto Co., Inc. All rights reserved.                                  Reference 2
Non-Financial Initiatives (Environment): Progress
                                   *                          : FY2019 Actual & Targets
                                                                            FY2017           FY2018          FY2019         FY2020           FY2025              FY2030
           Initiatives                       Indicators
                                                                             Actual           Actual         Target         Target           Target              Target
                            Reduction rate of greenhouse gas
                            emission volume vs. emission intensity            35%             33%              37%            38%                                  50%
                            (vs. FY2005)
    Reduce
                            Renewable energy use ratio                        23%             24%              26%            28%                                  50%
    greenhouse gases
1                                                                                                                                          CFC elimination      Extremely
                            Chlorofluorocarbon (CFC) elimination                                                                           at new facilities   small volume
                                                                                                                                               100%              of HFCs

                            Reduction rate of food loss from receipt of
    Reduce food loss        ingredients through to customer delivery           -4%            -28%             15%            20%               50%
2                           (vs. FY2016)

                                                                            Palm oil 14%    Palm oil 25%                   Palm oil 100%                        The material
                            Sustainable procurement                       Paper 95% (JPN) Paper 95% (JPN)                   Paper 100%                         at issue 100%
    Secure food resources
    and protect natural
                           Introduction rate of factories that reduce
    environment, including
                           natural raw materials used via resource-
3   ecosystems and
                           saving fermentation technologies, by-              79%             79%                                              100%
    biodiversity
                           products and alternative material
                           technologies
    Conservation of         Reduction rate of water usage vs.
                                                                              77%             78%              78%            78%                                  80%
4   water resources         production volume unit (vs. FY2005)

                            Reduction of waste generated via                                                Maintain 99%   Maintain 99%    Maintain 99%        Maintain 99%
    3Rs for waste                                                            99.3%           99.2%            or higher      or higher       or higher           or higher
                            business activities/recycle ratio
    material (Reduce,
5   Reuse, Recycle)
                            Zero plastic waste                                                                                                                     Zero

                                                          Copyright © 2019 Ajinomoto Co., Inc. All rights reserved.                                                       Reference 3
Forward-looking statements, such as business performance forecasts, made in
these materials are based on management's estimates, assumptions and
projections at the time of publication. A number of factors could cause actual
results to differ materially from expectations.
This material includes summary figures that have not been audited so the numbers
may change.
Amounts presented in these materials are rounded down.
                    Copyright © 2019 Ajinomoto Co., Inc. All rights reserved.
You can also read