CAPITAL MARKETS DAY MARCH 14th, 2019 - Cision

Page created by Gerald Boyd
 
CONTINUE READING
CAPITAL MARKETS DAY MARCH 14th, 2019 - Cision
CAPITAL MARKETS DAY
MARCH 14th, 2019

                      0
CAPITAL MARKETS DAY MARCH 14th, 2019 - Cision
Welcome to Arcus’ Capital Markets Day

08:30 Registration and breakfast
09:00 Introduction …………………………………………………..                   Kenneth Hamnes, Group CEO

09:20 Spirits – Reignite profitable growth / Q&A ..…....   Erlend Stefansson, Group Director, Spirits

10:05 Wine – Continue strong performance / Q&A …...        Eirik Andersen, Group Director, Wine Norway
                                                           Øystein Gogstad-Andersen, Managing Director, Arcus Wine Brands

10.50 Break

11.00 Finance – Creating shareholder value / Q&A …...      Sigmund Toth, CFO

11:20 Questions from Financial Analysts ……………..…….         Preben Rasch-Olsen, Financial Analyst, Carnegie
                                                           Petter Nystrøm, Financial Analyst, ABG Sundal Collier

11:50 Closing remarks ………………………………………..……….                Kenneth Hamnes, Group CEO

12:00 End of Arcus’ CMD

                                                      1
CAPITAL MARKETS DAY MARCH 14th, 2019 - Cision
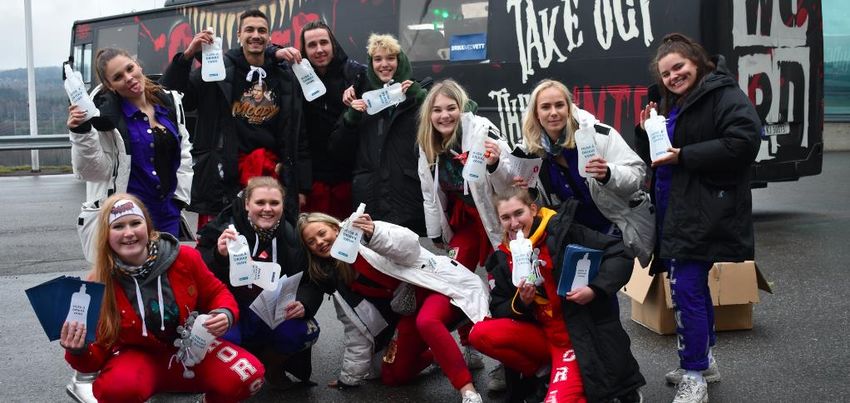
We are passionate about creating great moments

                      Bringing Nordic spirits to the world and importing
                       the world’s best wines and spirits to the Nordics

          SPIRITS                         WINE                  D I ST R I B U T I O N
      #1 in Norway                      #1 in Norway           #1 supplier to Vinmonopolet
      #2 in Denmark                     #2 in Sweden           ~30% market share HORECA
      #1 In Germany (Aquavit)           #4 in Finland          115 external customers

      #5 in Sweden
      #6 in Finland

                                                2
CAPITAL MARKETS DAY MARCH 14th, 2019 - Cision
The history of Arcus dates back to the 1800s

                                                                                                             Aalborg, Malteserkreuz
                                                                                                             and Gammel Dansk                Acquired Social Wines
                                                                                                             brands acquired from            in Finland                  Acquired the remaining
                                                                              Acquired wine company
                                                                              Excellars AS holding key       Pernod Ricard                   Acquired Swedish            50% of Det Danske
First LINIE Aquavit                                                           agencies such as Les           Separate management             Snälleröds-brands           Spiritus Compagni
travels around the                                                            Fumeés Blanches (51% +         and Board of Directors          Kenneth Hamnes new          Acquired BevCo
world                                    Ratos majority owner                 option for remaining)          in Vectura                      CEO of ArcusGruppen         Acquired the Vanlig brand

     1805                1996                  2005             2006                  2011           2012           2013              2014         2015              2016          2017         2018

                  Arcus AS established                Acquired Vingruppen                      New production            Vingruppen AS established           Restructured                  Acquired the
                  (demerger from                      i Norden AB with well                    facility at               as holding company for the          as a public limited           Hot n’Sweet Brand
                  Vinmonopolet); 100%                 established wine                         Gjelleråsen               Norwegian wine companies,           company, Arcus
                  government owned                    operations in Sweden                                               mirroring successful                ASA, listed at the            Established Atlung-
                                                                                                                         structure in Sweden, fully          Oslo Stock                    stad Håndverks-
                                                      Sale of industrial                                                 owned by Arcus-Gruppen AS           Exchange                      destilleri
                                                      spirits division

                                                                                                         3
CAPITAL MARKETS DAY MARCH 14th, 2019 - Cision
Arcus share performance in line with peers

                     Share price development since Arcus IPO – Arcus and selected peers 1,2
                         60

                         55

                         50

                         45

                         40

                         35

                         30
                          Dec-16                     Mar-17                    Jun-17                    Sep-17                    Dec-17         Mar-18   Jun-18   Sep-18   Dec-18

                                                                                                                   Arcus             Altia   Lucas Bols

Source: Factset as at 26 February 2019
1) Stock prices rebased to Arcus’s share price as of 1 December 2016, 2) Stock prices adjusted for splits, spinoffs and cash dividends   4
CAPITAL MARKETS DAY MARCH 14th, 2019 - Cision
Results have been a mixed bag in 2017 and 2018

                                                               2017 & 2018 FINANCIAL PERFORMANCE

                                                                             2017              2018       Targets

                                            Topline organic growth          -1,3%             +4,0%        +3-5%
                                            incl. minor M&A bolt-ons        +0,5%             +5,1%

                                            EBITDA (adj.) growth            +7.6%            -13,4%        +6-9%

                                            Dividend pay-out            1.66 (60%)       1.66 (69%1)      50-70%

                                            M&A # bolt-ons                      4                 0    Do bolt-ons

1 Final   decision to be made by General Assembly, April 11, 2019                    5
CAPITAL MARKETS DAY MARCH 14th, 2019 - Cision
Market conditions are stable. Some changes need awareness

         CO N S U M E R T R E N D S                R EG U L ATO RY STAT U S
        • Organic, vegan, local, authentic         • Strong monopolies Norway/Sweden
        • Low-alcohol (more control)               • Monopolies step-up online efforts
        • Trusted, transparent, green              • Changes in Finland in 2018
        • Taste always #1                          • Political debate on tax-free in Norway
        • US: Spirits outgrows wine and beer       • Alcohol tax levels still fuel border trade

                                               6
CAPITAL MARKETS DAY MARCH 14th, 2019 - Cision
Our markets develop. We adapt

      Border trade and tax-free              Improve presence in border areas and shops,
      outgrow monopolies                     further develop tax-free offering

      Craft trend and more                   Strengthen innovation focus, communicate our
      local competitors                      heritage, establish Atlungstad Håndverksdestilleri

      Retail goes online and                 Support Vinmonopolet, Systembolaget and Alko in
      monopolies follow                      their efforts to get maximum consumer satisfaction

      Megatrends: Convenience,               Adapt to local tastes, super-premium offerings,
      taste/indulgence, and sustainability   sustainable value chain and packaging

                                                7
CAPITAL MARKETS DAY MARCH 14th, 2019 - Cision
Stable consumption of wine and spirits in Sweden and Norway

       Sweden and Norway, registered sale of wine and spirits 1,2                                                                       Norway, wine and spirits vs GDP 3
       Pure alcohol, litre pr citizen above 15 years

       4                                                                                                                                            5%
                                                                        3,4         Wine Sweden                                                     4%
               3,1
       3
                                                                                                                                                    3%

                                                                                                                                        GDP (YOY)
             2,2                                                        2,2         Wine Norway
                                                                                                                                                    2%               R2 = 0.0118
       2
                                                                                                                                                    1%
             1,3
                                                                                    Spirits, Sweden                                                 0%
       1 1,0                                                          1,0                                                                -2%           0%   2%       4%       6%   8%
                                                                                    Spirits Norway
                                                                                                                                                    -1%

       0                                                                                                                                            -2%
        2008             2010          2012         2014          2016          2018

1 Kilde:   Centralförbundet för alcohol och narkotikaupplysning, CAN Rapport 175, 2 Kilde: Statistisk Sentralbyrå, desember 2018’
3 Kilde:   Kepler Cheuvreux, Navigating polarized retail, February 2019                                                             8
CAPITAL MARKETS DAY MARCH 14th, 2019 - Cision
Sustainability and consumer preferences work together

                         Bag-in-box is                  …and next generation
                         environmentally                plastic wine bottles
                         smart and very                 are refundable at your
                         practical…                     grocery store

                                      99
Arcus donates 7,000 water bottles to high-school graduates

                                     10
                                     10
Arcus is a Nordic player with local brands and regional scale…

           CLOSE -TO-MARKET

                                                       Arcus
                               Local
                              players

                                                               Global
                                                               players

                                        SCALE AND SYNERGIES
                                                11
…and we have the people to do it

                                   12
                                   12
We can do better! Priorities going forward

                                 R E I G N I T E G ROW T H
            1. Reignite growth in spirits, especially in high-profit markets
            2. Work on productivity in production
            3. Continue managing gross profits on wine
            4. Ensure distribution regains operational leverage from increased revenue
            5. Manage SG&A costs across the board

                                                  13
SPIRITS – REIGNITE
PROFITABLE GROWTH
Erlend Stefansson
Group Director, Spirits

                          14
Our spirits strategy is to create long-term profitable
  growth by developing our brands, attracting new
consumers and exploiting our scale and competence.

                            15
                            15
Leading position across Nordic and German home markets

  Share of
  revenue1
                                                40%                                                  19%                                                  17%                                       4%                      7%

                                                                1
                                               ~35%                                                ~12%              2
                                                                                                                                                        ~10% #5                                     ~2% #6
Market and category development

                       Market
                       volume1
                                                             11.2 ML                                13.4 ML                                   19.8 ML                                  20.7 ML
                                                                       Aquavit                                                                                                          Aquavit   Grape
                                                                                                             Aquavit                              AquavitGrape
                                                                        11 %                                                                                                             0%       11 % Bitter
                                                     Other                                                    16 %                                 5 % 2 %Bitter               Other
                                                                                          Other                                     Other
                                                     23 %                                                                                                     1%               24 %                     1 %Gin
                                                                                          25 %                                      25 %                                                                    2%
                                                                                                                   Grape                                           Gin
                                                                                 Grape                              1%                                             8%
                                                                                 13 %
                                                                                                                        Bitter
                     Category                                                                                           11 %

                   composition                  Whisky
                                                                                 Bitter
                                                                                  6%
                                                                                                                                                                    Vodka
                                                                                                                                                                     22 %
                                                                                                                                                                            Whisky
                                                 12 %                                                                                                                        8%
                                                                                 Gin      Whisky
                                                                                                                    Gin
                                                                                 5%        14 %
                                                                                                                   11 %

                                                                                                                                         Whisky                                                      Vodka/
                                                               Vodka                                 Vodka                                37 %                                                        Viina
                                                                30 %                                  22 %                                                                                            54 %

                                                 Aquavit                    1,6 %         Aquavit                  -6,0 %        Aquavit                    -1,9 %           Aquavit                   -1,7 %
                                                 Grape                     -6,2 %         Grape                    -9,3 %        Grape                      -0,7 %           Grape                     -1,9 %
                                                 Bitter                     0,7 %         Bitter                   -1,3 %        Bitter                      2,5 %           Bitter                    -4,6 %
                      Category                   Gin                        3,9 %         Gin                     16,1 %         Gin                         6,9 %           Gin                        6,8 %
                       CAGR
                                                 Vodka                     -0,9 %         Vodka                        4,4 %     Vodka                      -0,8 %           Vodka                     -3,6 %
                      2014-182
                                                 Whisky                     0,9 %         Whisky                   -0,6 %        Whisky                      5,2 %           Whisky                    -1,1 %
                                                 Other                      3,2 %         Other                    -8,0 %        Other                      -0,5 %           Other                      0,5 %
                                                 Total                     -0,1 %         Total                    -1,2 %        Total                       1,8 %           Total                     -2,1 %

1) Domestic sales 2018, off-trade, 2) 2015-18 for Denmark                                                         17
Arcus Spirits Strategic agenda

            Grow core categories aquavit
            and bitter

            Accelerate innovation and local
            adaptations

            Grow partner portfolio

            Improve gross margin

                                              18
Grow core categories aquavit and bitter

                                  Premiumization

Rejuvenate brands and portfolio                      Drive Mixology for aquavit
                                                           3-tier mixed drinks              Cocktail
                                                           strategy in Germany              competition

                                                           Seeding use of aquavit in drinks across the
                                                           Nordics, USA and internationally

                                  Craft and
                                          19 niche
Accelerate innovation and local adaptations

       Share of Arcus sales value at Vinmonopolet 2018                                              Focused investments in Future Growth initiatives
               Introduced prior to 2014
               Introduced since 2014                                      0,5%   2018
                                                                          0,7%   2017
                                                                          1,0%   2016
                                                                 4%
                                  96%                                     1,6%   2015

                                                                          0,2%   2014

       Top 100 products at Vinmonopolet, 2014 vs 2018                                               Local adaptations and brand stretch

       New on top 100 list                         16                 4      New products*
                                                                      3      Line extensions

                            Existing               84
                                                                      9      Climbers
                                                                                                         PET          Brand      Brand     Duty-Free
                                                                                                      conversion     stretch    stretch    adaptation
* Skåne Akvavit, Akevitt Spesial, Dramm (likør), Glenwood (whiskey)                            20
Grow partner portfolio to leverage Nordic sales and distribution platform

      Nordic markets too small and diverse for         Net sales from agency business
      most International Brand owners to run own
      distribution effectively                                                                 +60%
      Arcus is one of few to offer integrated Nordic
      organization with first class local knowledge
      and strong position in all markets
      Partner business has lower margins than
      own brands, but is still profitable and
      important to get scale on Arcus operation             2015     2016      2017     2018

                                                       21
Drive gross margin through commercial excellence and supply chain
efficiencies

               COMMERCIAL                       S U P P LY C H A I N

              Premiumization                Efficiency & capability

              Price optimization            Organization

              Portfolio optimization
                                            Streamlining & digitalization
              perspective

                                            Total Cost of Purchasing

                                       22
Gross margin development and aquavit portfolio example

 Spirits gross margin development, %          Aquavit in Norway: Arcus pricing January 2019 (70 cl bottle)
                              56
   52       52       53                51

                                                      300
                                                      300          350
                                                                   350               400
                                                                                     400            450
                                                                                                    450

                                                 7%         8%             38%                37%            10%

  2014     2015     2016     2017      2018
                                                                  Share of sales value 2018

                                                   23
Substantial efficiency improvements achieved

                                                                      INCREASED VOLUME AND COMPLEXITY …
                                                               Volume produced at Gjelleråsen           Number of SKUs produced

                                                                                         +29%                                  +26%

                                                                  2014          2018                      2014      2018

                                                                … WHILE IMPROVING EFFICIENCY IN PRODUCTION
                                             Production OPEX*                      FTEs in production                Inventory finished goods

                                                                         -15%                             -11%
                                                                                                                                                -29%

                                                  2014         2018                    2014      2018                   2014       2018

* Total cost for process and bottling (OPEX incl. personnel)                                      24
Making Supply Chain a competitive advantage for Arcus – Key priorities

    EFFICIENCY & CAPABILITY                      STREAMLINING & DIGITALIZATION
    • Capabilities to meet market needs          • Digitalize administrative processes
    • Increase efficiency based on               • Optimize for “right” complexity
      current volume                             • Optimize processes
    • Increase technical availability

    ORGANIZATION                                 TOTAL COST OF PURCHASING
    • De-layered structure and                   • Accelerate purchasing savings
      empowered workforce                        • Reduced waste and scrapping
    • Competence and flexibility in              • Improve supplier collaboration and
      production                                   service level

                                          25
Supply Chain in figures

                 21.8
                  MILLION
                                98.2
                                 PERCENT
                                                   4.5
                                                TIMES/YEAR

               Units produced   Service level   Inventory turn-
                   in 2018        in 2018         over in 2018

                   96
                 EMPLOYEES
                                  1+2
                                PRODUCTION
                                                 ≈450
                                                 COST BASE
                                   SITES          (MNOK)

                                      31
                                      26
Arcus business model targets diverse Nordic Markets and Germany

                     • Local consumer and customer insight founded on strong local
                       presence
                     • Autonomy for local markets for better and faster decisions
                     • Budget and plans with markets in lead, supported by
                       marketing, Innovation and production

                     • Win with one integrated Nordic commercial platform, sharing
                       learnings and concepts between markets
                     • A true Nordic organization with Spirits management team
                       located across Norway, Sweden and Denmark
                     • One Arcus Spirits across commercial and production functions

                                            27
Key priorities Norway

    ARCUS POSITION                      K E Y P R I O R I T I E S G O I N G F O R WA R D
    • Leading player in strongly        • Win Christmas season and de-seasonalize
      regulated monopoly market           aquavit consumption
    • Dominant in attractive            • Optimize and grow strong vodka portfolio
      aquavit and vodka
      segments                          • Continued price and portfolio optimization
                                          crucial in a highly technical market place
    • Expert on commercial
      execution in a market with        • Investments in selected growth initiatives
      limited marketing                 • Attract and develop partner brands
      opportunities
    • Strong position in border
      trade and tax-free

                                   28
Key priorities Denmark

    ARCUS POSITION                           K E Y P R I O R I T I E S G O I N G F O R WA R D
    • Strong No2 player in a highly          • Category revitalization and recruitment via
      competitive and open market              consumer interaction and sampling
      with spirits sold “everywhere”           activities
    • Close partner with top3 grocery        • Drive innovations like Aalborg Basis to
      chains                                   rejuvenate and leverage core brands
    • Aquavit and bitter champion            • Drive mixed drinks agenda for aquavit

    • Strong position in Germany             • Investments in selected growth initiatives
      Border trade                           • Attract and develop partner brands to
                                               leverage Arcus strong market position
    • Experts on combining full
      marketing tool box and sales
      execution in a very dynamic
      market

                                        29
Key priorities Germany

    ARCUS POSITION                         K E Y P R I O R I T I E S G O I N G F O R WA R D
    • Aquavit champion in niche            • Refine and implement in-store execution
      category in huge market                excellence programs
    • Actively driving aquavit             • Drive distribution and activation of
      rejuvenation after decades of          premium aquavit to revitalise aquavit as
      segment decline                        premium digestive across on- and off-trade
    • Strong and growing reputation        • Continue to invest in Big Bet initiative
      for Arcus aquavit portfolio            mixed drinks for aquavit

    • Focussed local Arcus presence        • Grow bitter from low base with Gammel
      in a fragmented market                 Dansk and Malteser Kräuterlikör
                                           • Strengthen importer partnership via
                                             increased local Arcus presence and
                                             customer involvement

                                      30
Key priorities in other markets

  • Grow with aquavit and   • Defend and grow strong         • Strengthen cooperation       • Seed aquavit and bitter
    vodka                     Braastad position                with key players in Nordic     through focused approach
                                                               Travel Retail                  in 2-3 states
  • Leverage growth from    • Grow with pre-mixed and
    growing categories        shots portfolio                • Win key segments with        • Focused efforts
                                                               channel-specific variants      towards Nordic
  • Grow partner            • Grow partner                                                    roots
    business and              business and                   • Seed new
    portfolio                 portfolio                        geographies                  • Explore aquavit
                                                               via expanded                   in Mixology
                                                               portfolio
                                                               offering

                                                        31
Arcus Spirits Strategic agenda

                                     Rejuvenate core brands and portfolio in Nordic
            Grow core categories
                                     markets and Germany through premiumization,
            aquavit and bitter
                                     mixology and craft initiatives

                                     Invest in local adaptations and selected initiatives
            Accelerate innovation
                                     with significant growth potential targeting the local
            and local adaptations
                                     consumer

                                     Attract leading international spirits partners to
            Grow partner portfolio
                                     leverage Nordic sales and distribution platform

                                     Drive gross margin through focussed pricing and
            Improve gross margin     portfolio initiatives, supported by increased
                                     efficiencies in production and value chain

                                                  32
WINE – CONTINUE STRONG
PERFORMANCE
Eirik Andersen, Group Director, Wine Norway
Øystein Gogstad-Andersen, Managing
Director, Arcus Wine Brands

                                        33
Leading footprint in the Nordic wine market

Arcus with leading positions1 in all three countries with room for further consolidation                                   Revenue split - 2018

                                                  Arcus                                                                                             Arcus
                                          1       15%                                                                                              brands
                                                                                                                                                    ~11%
                                                      2   Solera
        Others
                                                      3
        ~65%
                                                  4                                                                           Agency
                                                                                                                              brands
                                                                                                     1    Altia                ~89%
                                                                                       Others
                                                                   1                   ~50%                    2

                                                                             #42                               3

                                                                                                          ~4       Arcus
                                              1       VIVA                                           ~4             6%
                                                                                                ~4                                                     30%
        Others                                            Arcus
                                                      2                2
        ~59%                                              10%
                                                  3                                                                             58%
                                              4
                                                                                                                                                       11%

                                                                                                                                                  1%

1) Wine category share by value 2) Shared wine category position              34
Market and category development

                               Market volume1                                         67,0 ML                                    202,1 ML                                     52,4 ML
                                                                                        Other                                                                                   Other
                                                                                                                                 Other wine 2 %
                                                                                       wine 2 %                                                                                wine 3 %
                                                                           White
                                                                           wine
                                                                           28 %                                     White
                                                                                                                    wine                                        White                                  Red wine
                                    Category                                                                        32 %                           Red wine     wine                                     43 %
                                                                                                                                                     48 %       41 %
                                  composition                                                     Red wine
                                                                                                    58 %
                                                                       Sparkling
                                                                         wine                                        Sparkling
                                                                         8%      Rosé wine                           wine 10 %
                                                                                                                                   Rosé wine 8 %                                              Rosé
                                                                                    4%                                                                                Sparkling wine 10 %   wine 3 %

                                                                       Red wine                     -1,9 %        Red wine                          -1,4 %    Red wine                                  -6,5 %
                                                                       Rosé wine                    8,9 %         Rosé wine                          2,0 %    Rosé wine                                 28,2 %

                                Category CAGR                          Sparkling                    5,9 %         Sparkling                        14,5 %     Sparkling                                 -1,1 %
                                   2014-182                            White wine                   1,4 %         White wine                         1,1 %    White wine                                -0,3 %
                                                                       Other                        9,0 %         Other                             -1,6 %    Other                                     -8,8 %
                                                                       Total                        0,1 %         Total                              0,8 %    Total                                     -2,9 %

1) Domestic sales, off-trade. 2) Finland development is 2018 vs 2017                                         35
Norway: Capturing market shares in a growing market

                                                                           9,9 %

                                                                                        • Vingruppen has increased its
                                                                                          market share every month since
                                                                                          November 2017
                                                         4,8 %                          • Vingruppen increased the market
                                                                     Vingruppen           share from 15,8 to 16,9 % from
                                                                                          2017 to 2018
                                                                                        • In January 2019 Vingruppen had
                                                        Market
                                                                                          a market share of 18,2 %

                                                             Norway 2018

1Consumer sales
Source: Vinmonopolet and Systembolaget, year end 2018                              36
Red wine still largest category, but growth comes from lighter categories

                 Share of total volume per category              Change in volume per category
                 Percent                                         Thousand liter

                        Red wine                      58%        Red wine     -1.114

                       White wine         28%                    White wine                                  1.178

                Sparkling wine       8%                          Sparkling wine                   366

                        Rosé wine   4%                           Rosé wine                             578

                           Other    2%                            Other                          208

Source: Vinmonopolet                                        37
Increased demand for lighter wines, and our portfolio must adapt

                       Category mix Vinmonopolet                            Category mix Vingruppen
                           64.982         65.717                           10.671             11.138
                                 3,0%          4,2%   100%                0,8% 1,5%         1,7%   3,1%   100%
                      6,9%              7,9%                                 18,9%
                                                                                              23,8%
                            26,9%         29,0%

                                                             Rosé wine      78,8%             71,3%
                            63,2%         58,8%              Sparkling
                                                             White wine
                                                             Red wine

                            2015           2018                             2015               2018

Source: Vinmonopolet, volume %                                  38
Several successful launches has strengthened our position within
lighter wines

•   Tender-win                   •   Successful test listing          •   Successful test listing      •   Tender win
•   One of the most successful   •   Rosé - Line extension            •   Well received by the press   •   Well received by the press
    launches in 2018                 Fumées Blanches                  •   Organic                      •   Premium
•   Almost fully distributed     •   Distributed to category 5        •   Fully distributed            •   Distributed to category 4

                                                                 39
Creating growth with premium wines

•   Premium Champagne            •   Three premium wines            •   Small quantities      •   Three basic listings
•   Bestseller in Sweden             listed in Norway               •   Super Premium         •   Premium wines
•   Basic listing in Norway      •   Prestige producer              •   Prestige producer     •   Good distribution and
•   Great potential for growth                                                                    potential for growth
                                     We’re taking important steps to position our portfolio
                                      within thepremium and super premium categories
                                                               40
New packaging types increases its market shares and organic wines
continues to grow
Thousand liter, 2018 vs 2017 at Vinmonopolet

               Sales development per package type                  Sales development per 2018

                         BIB                           +347
                                                                       Organic         +233
                Glas bottle                            +357

                         PET             +181
                                                                   Non organic                               +983
                       Pouch                       +303

               PET and pouches accounts for 2% of the total        Organic market share is 7,7%, but accounts for
               market, but 40 % of the market growth.              19% of market growth.

Source: Vinmonopolet                                          41
Focus on winning strategic tenders with sustainable and unique concepts

 • Tender-win                 • Line extention Laroche              • Tender-win                   • Tender win
 • One of the most successful • Successful launch in                • PET bottle with deposit      • Most sold PET bottle and
     rose launches.               ordering range                    • Fully distributed from May     best-selling French wine in
 •   Innovative packaging     •   Potential basic listing in                                         bottle
                                  2019
                              •   Innovative packaging
                                                               42
Over 50% of all wine sold at Vinmonopolet comes from less than
100 products

            Wine sold at Vinmonopolet                  Average volume sold per product
            %-share                                    Thousand liter

                            Top 10    11%                          Top 10                748

                       Top 11 to 99         44%               Top 11 to 99       328

            Other (22.000 SKU’s)            45%        Other (22.000 SKU’s) 2

Source: Vinmonopolet                              43
Building brands is a great opportunity in the wine category

                                                                          Over 2,2 million
              • Use local consumer insight to respond                    liters sold in 2018
                                                                           (+20% vs. 2017)
                   consumer trends. Nordic innovation.
              • Continue to strengthen our position
                   with local and Nordic brands
              • Accelerate growth in other channels/
                   markets
              • Our unique business model is our
                   competitive advantage (producer
                   contacts, logistics, bottling facilities, lab,
                   route-to-market and market know- how)                   Over 1,5 million
                                                                          liters sold in 2018
                                                                            (+25% vs. 2017)

Source: Internal numbers, total all markets                         44
Strong performance and growth in channels outside Norway

                                                                                                           Sweden and Finland
                                                                                                           Tax-free (DFTR), Color Line and Heinemann

                                                                                              2.058
                                                         CAGR +28,0%
                                                                 1.687

                 1.256
                                                                                              1.713

                                                                 1.550

                 1.190

                                                                                              345
                  66                                               137
                 2016                                            2017                         2018

Source: Million liter, Ruby Zin and Falling Feather. Sales excluded the Norwegian monopoly.           45
Think big with Falling Feather – Long term growth

                                                                                                                                 2.200
            Norway
            Sweden, Iceland, taxfree

                                                                                   +28%

         150

        2007          2008          2009         2010          2011          2012            2013   2014   2015    2016   2017   2018

Source: Internal numbers. Graph shows volume development, from 150K liters to 2,2M liters.                        46
How Falling Feather was developed into a best-selling wine brand

               INSIGHTS AND CONSUMER INTERACTIONS
               • Insights – driver analysis best-selling brands
               • Vinmonopolet fairs
               • Strong presence at consumer tastings and events – meet core
                 target consumers and create interaction
               • A&P (Sweden)
               • Update the product regularly, design and blend

                                               46
                                               47
Continue the positive development for our own brands

    Increase distribution – a Nordic                  35/35
    wine brand
                                                              335/335
    • On shelf where core target consumers
      shop their wine                                                         Launch
                                                                              Q1 2019
    • Introduce Ruby Zin                                         315/439
    • Strengthen position in existing channels
    • Accelerate growth in new channels/
                                                                       Listed at
      markets
                                                                 Heinemann airports.
                                                                 Ferries: Color Line +
                                                                       Fjordline

                                                 48
Going forward we will focus on creating value through…

                1                                     2                                     3

Improve portfolio management        Strengthen insight & innovation         Expand distribution
• Close cooperation with partners   • Continue to strengthen our position   • Strengthen position in existing
                                      with local and Nordic brands            channels
• Reduce portfolio complexity
  – Current trends                  • Use local consumer insight to         • Accelerate growth in new
  – Growing categories                respond consumer trends                 channels/markets
  – Seasonality                     • Nordic innovation                     • Think BIG!
• Improve price management          • Use our unique business model

                                                      49
To be the best agency-partner in the Nordics

                                      50
T H INK BIG!

    51
FINANCE – CREATING
SHAREHOLDER VALUE
Sigmund Toth
CFO

                     52
At the IPO we presented a value-creation model based on profitable
growth and high cash conversion

              Organic growth (including minor bolt-ons)
              of 3-5%

                                                              • Dividends of 50-70%
              EBITDA growth of 6-9%, realized through
                                                                of net earnings
              improved margins thanks to better asset
              utilization                                     • Value creating M&A

              High cash flow conversion: Limited investment
              needs (20 MNOK Capex vs. 50 MNOK
              depreciation) and low working capital needs

                                                  53
We promised (based on Euromonitor):
Resilient, non-cyclical and steady demand growth…
EUR million – retail end-market value 1

WINE                                                                           CAGR
                                                                                                  SPIRITS                                                  CAGR
4 000                                                                     ‘05-’15 ‘16-’20E        2 000                                               ‘05-’15 ‘16-’20E

3 500                                                                      3,9%     3,5%
                                                                                                  1 750
                                                                                                                                                       1,2%     3,4%
3 000

                                                                                                  1 500
2 500
                                                                                                                                                       0,6%     0,7%
2 000                                                                                             1 250
                                                                           3,6%     3,6%
                                                                                                                                                       1,6%     1,9%
1 500
                                                                                                  1 000
                                                                           3,8%     2,6%                                                               1,0%     2,4%
1 000

                                                                                                   750
   500

      0                                                                                            500
          2005          2008          2011         2014   2017E   2020E                                   2005   2008   2011   2014   2017E   2020E
SOURCE: Euromonitor, Vinmonopolet, Systembolaget
1) Retail Sales Price, on- and off-trade total                                               54
…and an attractive financial profile…

Strong and non-cyclical revenue                               …with improved and resilient                                     …and with high cash flow
growth…                                                       margins…                                                         generation

                                                     2,572                                                             340     Well invested with limited
                                                                                                                               maintenance capital expenditure
                                                                                                                     13,2%     requirements, well below current
                                                                                                                               depreciation level

                                                                                                                               Limited net working capital
                                                                                                                               requirements (albeit some
                                                                                                                               seasonality)
863
                                                              3,6%
                                                                                                                               Solid basis for attractive cash
                                                              31                                                               conversion

2005 2006 2007 2008 2009 2010 2011 2012 2013 2014 2015 LTM    2005 2006 2007 2008 2009 2010 2011 2012 2013 2014 2015 LTM
                                                      Q3'16                                                            Q3'16
                          Revenue (NOKm)                                  Adj. EBITDA           Adj. EBITDA margin (%)

                                                                                           55
…which was translated into a set of key financial targets

 Revenue       • Organic revenue growth in the level of
                                                                     Tax rate   • Effective tax rate in the level of 22%
  growth         3-5% p.a. incl. minor bolt-on acquisitions

                                                                                • Net Interest Bearing Debt
Results have been a mixed bag in 2017 and 2018

                                                               2017 & 2018 FINANCIAL PERFORMANCE

                                                                             2017               2018       Targets

                                            Topline organic growth          -1,3%              +4,0%        +3-5%
                                            incl. minor M&A bolt-ons        +0,5%              +5,1%

                                            EBITDA (adj.) growth            +7.6%             -13,4%        +6-9%

                                            Dividend pay-out            1.66 (60%)        1.66 (69%1)      50-70%

                                            M&A # bolt-ons                      4                  0    Do bolt-ons

1 Final   decision to be made by General Assembly, April 11, 2019                    57
Arcus organic growth sales development has been good, except
on Spirits
Percent change vs. previous year

                25          C O N S O L I D AT E D 1                                                     25   WINE
                20                                                                                       20
                15                                                                                       15
                10                                                                                       10    8                           7
                  5              3                                      3                     4          5            3      4
                                                                                                                                    0
                  0                                                                                      0
                                                     0                                 -1
                 -5                                                                                      -5

                25                                                                                       25
                20
                              SPIRITS1                                                                   20   DISTRIBUTION
                15                                                                                       15
                10                                                                                       10                         8      8
                                                                                                                             5
                  5                                                                                       5
                                                                        2
                  0                                                                                       0
                                                                                                         -5
                 -5              -4                 -3                                 -3                      -5
                                                                                              -4                      -8
                              2014                2015               2016             2017   2018             2014   2015   2016   2017   2018
1 Adjusted to exclude effect of Vikingfjord exit from USA and Brøndums’ divestiture
SOURCE: Arcus analysis                                                                              58
We can do better! Priorities going forward

                                 R E I G N I T E G ROW T H
            1. Reignite growth in spirits, especially in high-profit markets
            2. Work on productivity in production
            3. Continue managing gross profits on wine
            4. Ensure distribution regains operational leverage from increased revenue
            5. Manage SG&A costs across the board

                                                  59
Ensure Distribution regains operational leverage from increased
revenues

 History of cost reduction and revenue growth, but loss of                    Going forward, focus is to remove bottle-necks and improve
 operational leverage from increased revenues in 2018                         capacity utilization to regain operational leverage
 Organic revenue growth (% YoY)
 25
 20
 15
 10                                                  8            8
                                       5
  5
  0
                                                                                • Strong focus on our digital journey. Innovative
 -5                                                                               solution for our customers and internal operations
          -5
                        -8
         2014          2015           2016          2017         2018           • Continuous improvement to gain higher efficiencies
                                                                                  in our operations
 EDITDA adj. margin evolution (% of sales)
 20
                                                                                • Together with our customers optimize and improve
 10                                                        5,0    4,1
                                                                                  our plans and execution in our high season
                                             1,0
  0
-10                            -6,4
-20                -12,9
-30     -22,0
        2013       2014       2015           2016        2017     2018

                                                                         60
Black over red – we will further focus on costs to ensure organic growth
above the underlying growth in fixed costs
Percent

                                5                                                                                 Underlying growth in fixed costs1
                                                                                                                  Organic growth revenues

                                0
                                 2014                                    2015               2016        2017   2018

                               -5

                            -10

1 Fixed costs excludes A&P and Depreciation, and are FX-adjusted. 2017 is adjusted the
acquisition of the remaining 50% of the shares in Det Danske Spritus Kompagni A/S (DDSK).
SOURCE: Arcus analysis                                                                             61
Maintaining our high levels of cash conversion
NOK millions

   EBITDA (adj.)                                                                                                   313   2018 actual value used

   Capex                                                                                                           20    As per external guidance (and in line with recent years of maintenance capex)
                                                                                                                         NB! As our assets age (and our volume grows) this level will not be sustainable

   Change in NWC                                                                                               4         Will depend on growth. Here assumed 4% growth, with normalized NWC
                                                                                                                         constant at 4% of sales

   Tax                                                                                                         59        Assumed 22% as per external guidance; applicable on EBITA (EBITDA -45
                                                                                                                         MNOK in depreciation)

   Free Cash Flow (normalized)                                                                         229

   Reduction in tax paid                                                                                 17              Reduction in tax paid (mainly due to the effect from deficit that can be carried
                                                                                                                         forward, total net 2018-effect of ~17MNOK used)

   Interest and financial lease                                                                          50              Assumed same level as 2017 & 2018 (refinanced in 2016)

   Cash flow available for                                                                       196
   M&A and Dividend1

1 Not including effects from IFRS16 (see annual report 2017 for details on effects from IFRS16 introduction)
SOURCE: Arcus analysis                                                                                                       62
We will continue to look for value-creating M&A to utilize our capacity,
returning cash to investors when we cannot

                                                                    R AT I O N A L E                                                          EXAMPLES
                                                                                                                        Gross margin
                                                                                                                        EBITDA (adj) margin
                                                                   Gjelleråsen facility can
        Utilize spare capacity
                                                                   handle increased volume and
        in production and/or
                                                                   margins from new volume
        distribution
                                                                   can be close to gross profit1
                                                                                                          51%

                                                                    In some markets/areas, new
        Utilize spare capacity in                                   volume can be handled with                  27%
                                                                                                                        24%
        sales and/or marketing                                      current capacity within sales
                                                                                                                                                • Wine importers
                                                                    and/or marketing                                            11%
                                                                                                                                                • Spirits importers

                                                                                                         Spirits 2018   Wine 2018

1 Assuming a good fit with current production seasonality, competence, use of equipment etc.        63
CLOSING REMARKS
Kenneth Hamnes
Group CEO

                  64
We can do better! Priorities going forward

                                 R E I G N I T E G ROW T H
            1. Reignite growth in spirits, especially in high-profit markets
            2. Work on productivity in production
            3. Continue managing gross profits on wine
            4. Ensure distribution regains operational leverage from increased revenue
            5. Manage SG&A costs across the board

                                                  65
66
You can also read