IMC International Meal Company - INTERNATIONAL MEAL COMPANY - IMC | Investor Relation

Page created by Frank Glover
 
CONTINUE READING
IMC International Meal Company - INTERNATIONAL MEAL COMPANY - IMC | Investor Relation
IMC
                             International Meal Company
                             Institutional Presentation

INTERNATIONAL MEAL COMPANY   June 2020
IMC International Meal Company - INTERNATIONAL MEAL COMPANY - IMC | Investor Relation
Disclaimer

The material that follows is a presentation of general background information about International Meal Company Alimentação S.A. (“IMC”
or the “Company”) as of the date of the presentation. It is information in summary form and does not purport to be complete nor are they
intended to be construed or interpreted as advice to potential investors. No representation or warranty, express or implied, is made
concerning, and no reliance should be placed on, the accuracy, fairness, or completeness of this information

This presentation may contain certain forward-looking statements and information relating to the Company that reflect the current views
of the Company and its management with respect to its business, markets trends and future events. Forward looking statements include,
without limitation, any statement that may predict, forecast, indicate or imply future results, performance or achievements, and may
contain words like “believe”, “anticipate”, “expect”, “envisages”, “will likely result”, or any other words or phrases of similar meaning,
which speak only as of the date the statement was made. Such statements by their nature address matters that are, to different degrees,
uncertain, such as statements about the potential impacts of the COVID-19 pandemic on our business operations, financial results and
financial position and on the world economy, and are subject to a number of risks, uncertainties and assumptions. We caution you that a
number of important factors could cause actual results to differ materially from the plans, objectives, expectations and intentions
expressed in this presentation. Unless if otherwise expressly indicated herein, such forward-looking statements shall not be construed as
guidance or projection under current legislation, but only as mere trends that, of course, involve uncertainties and risks. The Company is
under no obligation to update such written statements if conditions change or that unexpected occurrences happen to affect the
statement afterwards. Neither the Company nor any of its affiliates, directors, officers, agents or employees shall be liable before any
third party (including investors) for any investment or business decision made or action taken in reliance on the information and
statements contained in this presentation or for any consequential, special or similar damages.

This presentation does not constitute an offer, or invitation, or solicitation of an offer, to subscribe for or purchase any securities. Neither
this presentation nor anything contained herein shall form the basis of any contract or commitment whatsoever.

The market and competitive position data, including market forecasts, used throughout this presentation was obtained from internal
surveys, market research, publicly available information and industry publications. Although we have no reason to believe that any of this
information or these reports are inaccurate in any material respect, we have not independently verified the competitive position, market
share, market size, market growth or other data provided by third parties or by industry or other publications.

This presentation and its contents are proprietary information and may not be reproduced or otherwise disseminated in whole or in part
without the Company’s prior written consent. Please, for any investment decision, read the risk factor section in the Company’s
“Formulário de Referência”, available at CVM (Comissão de Valores Mobiliários) and our IR websites.

                                                                                                                                                   2
IMC International Meal Company - INTERNATIONAL MEAL COMPANY - IMC | Investor Relation
Section I

                             Company Overview

INTERNATIONAL MEAL COMPANY
IMC International Meal Company - INTERNATIONAL MEAL COMPANY - IMC | Investor Relation
IMC at-a-Glance
Leading Company in the food service business, with presence in Brazil, the USA, Colombia and
Panama
                          Geographic Footprint                                                                                                    Main Brands
                                 (as of May 25th, 2020)                                                                                          (as of May 25th, 2020)

                                                                500 (24 5) PoS(1)                              Brands             Countries             Stores(1)                    Highlight

                                                                  Brazil      433 (178)
                                                                                                         1                                                                • Largest world’s pizza
                                                                                                                                                         234 (34)
                                                                                                                                                                            restaurant chain(3)
                                                                   USA              22

                                                               Colombia             25                   2                                                                • Largest world’s chicken
                                                                                                                                                          92 (37)
                                                                                                                                                                            fast food chain

                                                                Panama              20

                                                                                                         3                                                                • Pioneer roadside
                                                                                                                                                             25
                                                                                                                                                                            restaurant

                                                                                                                                                                          • Jimmy Buffett’s
                                                                                                         4                                                   22             Caribbean-inspired
                                                                                                                                                                            restaurant
       Net Revenues                                   Adjusted EBITDA(2)
               (2019A)                                             (2019A)
                                                                                                                                                                          • Several brands in 4
                                                                                                                                                       42 (airports)(4)     countries
             12%                                                            24% Roads                    5      Airports
                                                                            10% Air Business                                                           13 (catering)      • Catering in Colombia and
                                                 30%              39%       3% Malls                                                                                        Brazil
                                                                            2% Pizza Hut + KFC
       28%
                         60%                                                                                                                                              • Several traditional and
                                                                                                               Others(5)                                     72
                                                                                                                                                                            premium brands
                                                      31%

                              Brazil       US         Caribbean                                                                                          Core Businesses

Notes: (1) (x) denotes own points of sale; (2) Considers Pizza Hut and KFC November and December, 2019 EBITDA; For more information, please refer to “Section IV – Financial Highlights” of this
         presentation; Does not consider IFRS-16 effect (3) In terms of units; (4) Considers Viena, Batata Inglesa, Olive Garden, J&C Delicias, Carls Jr. and others inside airports; (5) Considers
         Viena, Batata Inglesa, Olive Garden, J&C Delicias, Carls Jr. and others outside airports
                                                                                                                                                                                                      4
IMC International Meal Company - INTERNATIONAL MEAL COMPANY - IMC | Investor Relation
Financial Highlights(1)

                                500          stores                                                          1.9%             SSS
                                as of May         25th,   2020                                               2019A vs. 2018A

                                R$1.6bn Net Revenues                                                         R$150mm                         Adj. EBITDA(2)
                                +4.9% 2019A vs. 2018A                                                        9.4% EBITDA margin

                                62% Operational Cash                                                         R$270mm                         Net Debt
                                Flow Conversion(3)
                                in 2019A                                                                     1.8x Net Debt / 2019A Adj. EBITDA

Notes: (1) Does not consider IFRS-16 effect; (2) Before special items (expenditure on incorporating MultiQSR, closing stores, stock option and M&A); (3) Operational Cash Flow / Adjusted EBITDA
                                                                                                                                                                                                   5
IMC International Meal Company - INTERNATIONAL MEAL COMPANY - IMC | Investor Relation
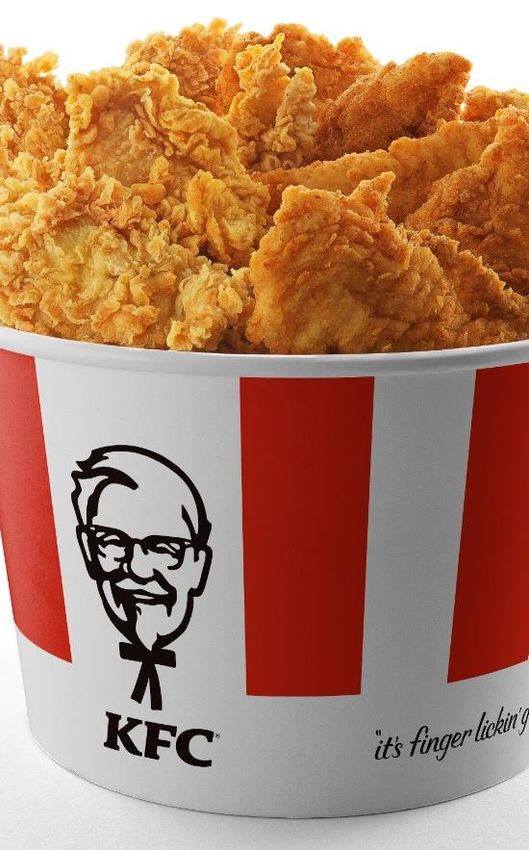
1   Pizza Hut Overview
    The world's largest pizza chain in terms of locations, present in over 130 countries with almost
    15,000 restaurants and kiosks
               Geographic Footprint (May 25th, 2020)                                                   KFC and Pizza Hut Financial Highlights(1)
                                                                                                                                                 13.2%
                                                                                                 R$ 36mm                  R$ 5mm                EBITDA
                                                                                                   Net Sales                EBITDA
                                                                                                                                                Margin(2)
                                                                                                (Nov. + Dec. 2019)      (Nov. + Dec. 2019)
                                                                                                                                             (Nov. + Dec. 2019)

                                                                                                                     Pizza Hut Overview

         21                               234                                 34
                                      Pizza Hut
       States                                                          Own Stores
                                       Stores

    Note: (1) Does not consider IFRS-16 effect; (2) Does not consider administrative expenses
                                                                                                                                                            6
IMC International Meal Company - INTERNATIONAL MEAL COMPANY - IMC | Investor Relation
2   KFC Overview
    KFC is the world’s largest chicken fast food chain and the world’s second largest restaurant
    chain
               Geographic Footprint (May 25th, 2020)                                                   KFC and Pizza Hut Financial Highlights(1)
                                                                                                                                               13.2%
                                                                                                 R$ 36mm                R$ 5mm                EBITDA
                                                                                                   Net Sales              EBITDA
                                                                                                                                              Margin(2)
                                                                                                (Nov. + Dec. 2019)    (Nov. + Dec. 2019)
                                                                                                                                           (Nov. + Dec. 2019)

                                                                                                                     KFC Overview

         10                                 92                                37
       States                        KFC Stores                        Own Stores

    Note: (1) Does not consider IFRS-16 effect; (2) Does not consider administrative expenses
                                                                                                                                                          7
IMC International Meal Company - INTERNATIONAL MEAL COMPANY - IMC | Investor Relation
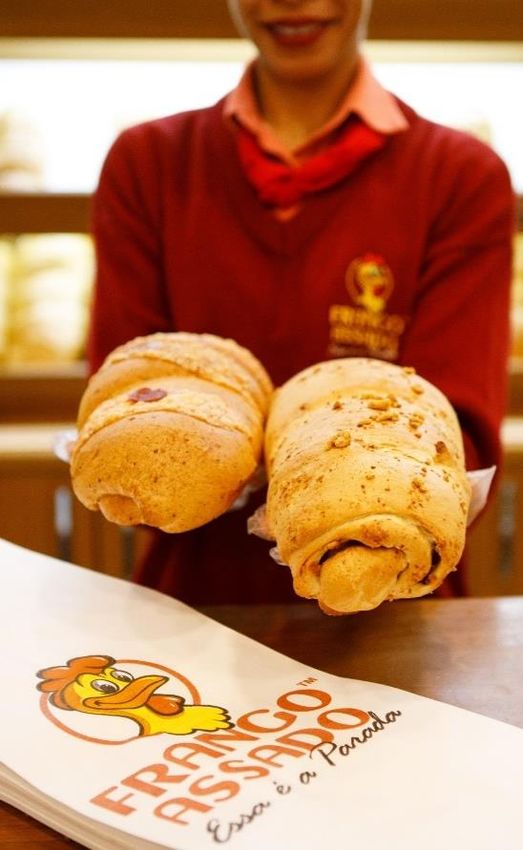
3    Frango Assado Overview
     Pioneer and well recognized roadside restaurant brand with a multiservice plaza: gas station,
     restaurant, snack bar, bakery and mini-market
                Geographic Footprint (May 25th, 2020)                                                                                          Financial Highlights(1)
                                                                                                                           Net Revenue (R$mm)                           EBITDA (R$mm) and Margin(2) (%)
                                                                                                                      CAGR: 4.9%

                                                                                                                                                     514                   13.6%                     14.0%
                                                                                                                        467           483                                                 11.3%
                                                                                                                                                                              64            54        72

                                                                                                                       2017          2018           2019                    2017           2018      2019

    Frango Assado Stores
    Gas Station
    Frango Assado + Gas Station

            2                                25                               18(3)
                                      Frango                         Frango Assado
        States
                                   Assado Stores                     + Gas Stations

     Notes: (1) Does not consider IFRS-16 effect; (2) Does not consider administrative expenses; (3) IMC has 25 Frango Assado stores, which 18 are integrated with gas stations; In addition of 25
              Frango Assado stores, IMC operates 1 gas station that is not integrated with the restaurant
                                                                                                                                                                                                           8
IMC International Meal Company - INTERNATIONAL MEAL COMPANY - IMC | Investor Relation
4      Margaritaville Overview
       Caribbean style restaurant founded by Jimmy Buffett

                  Geographic Footprint (May 25th, 2020)                                                                                        Operations Highlights

                                                                                                                                                       Brand Awareness
                                                                                                                                                        Margaritaville has a strong brand, with
                                                                                                                                                         75% of recognition in US, positive
                                                                                                                                                         association with Jimmy Buffet and highly
                                                                                                                                                         engaged “fins up” club with 24M fans
                                                                                                                                                        Landshark: Top-selling beer brand

                                                                                                                    Significant Elements
                                                                                                                     Unique tropical décor and laid-back
                                                                                                                       lifestyle
                                                                                                                     “Feet in the sand, drink in your hand” and
                                                                                                                       “it’s 5 o’clock somewhere”
                                                                                                                    Wide Demographic
                                                                                                                     Attractiveness increased by customers
                                                                                                                       highly engaged on digital platforms
                                                                                                                                                 Financial Highlights(2)
                                                                                                                           Net Revenue (R$mm)                           EBITDA (R$mm) and Margin(3) (%)
                                                                                                                       CAGR: 10.6%

         15                         3                         4                         5                                368           439            450                                  10.3%        10.2%
                                                                                                                                                                             9.6%
    Margaritaville            Landshark                    Other                 Venues to be
      Venues                   Venues                     Venues                  Opened(1)                                                                                   35             45           46

                                                                                                                        2017          2018           2019                    2017           2018        2019

       Notes: (1) 2 Land Shark venues to be opened in 2020 and 1 in 2021; 1 Margaritaville to be opened in 2020 and 1 in 2021; (2) Considers all US businesses as Margaritaville businesses; Does not
                consider IFRS-16 effect; (3) Does not consider administrative expenses
                                                                                                                                                                                                           9
IMC International Meal Company - INTERNATIONAL MEAL COMPANY - IMC | Investor Relation
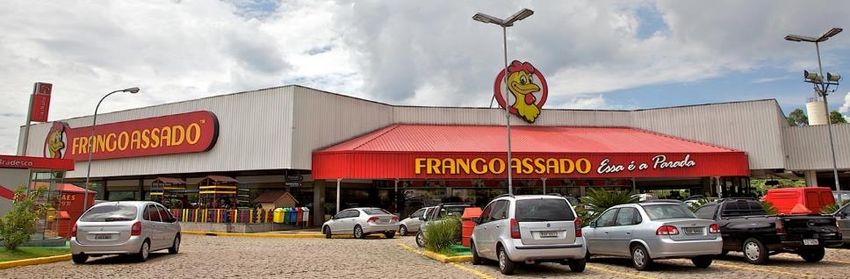
5       Airport Businesses Overview
        Presence in the main airports in Brazil, Panama, Colombia and the USA through airport retail
        and flight catering concessions
        Airport’s Geographic Footprint (May 25th, 2020)                                                                    Airports and Caribbean’s Financial Highlights(1)
                                                                                                                             Net Revenue (R$mm)                            EBITDA (R$mm) and Margin(2) (%)

                                                                                                                           425           431            395
                                                                                                                                                                                             19.7%   18.7%
                                                                                                                                                                              16.6%
                                                                                                                                                                                 70            85     74

                                                                                                                          2017          2018           2019                    2017           2018   2019

    US Airports (1):
    Miami
    Panama Airports (1):
    Tocumén + Ongoing Expansion
    Colombia Airports (8):
    Barranquilla, Cartagena, Rionegro,
    Medellín, Bucaramanga, Bogotá,
    Pereira and Cali
    Brazil Airports (6):
    Guarulhos (SP), Confins (MG),
    Congonhas (SP), Salgado Filho
    (RS), Juscelino Kubitscheck (DF)
    and Viracopos (SP)

               4                                42                                 13
                                      Restaurants in                       RA Catering
        Countries
                                        Airports                             Venues

        Notes: (1) Brazilian air businesses + Caribbean business numbers (Includes 12 J&C stores and 8 Carls Jr. stores); Does not consider IFRS-16 effect; (2) Does not consider administrative
                 expenses
                                                                                                                                                                                                       10
Section II

                             IMC Strategic Pillars

INTERNATIONAL MEAL COMPANY
IMC Strategic Pillars

            Strong Sector Fundamentals
            The Brazilian external dinner market has plenty of room for growth                                    1

                    Solid Portfolio With Well Positioned Brands in the Market
                    Portfolio composed of leading brands in their respective segments                             2

                         Clear Growth Avenues
                         Paved way for IMC’s core brands                                                          3

                           Execution Capability
                           Monthly new stores opening record and mapping of all potential new restaurants         4

                           Strong Increase in Efficiency
                           Centralized and scalable production of a wide variety of products for IMC businesses   5
                         Focus on Growth Businesses
                         IMC has been divesting from non-profitable businesses and focusing on businesses with    6
                         attractive returns

                    Strong Cash Generation in USD
                    ~61% of adjusted EBITDA in international operations (US + Panama)                             7

            Seasoned Management Team and Board of Directors
            Experienced management team, supported by strong shareholders                                         8

                                                                                                                  12
1 Strong Sector Fundamentals

    The Brazilian external dinner market has plenty of room for growth

                     Underpenetrated market                                                          Large and fragmented

             Per capita consumption with external dinner                                             Chicken consumption in the world
 (US$)                                                                             (mm tons)

    1.738 1.629                                             3x higher per capita
                1.603                                                                 16
                             1.391                             consumption
                                                                  potential                    12       11      10
                                        811
                                                557   550   457     397                                                  5      5       4
                                                                          236                                                                   3

             % of spending on meals at external dinners                                    Highly fragmented and incipient markets in Brazil

                                                              50,0%
            38,0%                        40,0%

             2013                        2017                     2017
                                                                                         +21k                 230 chicken-          +1k gas stations
                                                                                      pizzerias in               focused              in São Paulo
                                                                                         Brazil                restaurants          State highways
                                                                                                             brands in Brazil
           Potential of + 25% compared to the American market

    Source: Euromonitor and Geofusion
                                                                                                                                                 13
Solid Portfolio With Well Positioned Brands
2
    in the Market

            Brands that reach different population income levels
                                                                         A/B            A/B         B/C             B

                    Valuable brands in their respective
                    segments                                  Top 3 valuable    Top 7 valuable Top of mind
                                                                                                                74% brand
                                                                                                               awareness in
                                                              brands globally   brand globally for travelers       USA

                       Leading brands in their respective
                       segments (# of stores)
                                                                                #1             #2              #2

                                                                     CAPEX made                   Royalties
                    Franchise model with attractive returns              by the                   % of sales
                                                                      franchisees

            Large addressable market served by a broad
            portfolio of brands (diversified store models)              Food Court            Delivery/
                                                                     (Shopping Malls)         Carry-out        Free Standing

                                                                                                                              14
3 Clear Growth Avenues
  KFC and Pizza Hut
  Clear growth avenues for IMC within its core brands

                Potential of ~ 1,200 Pizza Hut
                                                                                                                             ~500                                                     ~700
                             and KFC brands                                                                                KFC stores                                           Pizza Hut stores
                              restaurants(1)

                                              KFC                                                                                            Pizza Hut

                      Chicken is the main protein consumed in Latin                                                              Pizza market is bigger than the hamburger
                      America                                                                                                    market in Brazil
                      More than 50% of the protein consumed in Brazil is chicken                                                 2019 pizza market was R$16bn vs. R$14bn
                                                                                                                                 hamburger market
                      Chicken fast food market still unexplored in Brazil
                      230 fast food restaurants with a menu focused on
                      chicken, 28% of which are KFC restaurants
                                                                                                                                 Pizza Hut with 1% market share among
                      KFC with incipient presence in Brazil                                                                      more than 21 thousand pizzerias in Brazil
                      Largest gap among KFC and McDonald’s stores between
                      LatAm countries

                                  1.023
                                                                                                                                 Three main pizzerias chains in Brazil with
                                                                                                KFC                              approximately 3.4% of the market
                                                                   418 387
                     231                                                                        MCD                              Pizza hut is in second place, with 234 total
                             84           73 84        95 79                    138
                19                                                                    31                                         restaurants
              Argentina       Brazil       Chile     Colombia Mexico              Peru

  Sources: Euromonitor, Geofusion, McDonalds, KFC and IMC
  Note: (1) For information on the Company’s projection for stores opening, please refer to Section 11 of the Company’s “Formulário de Referência”, available at CVM (Comissão de Valores
           Mobiliários) and our IR websites
                                                                                                                                                                                            15
3 Clear Growth Avenues
  Margaritaville and Frango Assado
  Clear growth avenues for IMC within its core brands

                             Frango Assado                                         Margaritaville

                        Solid same-stores sales
                        performance in a challenging                           Strong cash flow generation
                        macro environment                                      >80% of EBITDA is converted in cash
                        Frango Assado reported positive quarterly
                        SSS since 1Q17(1)

                                                                               Expansion supported by
                        Huge and fragmented existing                           property owner is generating
                        market                                                 high ROIC
                        Currently there are 1,100 road restaurants             IMC contributes with 50% of the Capex and
                        only in São Paulo state                                charge 3-4% management fee over sales

                        Search for high ROIC brownfield
                        opportunities                                          Expansion in iconic locations in
                        Main focus in the Brazilian Southeastern               the U.S.
                        region 4 – 5 years of payback

  Note: (1) Except for 2Q18 due truckers strike effect and 1Q20 due Covid-19
                                                                                                                     16
4 Execution Capability
  KFC and Pizza Hut Expansion Case Study
  New stores opening record in a month, with 20 Pizza Hut units and 15 KFC units opened in
  December/2019
                                                               Strong Expertise in Opening New Stores
                                             Pizza Hut
                                             Pizza Hut + KFC   1                             2

                                                6

                                                               Shopping Palladium Curitiba   Shopping Bourbon Wallig
                                                                  (3 stores in Curitiba)     (1st Store in Porto Alegre)

                                                               3                             4

                                3 5
                                 4
                               1

                                                                Lago Azul in Bandeirantes        Shopping Patio Cianê
                           2      +41 new Pizza Hut                       Road                   (1st store in Sorocaba)

   +27 new KFC                    restaurants in 2019          5                             6
   restaurants in 2019
                                                         225
                                      184
        57         84

                                                                Delco Vila Nova Conceição          Juazeiro do Norte
     2018 KFC   2019 KFC        2018 Pizza       2019 Pizza
      Stores     Stores         Hut Stores       Hut Stores

                                                                                                                           17
4 Execution Capability
  Mapped Potential New Restaurants
  IMC has mapped all potential new restaurants in Brazil

                           Mapped Potential New Restaurants Strategy

                            5.6k cities with population
                            above 30k

                                                    Different type of locations:
                                                    shopping malls, strip malls, gas
                                                    station, hypermarkets and street
                                                    stores

             12k influence areas
                                                                   Inputs:
                                                                    Influence area existing stores
                                                                    Data enrichment
                                                                    Correlation analysis
                                                                    Input city models
                                                                    Local models application

                                                                                                      18
5 Strong Increase in Efficiency
  Central Kitchen Overview
  Strong potential for margin expansion with the implementation of Central Kitchen for the
  restaurant chains

                                                           More modern and improved kitchen
                                                           •   Located in Louveira / SP, 60 km
                                                               from São Paulo
                                                           •   67% fewer employees
                                                           •   2.3x higher production capacity

                                                           Operational since December/2019
                                                           •   New kitchen started in December
                                                           •   Old Viena kitchen closed in
                                                               December

                                                           Gradual implementation in
                                                           restaurants with strong synergies
                                                           •   Beginning in January 2020
                                                           •   High cost savings due to synergies

                                                                                                    19
5 Strong Increase in Efficiency
  Central Kitchen Main Products
  Centralized and scalable production of a wide variety of products for IMC businesses

                       Tomato Sauce                         Cheese bread

                    Coxinha Production                       Deep-frozen
                           Line                               Products

                       Deep-frozen                      Baked Semolina Bread
                      Semolina Bread

                                                                                         20
5 Strong Increase in Efficiency
  Central Kitchen Opportunities
  Gradual implementation of Central Kitchen in the restaurant chains, capturing important
  synergies
           First Wave                       Second Wave                        Third Wave

  •   Initial implementation in     •   Implementation of             •   Implementation of
      Brazilian IMC operation:          Central Kitchen in own            Central Kitchen in
      Viena, Frango Assado              stores and franchise              Frango Assado
      and Airport Restaurants           stores: Pizza Hut                 franchises products

           Airport
         Restaurants
                                    •   Pizza doughs production
  •   Initial Food retail               with strong cost
      production: “Biscoito de          reduction for Pizza Hut
      Polvilho”                         stores

                                    •   Food retail production:
                                        Semolina bread

                                                                                                21
6 Focus on Growth Businesses

  IMC has been simplifying its malls portfolio in recent years, selling unprofitable brands and
  focusing on businesses with attractive returns
                     Malls Portfolio in 31-Dec-2016                                     Malls Portfolio in 25-May-2020

                                                                                                                         (1)

                                            1%
                                                                                                      Sales    1%
                          1%                               1%                                   4%

              2%                                                1%                 8%

    16%                                                                1%

                                                                             25%

                                                                     77%                                                       62%
                                                                            86% in markets
                                                                            with high growth

  Note: (1) Does not include two restaurants in airports
                                                                                                                               22
6 Other Businesses Overview

   IMC has a wide variety of brands that complement its portfolio in more specific segments such
   as shopping malls and airports
                     Other Businesses Highlights                                        Brands Overview

 IMC has a diversified portfolio, operating restaurants inside and
  outside shopping malls and airports
 IMC’s other businesses are present in Brazil, Colombia and                       31     Buffet style restaurant
  Panama

                                                                             (1)

                                                                                   6      Brand focused in Italian food

                                                                                   15     Restaurant focused on stuffed potatoes

                                                                                   12     Colombian Arepas Specialist

                                                                                   8      The best of hamburger on the grill

                                                                       # Restaurants

   Note: (1) Considering two restaurants in airports
                                                                                                                                23
7 Strong Cash Generation in USD

FX Impact (Theoretical Exercise)(1,2)

                                                                                                                                                         Adjusted EBITDA(3) 2019
                                                                                 Adjusted EBITDA(3)
         Adjusted EBITDA(3)                                                                                                With +/- 5%                 annualizing(4) Pizza Hut + KFC
                                                                                  2019 with US$ at
                2019                                                                                                      change in US$                Operations and US$ at R$5.40
                                                                                       R$5.40                             change +/- 3%
                                             + R$ 29mm (+19.3%)                                                                                                              203
                                                                                                                           the EBITDA

                                                                                                 179                                                                          60
                    150
                                                                                                  60
                     45                                                                                                                                                       61

                     46                                                                           61

                                                                                                                                                                              82
                     59                                                                           59

                   2019                                                                         2019                                                                        2019
     EBITDA Margin: 9.4%                                                           EBITDA Margin: 9.8%                                                            EBITDA Margin: 10.1%

             30%                                                                        34%             33%                                                          30%
                             39%                                                                                                                                                     40%

                 31%                                                                             34%                                                                    30%

                                                                                                                                                    Brazil             USA            Caribbean
   Notes: (1) Colombian Peso updated to: R$ 0,001435 = COP 1; (2) Does not consider IFRS-16 effect; (3) Adjusted EBITDA excluding special items (impairment due to closures and stock option
            program) and pre-opening expenses; (4) Annualized by multiplying by six the two months (Nov + Dec / 19) of Pizza Hut and KFC operation
                                                                                                                                                                                                  24
Seasoned Management Team and Board of
8
    Directors
    Experienced management team supported by strong shareholders

                         Board of Directors                                                       Management Team

                         Flavio Benício Jansen Ferreira                         Newton Maia
                                                                                                CEO IMC
                         Chairman of the Board                                  Salomão Alves

                                                                                Sergio          Head of
                                                                                Cardona         Caribe                 Airport Restaurants

    Marcel Fleischmann                            Rodrigo Neiva Furtado         David
                                                                                                Head of US
    Independent Member                            Independent Member            Crabtree

                                                                                Jerônimo de     Head of KFC and
                                                                                Souza           Olive Garden

                                                                                Fabiano         Head of Frango
                                                                                Strelow         Assado and Pizza Hut
    Joseph B. Call                                  José Agote
    Member                                          Member                      Andrea          Head of RA Catering,
                                                                                Piccinato       Viena and Batata Inglesa

                                                                                                Shareholders Structure
                                                                                      Martins                                        Others and
                                                                                      Family                                          Treasury
                                                                             21.3%    12.9%     7.6%      5.5%     5.2%      2.1%      45.4%

    Charles Pimentel Martins                      Lincoln Pimentel Martins
    Member                                        Member

                                                                  Educação

                                                                                                                                             25
Section III

                             Covid-19 Update

INTERNATIONAL MEAL COMPANY
IMC SSS – Jan + Feb Performance
  A first two months that had been showing good same-store sales performance(1)

 SSS in Reais                                                                                                   SSS Constant Currency

                                                   Jan-Feb                  March                                                                                 Jan-Feb                March
  Roads                                              8.9%                  (31.9%)                              Roads                                                8.9%               (31.9%)
  Air                                                0.7%                  (39.5%)                              Air                                                  0.7%               (39.5%)
  Malls Pro Forma                                    8.8%                  (44.1%)                              Malls Pro Forma                                      8.8%               (44.1%)
    Pizza Hut                                        4.7%                  (37.1%)                                Pizza Hut                                          4.7%               (37.1%)
    KFC                                             13.8%                  (45.8%)                                KFC                                              13.8%                (45.8%)
Brazil Pro Forma                                     7.3%                  (37.2%)                            Brazil Pro Forma                                       7.3%               (37.2%)
USA                                                 16.8%                  (45.9%)                            USA                                                    4.3%               (56.4%)
Caribbean                                            9.2%                  (34.1%)                            Caribbean                                            (0.5%)               (42.4%)
IMC Pro Forma                                        9.5%                  (39.6%)                            IMC Pro Forma                                          5.8%               (43.7%)

  Note: (1) Pro Forma: Management information that includes the Pizza Hut and KFC operations that were not present in 2019, Same Pizza Hut and KFC Stores = Own store revenue + 6% of
  franchisees royalties revenue
                                                                                                                                                                                           27
Update on Covid-19
Adopted measures related to Covid-19 impacts

                                             Expenses Reduction and Cash                        Update on the Strategy to Resume
Business Operations / Delivery                      Preservation                                    Businesses Operations

Delivery as an alternative source           Team reduction                                             Road (25 stores opened)
of revenue                                  Active IMC employees                                       Reduced hours will be adjusted
Delivery expanded +179% since the first     (Dec-19 base)                                              according to traffic recovery on
week of March (+324% in KFC and                                                                        the roads
+100% in Pizza Hut), mitigating the sales   100,0% 96,0%      96,0%
decline in Brazil (the region sustained                                                                Airports (2 stores opened
sales in 30% of what was before covid)                                 61,0%                           and 5 caterings operating)
                                                                               32,0%   33,0%           Main airlines have shown
                                                                                                       growth # of daily flights and
57% of all stores are                                                                                  capacity in June vs. May
opened and 80% of these
                                            dez/19   jan/20   fev/20   mar/20 abr/20   mai/20
opened stores are                                                                                      Shopping Malls (227
                \
operating through                           Simplification of\ IMC’s structure                                  \
                                                                                                       stores opened)
delivery                                    16 mall stores closed permanently                          90% delivering
                                            in Brazil
Launch of Frango                            12 airports stores closed permanently                      USA (16 stores opened)
                                            in Brazil                                                  54% decrease in revenue in the
Assado in the city of
                                            2 stores closed in the Caribbean                           week of May 17-23 (vs. same
São Paulo                                                                                              period last year), even with
                                                                                                       reduced hours and capacity
Security and safety                         Renegotiation of rents
standards to maintain high                                                                             Caribbean
                                                                                                       Airports to resume flights in
productivity                                CAPEX suspension of projects
                                                                                                       Panama and Colombia from
Home Office and protective                  in the initial phase                                       June
equipment for employees

                                                                                                                                       28
Positives Perspectives for IMC’s Businesses
   After Covid-19
   Restaurants market and airport traffic has shown fast recovery in countries where economic
   activity has been resuming from Covid-19 lockdowns
   Food service companies in the US already show                                                                   …As well as in airports, with increasing number of
   sights of recovery from Covid-19 impact, with an                                                                  weekly airline seat-capacity in China(1) (mm)
  increase in the average daily revenue compared to
                the same day in 2019…
 60.0%                                                                                                        16

 40.0%                                                                                                        14                               238% more airline
                                                                                                                                               seats in 17th June
 20.0%                                                                                                        12                             than in 26th February,
                                                                                                                                                      2020)
  0.0%                                                             Growth of                                  10
                                                                   20pp since
 (20.0%)                                                              22nd                                     8
                                                                     March,
                                                                     2020)
 (40.0%)                                                                                                       6

 (60.0%)                                                                                                       4

 (80.0%)                                                                                                       2

(100.0%)                                                                                                       0
       Jan-20           Feb-20           Mar-20           Apr-20           May-20                              Jan-20           Feb-20   Mar-20     Apr-20      May-20     Jun-20

            Restaurants in States that have allowed dining rooms to                                                        China's economy has recovered at an accelerated rate, with
            reopen are outperforming the rest of US by 22pp (May 26th,                                                     an increase in the number of flights
            2020)

   Source: OAG Aviation Worldwide and Womply data
   Note: (1) (x) Considers seat capacity in and out China, including both domestic and international. Schedule based on 4th May, 2020
                                                                                                                                                                                29
Section IV

                             Financial Highlights

INTERNATIONAL MEAL COMPANY
Financial and Operational Highlights(1)

  Net Revenue                                                                                           Adjusted EBITDA and EBITDA Margin
(R$ mm)                                                                                               (R$ Million and %)
                                                                                                        2000

           1541                        1582          1603
                         1495                                                                                                     8.4%           9.0%         9.4%
                                                      191                                                            7.0%                                                  6.9%
            195                         191
                          179
                                                                                                                                                                                      (1.8%)
            391           368           439           450
                                                                                                                                                 142          150
                                                                                                                                   126
                                                                                                                      108
                                                                    362           367
            955           947           952           962            47           42
                                                                     82           72                                                                                        25
                                                                    234           252

           2016          2017          2018          2019          1Q19          1Q20                                                                                                      (7)
                             Brazil      USA       Caribbean                                                         2016         2017           2018         2019         1Q19           1Q20

  Same-Store-Sales (SSS)                                                                                Number of Stores
(Growth in R$,%)                                                                                      (#)                                                                                         501
                                                                                                                                                                                            498
                                                                                                                                                                                             40    39
 30%                                                                                                                                                                                         22    22
 20%

 10%                                                                                                                                                                                        250   264
                                                                                                               252   242    241            227   222
                                                                                             (5.7%)                               231                   213          210
                                                                                                               48    46     46             43    43            212          195     194
   0%                                                                                                                             44
                                                                                             (8.0%)                                                     42     43    43
                                                                                                               20    19     20    20       22    22                         44      44
 -10%                                                                                        (9.0%)                                                     22     22    22     22      22
                                                                                           (13.2%)             184   177    175                                                             186   176
 -20%                                                                                                                             167      162   157    149    147   145    129     128
 -30%
         1Q17 2Q17 3Q17 4Q17 1Q18 2Q18 3Q18 4Q18 1Q19 2Q19 3Q19 4Q19 1Q20                               1Q17 2Q17 3Q17 4Q17 1Q18 2Q18 3Q18 4Q18 1Q19 2Q19 3Q19 4Q19 1Q20

                         IMC            Brazil          Caribbean             USA                                           Brazil - Own     Brazil - Franchises     USA         Caribbean

Note: (1) Does not consider IFRS-16 effect; For more information, please refer to the Company’s Financial Information available at CVM (Comissão de Valores Mobiliários) and our IR websites
                                                                                                                                                                                                        31
Financial and Operational Highlights(1)

  Indebtedness and Leverage                                                                               Breakdown by Type (1Q20)(2)
                                                                                   2.7x
(R$ mm)
                                                        1.8x
                                                                     1.3x                                 Foreign currency                                         Libor
                                         0.5x                                                                   20%
                          0.2x                                                                                                                                     27%
           (0.3x)

                                                     603                         601
                                                                   416
                                       334                 270                         325
          160            206 22              66                          184

               (31)
            2016          2017          2018            2019        1Q19           1Q20
                                                                                                                                                                                         CDI
                                                                                                                                 Local currency
                  Gross Debt            Net Debt             Net Debt/ Adjusted EBITDA                                                                                                   73%
                                                                                                                                      80%

  Pro-Forma Debt Amortization Schedule (1Q20)(3)
(R$ mm)

                 277                                                                                                                                                                  286

                                                                                                                                                     125
                                                                                                                    107
                                                   67
                                                                                    16

    Cash and Cash Equivalent                    Short-Term                       9M2021                             2022                             2023                             2024

Notes: (1) Does not consider IFRS-16 effect; (2) Does not consider debt raised to finance past acquisitions (R$49mm as of 1Q20); (3) Adjusted reflecting renegotiation of debentures terms
                                                                                                                                                                                               32
Adjusted EBITDA and Margin(1)

(R$ mm)

              7.0%                            8.4%            9.0%                9.4%                   6.9%
                                                                                                                (1.8%)
                                                                     +6%
                                                     +13%
                                                                                  150
                             +16%                             142

                                              126
                                                                                   45
                108                                            49

                                               46

                 48                                                                46
                                                               46
                                               36

                 35                                                                                       25
                                                                                   58                     11
                                               44              47
                 25                                                                                        2       6
                                                                                                          12      (2)
                                                                                                                 (11)

                                                                                                                  (7)
               2016                           2017            2018                2019                   1Q19   1Q20

                                                     Brazil   USA     Caribbean          EBITDA Margin
Notes: (1) Does not consider IFRS-16 effect
                                                                                                                         33
You can also read