(NASDAQ: BYND) Investor Presentation - August 5, 2021
←
→
Page content transcription
If your browser does not render page correctly, please read the page content below

(NASDAQ: BYND)
Investor Presentation
August 5, 2021

Disclaimer
This presentation contains, in addition to historical information, certain forward-looking statements that are based on our current assumptions, expectations
and projections about future performance and events and relate to, among other matters, our future financial performance, our business strategy, industry
and market trends, future expectations concerning our market position, future operations and capital expenditures.

Forward-looking statements generally contain words such as "believes," "expects," "may," "will," "should," "seeks," "approximately," "intends," "plans,"
"estimates," "anticipates," and similar expressions. These forward-looking statements are only predictions, not historical fact. You should, therefore, not rely
on these forward-looking statements as representing our views as of any date subsequent to the date of this presentation. Forward-looking statements are
based on information available at the time those statements are made and/or management’s good faith belief as of that time with respect to future events and
are subject to risks and uncertainties that could cause actual performance or results to differ materially from those expressed in or suggested by the forward-
looking statements. Important factors that could cause actual results to differ materially from expectations include, among others: the duration, magnitude and
effect of the COVID-19 pandemic including on our supply chain, the demand for our products, our product and channel mix, the timing and level of retail
purchasing, our manufacturing facilities and operations, our inventory levels, our ability to expand and produce in new geographic markets or the timing of
such expansion efforts, the pace and success of new product introductions, the timing of new foodservice launches, and on overall economic conditions and
consumer confidence and spending levels; estimates of our expenses, future revenues, capital expenditures, capital requirements and our needs for
additional financing; our ability to identify and execute cost-down initiatives intended to achieve price parity with animal protein; the effects of increased
competition from our market competitors and new market entrants; our ability to effectively manage our growth; the failure of acquisitions and other
investments to be efficiently integrated and produce the results we anticipate; the success of operations conducted by joint ventures; the timing and success
of distribution expansion and new product introductions in increasing revenues and market share; the timing and success of strategic partnership launches
and limited time offerings resulting in permanent menu items; the timing and level of trade and promotion discounts; our ability to effectively manage and
expand our manufacturing and production capacity, forecast demand and manage our inventory; our ability to successfully enter new markets, manage our
international expansion and comply with any applicable laws and regulations; the success of our marketing efforts and the ability to grow brand awareness,
maintain, protect and enhance our brand, attract and retain new customers and grow our market share; changes in consumer tastes and trends; changes in
government regulations and policies; legislation or changes in laws affecting plant-based meat, the labeling or naming of our products, or our brand name or
logo; availability and prices of raw materials for our products; the impact of inflation across the economy; outcomes of legal or administrative proceedings; the
financial condition of, and our relationship with our suppliers, co-manufacturers, distributors, retailers and foodservice customers; the ability of our suppliers
and co-manufacturers to comply with food safety, environmental or other laws or regulations; the effectiveness of internal controls; and general economic
conditions. We are under no duty to update any of these forward-looking statements after the date of this presentation except as otherwise required by law.

Our historical results are not necessarily indicative of the results to be expected for any future periods and our operating results for the three and six months
ended July 3, 2021 are not necessarily indicative of the results that may be expected for any other interim periods or any future year or period.

This presentation also contains estimates and other statistical data obtained from independent parties and by us relating to market size and growth and other
data about our industry and ultimate consumers. The number of retail and foodservice outlets are derived from data through June 2021. This data involves a
number of assumptions and limitations, and you are cautioned not to give undue weight to such estimates and data. In addition, projections, assumptions and
estimates of our future performance and the future performance of the geographic and other markets in which we operate are necessarily subject to a high
degree of uncertainty and risk.

“Beyond Meat,” “Beyond Burger,” “Beyond Sausage,” “Beyond Breakfast Sausage,” “Beyond Breakfast Sausage Links,” “Beyond Breakfast Sausage Patties,”
“Beyond Meatballs,” “Beyond Chicken Tenders,” the Caped Steer Logo and “The Future of Protein” are registered trademarks of Beyond Meat, Inc. in the
United States and, in some cases, in certain other countries. All other brand names or trademarks appearing in this presentation are the property of their
respective holders. Solely for convenience, the trademarks and trade names in this presentation are referred to without the ® and ™ symbols, but such
references should not be construed as any indicator that their respective owners will not assert, to the fullest extent under applicable law, their rights thereto.
                                                                                                                                                                    2
Non-GAAP Financial Measures
Beyond Meat uses the non-GAAP financial measures set forth below in assessing its operating performance and in its financial communications.
Management believes these non-GAAP financial measures provide useful additional information to investors about current trends in the Company's
operations and are useful for period-over-period comparisons of operations. In addition, management uses these non-GAAP financial measures to assess
operating performance and for business planning purposes. Management also believes these measures are widely used by investors, securities analysts,
rating agencies and other parties in evaluating companies in our industry as a measure of our operational performance. These non-GAAP financial
measures should not be considered in isolation or as a substitute for the comparable GAAP measures. In addition, these non-GAAP financial measures
may not be computed in the same manner as similarly titled measures used by other companies.

Adjusted gross profit and Adjusted gross margin

Adjusted gross profit is defined as net revenues less cost of goods sold adjusted to exclude, when applicable, costs attributable to COVID-19 activities
which are not considered to be part of the Company’s normal business activities. Adjusted gross margin is defined as Adjusted gross profit divided by net
revenues.

Adjusted gross profit and Adjusted gross margin are presented to provide additional perspective on underlying trends in the Company’s gross profit and
gross margin, which we believe is useful supplemental information for investors to be able to gauge and compare the Company’s current business
performance from one period to another.

Adjusted net (loss) income and Adjusted net (loss) income per diluted common share

Adjusted net (loss) income is defined as net (loss) income adjusted to exclude, when applicable, costs attributable to COVID-19, as well as other special
items, which are those items deemed not to be reflective of the Company’s ongoing normal business activities.

Adjusted net (loss) income per diluted common share is defined as Adjusted net (loss) income divided by the number of diluted common shares
outstanding.

We consider Adjusted net (loss) income and Adjusted net (loss) income per diluted common share to be indicators of operating performance because
excluding special items allows for period-over-period comparisons of our ongoing operations. Adjusted net (loss) income per diluted common share is a
performance measure and should not be used as a measure of liquidity.

Adjusted EBITDA and Adjusted EBITDA as a % of net revenues

Adjusted EBITDA is defined as net loss adjusted to exclude, when applicable, income tax expense, interest expense, depreciation and amortization
expense, restructuring expenses, share-based compensation expense, expenses attributable to COVID-19, and Other, net, including interest income, loss
on extinguishment of debt and foreign currency transaction gains and losses. Adjusted EBITDA as a % of net revenues is defined as Adjusted EBITDA
divided by net revenues.

                                                                                                                                                            3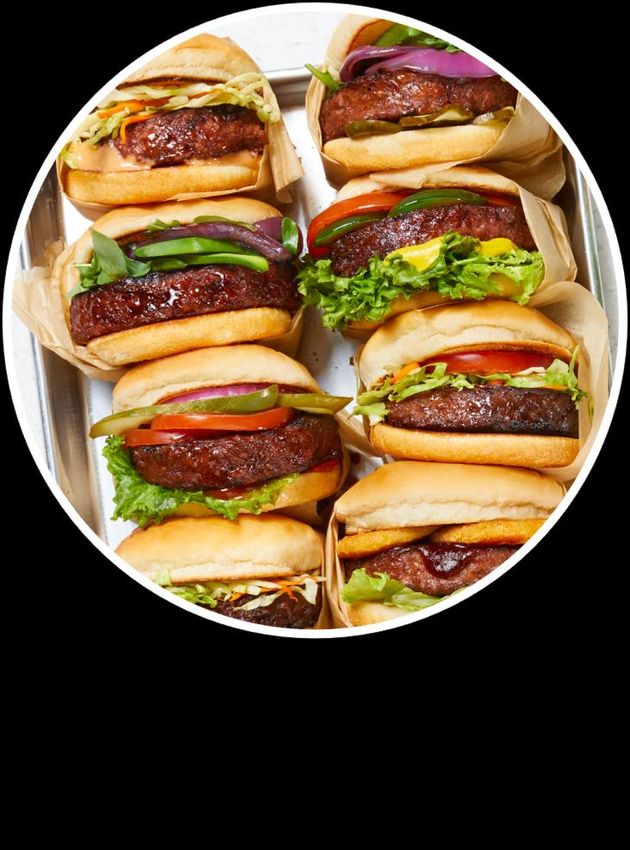
Business Overview

We Use Proprietary Science to Redefine Meat
                              Beyond Meat’s Proprietary Technology & Process are Used to Replicate
                                    Animal Meat’s Principal Components from Plant Proteins

We begin with meat’s COMPOSITION versus its animal ORIGIN               Then replicate its core structure & sensory experience

  Microscopy Comparing Beyond Sausage to Pork Sausage                   Actual Images of the Beyond Burger and Ground Beef

      Scanning Electronic Microscopy    Confocal Laser Microscopy
                                                                                    Raw                           Cooked

Beyond                                                              Beyond
Sausage                                                             Burger

  Pork                                                              Ground
Sausage                                                              Beef

                                                                                                                                 5
We are Committed to Providing Products that Enable
    Consumers to Eat What You LoveTM

                           42%                                                          18-51%                                                              78%                                                  60 - 70 Billion
     Reduced risk of developing heart                                        Of global greenhouse gas                                 Of all agricultural land is used for                                        Farm animals reared for
    failure associated with people who                                          emissions driven by                                   livestock, including grazing land                                              food each year5
       eat a mostly plant-based diet1                                          livestock rearing and                                    and cropland dedicated to the
                                                                                    processing3                                               production of feed4

                           30%                                                                                                                              29%
      Of most cancers in developed                                                                                                     Of the water in agriculture is
      countries attributed to dietary                                                                                              directly or indirectly used for animal
    factors, including consumption of                                                                                                           production 3
               certain meats2

         With current food production systems threatening both human health and environmental sustainability,
      plant-based diets offer a growing global population a solution of healthy diets and sustainable food systems6
1 Plant Based Diet Associated with Less Heart Failure Risk Report, presented at the American Heart Association scientific meeting, November 13, 2017.
2 Key, Timothy J. et al., Diet, nutrition and the prevention of cancer, Scientific background papers of the joint WHO/FAO expert consultation, Geneva, 28 January - 1 February 2002, Public Health Nutrition, Vol 7, No. 1(A), Supplement 1001, February
2004.
3 Reprinted from Water Resources and Industry, Volumes 1–2, March–June 2013, P.W. Gerbens-Leenes, M.M. Mekonnen, A.Y. Hoekstra, The water footprint of poultry, pork and beef: A comparative study in different countries and production systems,

  Page No. 26, Copyright (2013), with permission from Elsevier.
4 Livestock’s Long Shadow-Environmental Issues and Options, Food and Agriculture Organization of the United Nations, 2006.
5 Compassion in World Farming, Strategic Plan 2013-2017.
                                                                                                                                                                                                                                                           6
6 Food in the Anthropocene: the EAT–Lancet Commission on healthy diets from sustainable food systems, 2019.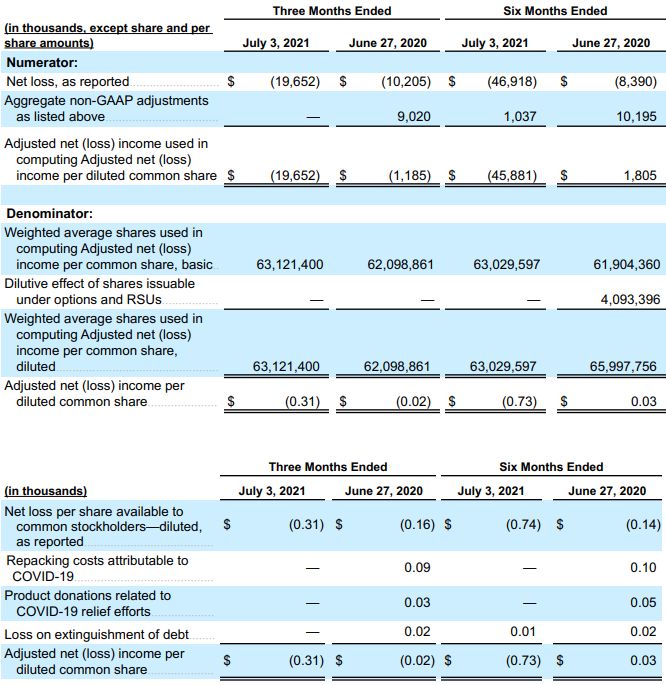
Innovation is at the Core of our Company and is a
    Key Differentiator
                  Innovation Strategy Led by Highly
                                                                                   State-of-the-Art Innovation Center
                    Respected Team of Scientists

       •    Large, experienced team composed of scientists,                •   R&D Application Lab
            engineers, researchers, technicians, and chefs
                                                                           •   Color / Encapsulation Lab
       •    Work seamlessly with internal chefs and food
            technologists to ensure the best quality in terms              •   Analytical Lab
            of taste, texture and other sensory attributes
                                                                           •   Chemical Lab

                                                                           •   Microbiology / Fermentation Lab
       R&D as a % of Net Revenue (Most Recent          FY)1
                                                                           •   Pilot Plant

                                                                           •   Test Kitchen

                                                                     30,000 Sq. Ft Manhattan Beach
                                                                        Project Innovation Center
                                                                            (El Segundo, CA)

                 Beyond Meat’s products are driven by proprietary technology and a relentlessly focused innovation team

1 Data derived from public filings
2 Kellogg is the parent company of Morningstar Farms
3 WH Group is the parent company of Smithfield Foods
4 Conagra is the parent company of Gardein                                                                                7
5 Kraft Heinz is the parent company of Boca Burger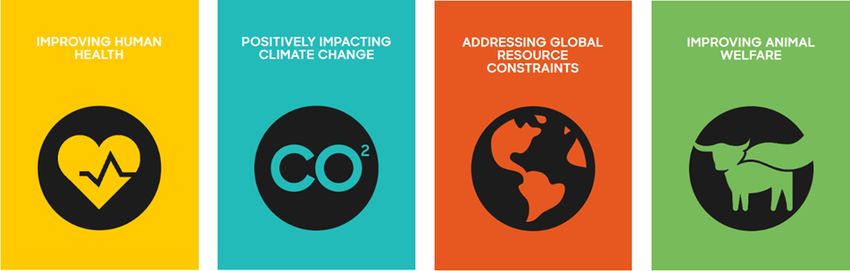
Recent Notable Updates
Our Approach to Product and Strategy has Made Us a
  Leading Disruptor in the Meat Category
                          We are Disrupting
                                                                                                               Net Revenues ($ Millions)
                     the Largest Category in Food

              $1.4tn                                              $270bn
       Size of the Global Meat                                Size of the U.S Meat
              Category1                                            Category1

                Beyond Meat is the Future of Protein

                37%                                                  ~1.7x
         2019 FY - 2020 FY                                 Increase in Manufacturing
        Revenue YoY Growth                                         Capacity2

           ~34,000                                                ~34,000
               U.S Stores                                         U.S Outlets
              Retail Rollout                                   Foodservice Rollout

           ~51,000                                              ~119,000
        International Outlets                                      Total Outlets
              Retail and                                            Worldwide
        Foodservice Rollout3

1 According to Fitch Solutions Macro Research, a division of Fitch Solutions, research data, August 6, 2018.
2 As of end of Q2 2021, as compared to end of Q2 2020.
3 Includes Canada.

                                                                                                                                           9
Total Distribution and Brand Awareness

1 Totals may not add up due to rounding.
2 Presentation of International distribution outlets now includes Canada, which was historically combined with US distribution.
3 Unaided brand awareness represents results of the answer to, “what brands, if any, come to mind when you think of a meat alternative product?” At IPO based on Oct 2018 survey of

1,004 people, July 2021 based on July 2021 survey of 1,004 people.
4 Total brand awareness represents the answer to “which of the following meat alternative brands have you heard of before today?” and “which of the following other brands have you   10
heard of before today?” At IPO based on Oct 2018 survey of 1,004 people, July 2021 based on July 2021 survey of 1,004 people.
U.S. Retail Velocity and Market Share Trends

                                                                          1                                                                                                           2

Source: SPINS Data through June 13, 2021
1 Includes aggregate data for Beyond Meat products across all Frozen and Refrigerated Plant-Based Meats in the US MULO channel only
2 Includes aggregate data for Beyond Meat products across all Frozen and Refrigerated Plant-Based Meats in both the US MULO and US Natural Enhanced channels

* Growth in total distribution points (TDP) for the Beyond Meat brand was up 58%, 55% and 55% year-over-year for the 52-week, 12-week and 4-week periods ended June 13, 2021, respectively
                                                                                                                                                                                             11
Sales by Distribution Channel
U.S Retail U.S Foodservice International
Net Revenues ($ Millions) Net Revenues ($ Millions) Net Revenues ($ Millions)
Select Customers Select Customers Select Customers
Select Highlight Select Highlight Select Highlight
Retail points Foodservice International
~17,000 ~34,000 of distribution
across the
~12,500 ~34,000 outlets across ~1,650 ~51,000 Retail and
the United Foodservice
United States States outlets
carrying carrying carrying
At IPO June Beyond Meat At IPO June At IPO June
Beyond Meat Beyond Meat
2021 products 2021 products 2021 products
12Recent Notable Updates
Beyond Meat Rapid & Relentless Innovation Program Is Designed to Make Our Existing
Products Obsolete, Generate New Products & Platforms, and Serve A Widening Circle of
Customers
Customers Products International
We continue to expand our We continue to focus on innovation, Available in more than 80 countries
foodservice partnerships, with the including rollouts of both new and worldwide
announcement of new or expanded enhanced product offerings
customer relationships Other Notable Highlights:
Multiple new product launches / • Beyond Chicken Tenders wins 2021
enhancements over the past 2 years FABI Award (National Restaurant
Association)
August 2021 July 2021 International Supply Chain
Canada US
Nationwide LTO Limited Test Beyond Chicken Beyond Beef 3.0
Tenders (2021)
(2021) Established 1st extrusion facility outside
of the U.S in Enschede, Netherlands
(Full commercial production expected
in Q3)
April 2021 March 2021
US US Opened new state-of-the-art
Beyond Breakfast
Permanent Item Permanent Item Beyond Burger 3.0
manufacturing facility in Jiaxing, China
Sausage Links
(2021) (2020) (Commenced commercial production
in April 2021)
March 2021
US January 2021 Beyond Breakfast
Permanent Item Sweden + Denmark Beyond Meatballs Sausage Patties
Limited Test (2020) (2020)
13Financial Update
Q2 2021 Performance Update

                            Highlights

 •       Net revenues increased 32% to $149.4
         million, primarily due to increased foodservice
         channel sales, reflecting recovery from
         significantly reduced demand levels in the
         year-ago period brought on by COVID-19.
         Retail channel net revenues increased 6%
         primarily due to increased distribution and
         sales among international customers, partially
         offset by lower U.S. retail channel sales.

 •       Gross margin was 31.7% with the YoY
         decrease primarily due to higher fixed
         overhead costs per unit, increased
         transportation costs, and higher depreciation
         and amortization expense, partially offset by
         lower direct materials cost per unit.

 •       Loss from operations was $18.6 million with
         the increase in loss from operations primarily
         driven by growth in overall headcount levels,
         increased investments in marketing,
         increased production trial activities, higher
         restructuring expenses primarily reflecting
         increased legal expenses, and higher
         outbound freight costs included in the
         Company's selling expenses, partially offset
         by the increase in gross profit.

1 Unaudited
2 See   appendix for reconciliation of Adjusted gross profit, Adjusted gross margin, Adjusted net loss, Adjusted EBITDA and Adjusted EBITDA as a % of net revenues.

                                                                                                                                                                      15
Net Revenue Growth by Channel
Net Revenue by Channel Highlights
YoY Growth (%) • Maintained solid total revenue
2019 2020 2020 YTD1 2021 YTD1
growth despite cycling consumer
panic-buying period in Q2 2020:
U.S
Retail 160% 104% 180% 1%
◦ Total foodservice net
U.S 240% (14)% 15% 40% revenues increased more than
Foodservice
threefold vs. Q2 2020
International 1,432% 136% 319% 195%
Retail
◦ Key brand metrics of
International
403% (45)% (9)% 17%
Household Penetration, Buyer
Foodservice Rate, Purchase Frequency
Consolidated 239% 37% 96% 22% and Repeat Rate all increased
year-over-year2
($ Millions) ◦ Multiple levers for growth
remain, including foodservice
channel distribution growth,
international penetration and
new product innovations
• Continued investment in
infrastructure and capabilities to
support future growth
• Continued to support future revenue
growth through incremental
investments in innovation, marketing,
operations and strategic customer
partnerships
1 Unaudited 16
2 SPINS Consumer Panel Data as of 06/27/2021Gross Margin and Operating Expense Update
Gross Profit and Margin OpEx and OpEx % of Net Revenues Highlights
Gross Margin Operating Expenses2 as % of Net Revenues • YoY gross margin increase
primarily driven by non-
33.5% 30.1% 33.9% 31.1% 36.9% 47.9% recurrence of product
repacking activities attributable
($ millions) R&D as % of Net Revenues to COVID-19 in the year-ago
period and lower direct
5.8% 11.5% material costs per unit,
partially offset by higher fixed
($ millions)
overhead costs per unit,
increased transportation costs,
and higher depreciation and
amortization expense.
• Operating expenses were
higher primarily due to growth
in overall headcount levels to
support the Company's
international growth and
operations and innovation
capabilities, increased
investments in marketing,
increased production trial
activities, higher restructuring
expenses primarily reflecting
Adjusted increased legal expenses, and
EBITDA1 $25.3 $11.8 $25.6 $(13.1)
($ millions)
higher outbound freight costs
included in the Company's
selling expenses.
1 See appendix for reconciliation of Adjusted EBITDA
2 Restructuring expenses are included in SG&A operating expenses
17Appendix
Reconciliation of Non-GAAP Financial Measures
    Reconciliation of Adjusted gross profit, Adjusted gross margin and Adjusted net (loss) income (unaudited)

                                                                                                                19
Reconciliation of Non-GAAP Financial Measures
Reconciliation of Adjusted Net (Loss) Income per Diluted Common Share (unaudited)
20Reconciliation of Non-GAAP Financial Measures
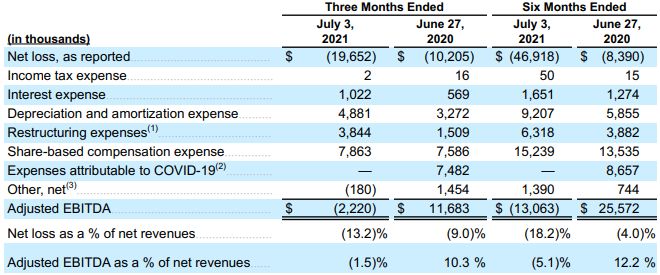
Reconciliation of Adjusted EBITDA (unaudited)
1Primarilycomprised of legal and other expenses associated with the dispute with a co-manufacturer with whom an exclusive supply agreement was terminated in May 2017.
2Comprised of $5.9 million in repacking costs attributable to COVID-19 and $1.6 million in product donation costs related to the Company’s COVID-19 relief campaign in the three months ended
June 27, 2020, and $5.9 million in repacking costs attributable to COVID-19 and $2.8 million in product donation costs related to the Company’s COVID-19 relief campaign in the six months
ended June 27, 2020.
3Includes $1.0 million in loss on extinguishment of debt associated with termination of the Company's credit facility in the six months ended July 3, 2021 and $1.5 million in loss on
extinguishment of debt associated with the Company's refinanced credit arrangements in the three and six months ended Jun 27, 2020.
21You can also read